
Face Segregation and Recognition by Cortical
Multi-scale Line and Edge Coding
J. Rodrigues
1
and J. M. H. du Buf
2
1
University of Algarve, Escola Superior Tecnologia, 8005-139 Faro, Portugal
2
University of Algarve, Vision Laboratory - FCT, 8005-139 Faro, Portugal
Abstract. Models of visual perception are based on image representations in
cortical area V1 and higher areas which contain many cell layers for feature
extraction. Basic simple, complex and end-stopped cells provide input for line,
edge and keypoint detection. In this paper we present an improved method for
multi-scale line/edge detection based on simple and complex cells. We illustrate
the line/edge representation for object reconstruction, and we present models for
multi-scale face (object) segregation and recognition that can be embedded into
feedforward dorsal and ventral data streams (the “what” and “where” subsys-
tems) with feedback streams from higher areas for obtaining translation, rotation
and scale invariance.
1 Introduction
Our visual system is by far the most complicated but also least understood part of our
body. At the retinal level, already twelve types of different bipolar cells have been iden-
tified. These perform complex inhibitory and excitatory interactions in the inner plex-
iform layer [1]. Apart from the rods and cones, the common photoreceptors, retinal
ganglion cells have been identified that have no (in)direct connection to rods and cones,
but their dendrites act as photoreceptors. These ganglion cells transfer luminance in-
formation to central brain regions, including the LGN (lateral geniculate nucleus), for
controlling the circadian clock (solar day), the eyes’ iris muscles (pupil size), and prob-
ably for providing a global background in brightness perception [2]. The LGN was long
considered to be a simple relay station between retinal ganglion cells and the primary
visual cortex. Recent research shows that perhaps only 10% of LGN input comes from
the retinas, i.e. the other 90% consist of feedback from cortical areas, and that the LGN
may play a role as information “gatekeeper” through visual attention [3]. The latter
finding implies that the what and where subsystems, which are thought to be driven by
short-term memory in inferior-temporal (IT) and prefrontal (PF) areas, have feedback
loops to areas V4, V2 and V1 [4, 5], even down to the LGN.
In V1 there are simple and complex cells, which are tuned to different spatial fre-
quencies (scales) and orientations, but also disparity (depth) because of the left-right
hypercolumns, e.g. [6,7]. These cells provide input for grouping cells that code line
and edge information and that attribute depth information. There also are end-stopped
cells that, together with complicated inhibition processes, allow to extract keypoints
Rodrigues J. and M. H. du Buf J. (2006).
Face Segregation and Recognition by Cortical Multi-scale Line and Edge Coding.
In 6th International Workshop on Pattern Recognition in Information Systems, pages 5-14
DOI: 10.5220/0002474300050014
Copyright
c
SciTePress

(singularities, vertices and points of high curvature). Recently, models of simple, com-
plex and end-stopped cells have been developed, e.g. [8]. In addition, several inhibition
models, e.g. [9], keypoint detection [8,10] and line/edge detection schemes [9–12], in-
cluding disparity models [13,10], have become available. On the basis of these models
and neural processing schemes, it is now possible to create a cortical architecture for
figure-ground segregation, e.g. [14], and Focus-of-Attention (FoA), bottom-up and/or
top-down [4, 15], including object detection and recognition.
A difficult and still challenging application, even in machine vision, is face detec-
tion and recognition. Despite the impressive number and variety of methods devised
for faces and facial landmarks, e.g. [16], complicating factors that still remain are pose
(frontal vs. profile), beards, moustaches and glasses, facial expression and image con-
ditions (lighting, resolution). Despite these complications, it is important to develop
cortical models for detection and recognition, in order to improve our insight into pos-
sible, neural processing schemes, e.g. [17].
In this paper we will focus exclusively on the multi-scale line/edge representation
based on simple and complex cells in V1, a representation which is common in per-
ception models but not in computer vision. We present an improved model for line and
edge detection, and we apply this within the context of a cortical architecture, the where
and what systems, with an emphasis on face (object) detection and recognition.
We stress that we will not employ the multi-scale keypoint representation that also
exists in area V1, in order to study the importance of the line/edge representation. It
has been shown, e.g. [15], that keypoints alone provide very important information
for FoA, object categorisation and facial landmark detection. Also, we will not tackle
complications referred to above, because we will argue, in the Discussion, that low-level
processing in area V1 needs to embedded into a much wider context, and this context
is expected to solve many problems.
2 Line/Edge Detection and Classification
Gabor quadrature filters provide a model of receptive fields (RFs) of cortical simple
cells (see e.g. [9,15]). We apply filters with an aspect ratio of 0.5 and half-response
width of one octave. The scale s will be given by λ, the wavelength, in pixels (all images
shown are of size 256 × 256 pixels). Responses of even and odd simple cells, which
correspond to the real and imaginary parts of a Gabor filter, are denoted by R
E
s,i
(x, y)
and R
O
s,i
(x, y), s being the scale, i the orientation (θ
i
= iπ/(N
θ
− 1)) and N
θ
the
number of orientations (here we use N
θ
= 8). Responses of complex cells are modelled
by the modulus C
s,i
(x, y) = [{R
E
s,i
(x, y)}
2
+ {R
O
s,i
(x, y)}
2
]
1/2
.
A basic scheme for single-scale line and edge detection based on responses of sim-
ple cells works as follows [12]: a positive (negative) line is detected where R
E
shows
a local maximum (minimum) and R
O
shows a zero crossing. In the case of edges the
even and odd responses are swapped. This gives 4 possibilities for positive and negative
events. An improved scheme [10] consists of combining responses of simple and com-
plex cells, i.e. simple cells serve to detect positions and event types, whereas complex
cells are used to increase the confidence. Since the use of Gabor modulus (complex
6

cells) implies a loss of precision at vertices [18], increased precision was obtained by
considering multiple scales (neighbouring micro-scales).
The algorithms described above work reasonably well but there remain a few prob-
lems: (a) either one scale is used or only a very few scales for increasing confidence,
(b) some parameters must be optimised for specific input images or even as a function
of scale, (c) detection precision can be improved, and (d) detection continuity at curved
lines/edges must be guaranteed.
We present an improved algorithm with no free parameters, truly multi-scale, with
new solutions for problems (c) and (d). With respect to precision, simple and complex
cells respond beyond line and edge terminations, for example beyond the corners of
a rectangle. In addition, at line or edge crossings, detection leads to continuity of the
dominant events and gaps in the sub-dominant events. These gaps must be reduced
in order to reconstruct continuity. Both problems can be solved by introducing new
inhibition schemes, like the radial and tangential ones used in the case of keypoint
operators [10]. Here we use lateral (L) and cross-orientation (C) inhibition, defined as:
I
L
s,i
(x, y) = [C
s,i
(x + dC
s,i
, y + dS
s,i
) − C
s,i
(x − dC
s,i
, y − dS
s,i
)]
+
+
[C
s,i
(x − dC
s,i
, y − dS
s,i
) − C
s,i
(x + dC
s,i
, y + dS
s,i
)]
+
; (1)
I
C
s,i
(x, y) =
C
s,(i+N
θ
/2)
(x + 2dC
s,i
, y + 2dS
s,i
) − 2.C
s,i
(x, y)+
C
s,(i+N
θ
/2)
(x − 2dC
s,i
, y − 2dS
s,i
)
+
. (2)
where (i + N
θ
/2) ⊥ i, with C
s,i
= cos θ
i
and S
s,i
= sin θ
i
and d = 0.6s. Inhibition is
applied to complex cell responses, where β controls the strength of the inhibition (we
use β = 1.0), i.e.
ˆ
C
s,i
(x, y) =
C
s,i
(x, y) − β{I
L
s,i
(x, y) + I
C
s,i
(x, y)}
.
Line/edge detection is achieved by constructing a few cell layers on top of simple
and complex cells. The first layer serves to select active regions and dominant orienta-
tions. At each position, responses of complex cells are summed (
ˆ
C
s
=
P
N
θ
−1
i=0
ˆ
C
s,i
),
and at positions where
ˆ
C
s
> 0 an output cell is activated. At active output cells,
the dominant orientation is selected by gating one complex cell on the basis of non-
maximum suppression of
ˆ
C
s,i
. The gating is confirmed or corrected by an excita-
tion/inhibition process of dominant orientations in a local neighborhood.
In the second layer, event type and position are determined on the basis of active
output cells (1st layer) and gated simple and complex cells. A first cell complex checks
simple cells R
E
s,i
and R
O
s,i
for a local maximum (or minimum by rectification) using a
dendritic field size of ±λ/4, λ being the wavelength of the simple cells (Gabor filter).
The active output cell is inhibited if there is no maximum or minimum. A second cell
complex does exactly the same on the basis of complex cells. A third cell complex gates
four types of zero-crossing cells on the basis of simple cells, again on ±λ/4. If there
is no zero-crossing, the output cell is inhibited. If there is a zero-crossing, the active
output cell at the position of the zero-crossing cell determines event position and the
active zero-crossing cell determines event type.
In the third layer, the small loss of accuracy due to the use of complex cells in the
second layer is compensated. This is done by correcting local event continuity, consider-
ing the information available in the second layer, but by using excitation of output cells
7
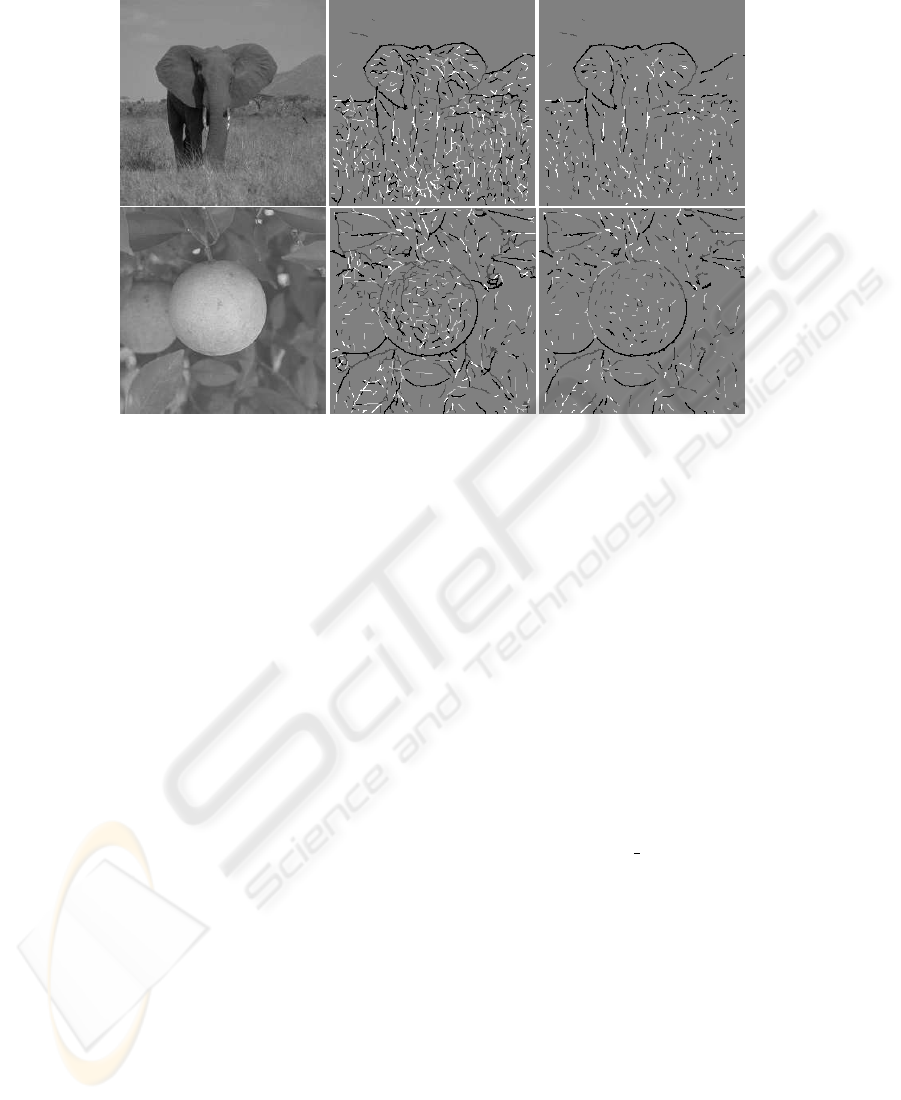
Fig.1. Fine-scale line/edge detection and NCRF inhibition (right).
by means of grouping cells that combine simple and complex cells tuned to the same
and two neighbouring orientations. The latter process is an extension of linear group-
ing [12] and a simplification of using banana wavelets [19]. In the same layer, event
type is corrected in small neighborhoods, restoring type continuity, because the cell
responses may be distorted by interference effects when two events are very close [18].
Figure 1 shows detection results with positive and negative lines and edges coded
by different gray levels. Detection accuracy is very good and there remain many small
events due to low-contrast textures and the fact that no threshold value has been applied
(no event amplitudes are shown!). Most events in textured regions can be suppressed by
NCRF inhibition (last column). For comparing results (elephant image) obtained with
NCRF we refer to [9], but we note that they developed contour (edge) detection algo-
rithms, whereas we can distinguish between edges and lines with different polarities,
which is necessary for visual reconstruction; see below. To compare results in the case
of the orange image with edge-only computer vision algorithms, i.e. Bergholm, Canny,
Iverson and Nalwa, see [20] and http://marathon.csee.usf/edge/edge detection.html.
3 Multi-scale Representation and Reconstruction
For illustrating scale space we can create an almost continuous, linear scaling with 288
scales on λ = [4, 40] , but here we will present only a few scales. Figure 2 shows events
detected at five scales: λ = {4, 12, 18, 24, 40}. In the case of the solid square and star
objects, at fine scales (left) the edges of the square are detected, as are most parts of the
star, but not at the very tips of the star. This illustrates an important difference between
normal image processing and developing cortical models. The latter must be able to
8
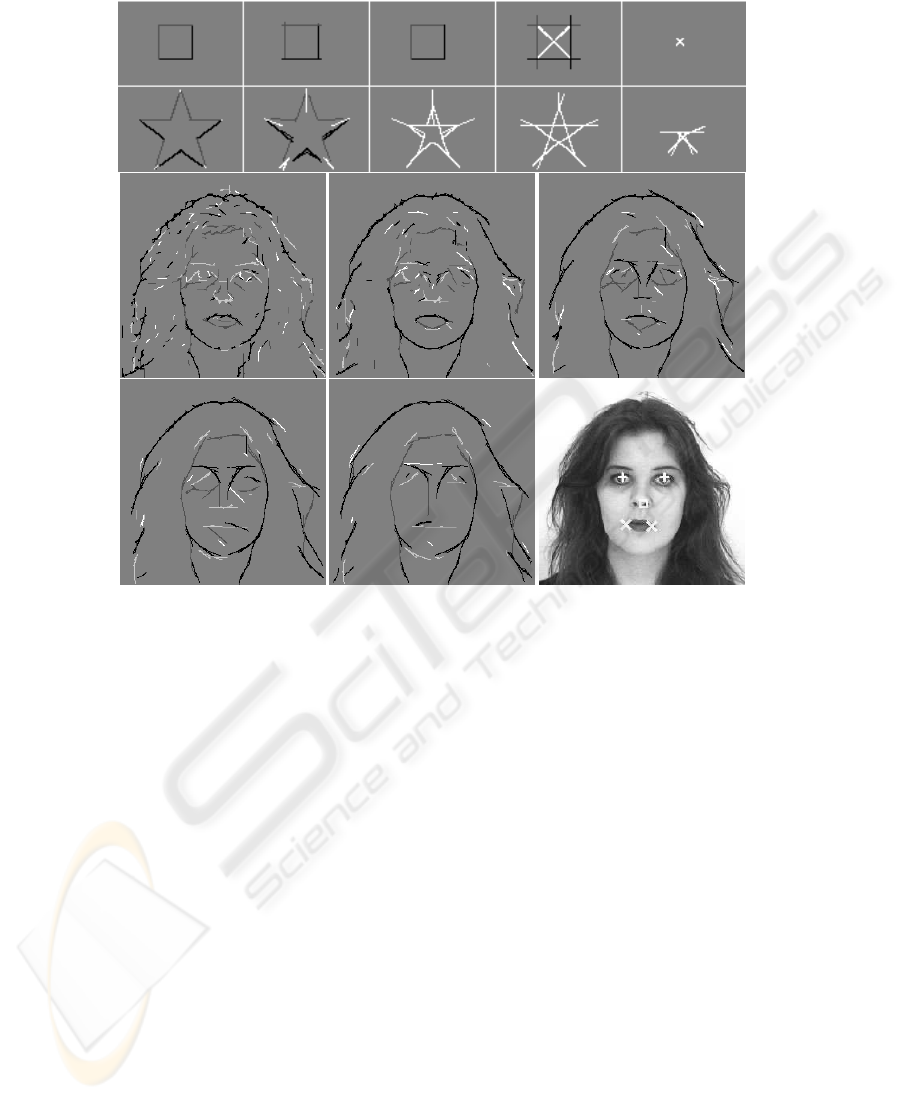
Fig.2. Multi-scale representations of a square, a star and Fiona image, the latter with detected
facial landmarks (see text).
construct brightness maps, and at the tips of the star, where two edges converge, there
are very fine lines. The same effect occurs at coarser scales (right), until entire triangles
are detected as lines and even pairs of opposite triangles. In the case of the square, lines
will be detected at diagonals, which will vanish, with very small event amplitudes, at
very coarse scales. Figure 2 (bottom) shows the Fiona image with events detected at the
same scales, with decreasing amount of detail at coarser scales but stable outlines of the
face and hair—a caricature-like abstraction that is also obtained by other scale spaces,
e.g. [21]. Also shown (bottom-right) are facial landmarks used by grouping operators
in keypoint scale space for face detection (see Discussion and [15]).
Image reconstruction can be obtained by assuming one lowpass filter plus a com-
plete set of (Gabor) wavelets that cover the entire frequency domain—this concept is
exploited in image coding. The goal of our visual system is to detect objects, with
no need, nor capacity, to reconstruct a complete image of our visual environment, see
change blindness and the limited “bandwidth” of the what and where subsystems [5].
Yet, the image that we perceive in terms of brightness must somehow be created. An
image coding scheme, for example by summing responses of simple cells, requires ac-
cumulation in one cell layer which contains a brightness map, but this would require
9
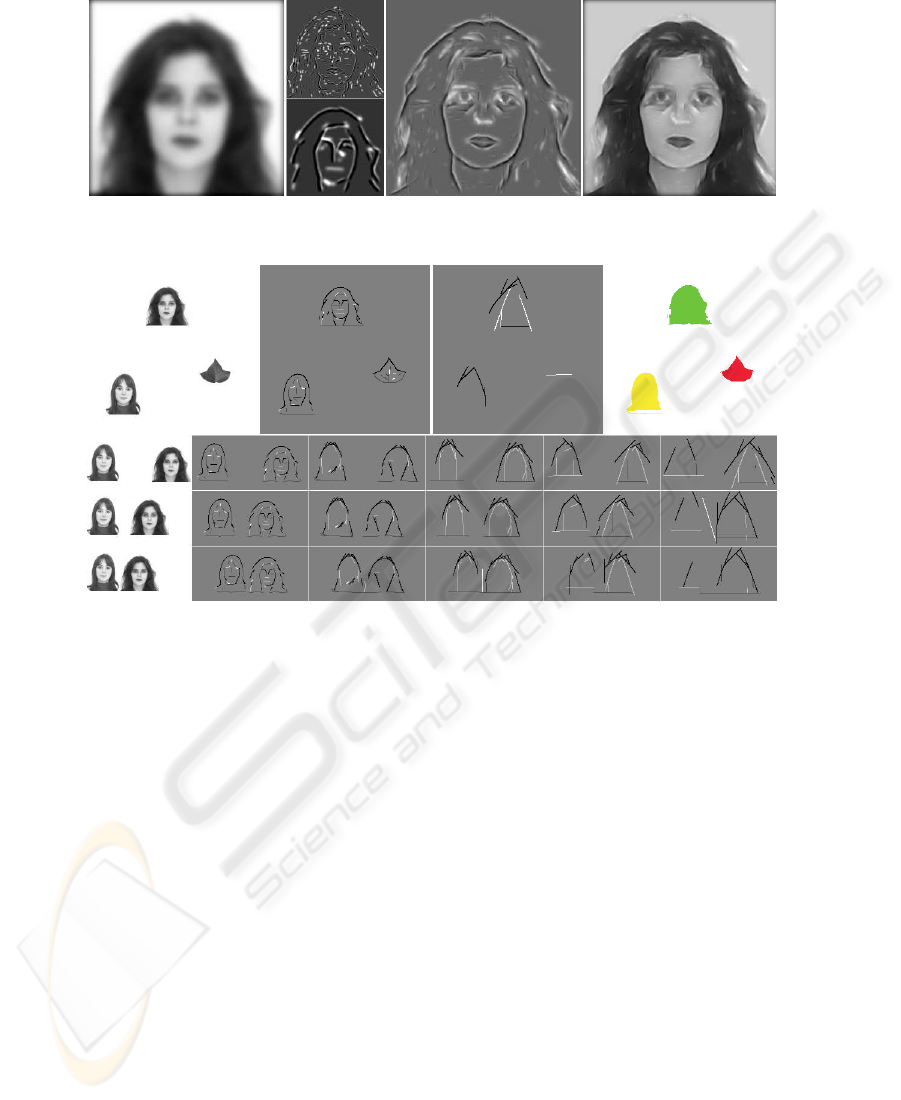
Fig.3. Reconstruction (see text).
Fig.4. Top, from left to right: input, representations at λ = 4 and 40, and figure-ground segrega-
tion. Bottom: object interference at coarse scales (λ = {5, 15, 25, 35, 45}).
yet another “observer” of this map in our brain. The solution to this dilemma is to as-
sume that detected lines and edges are interpreted symbolically: an active “line cell”
is interpreted as a Gaussian intensity profile with a certain orientation, amplitude and
scale, the size of the profile being coupled to the scale of the underlying simple and
complex cells. In the same way an active “edge cell” is interpreted, but with a bipolar,
Gaussian-truncated error-function profile. As for image coding, this representation must
be complemented with a lowpass filter: the retinal ganglion cells with photoreceptive
dendritic fields not (in)directly connected to rods and cones [2].
One brightness model [22] is based on the symbolic line/edge interpretation. It ex-
plains Mach bands by the fact that simple cell responses cannot distinguish between
lines and ramp edges, and it was shown to be able to predict many brightness illusions
such as simultaneous brightness contrast and assimilation, which are two opposite in-
duction effects [23]. Here we will not go into more detail; we will only illustrate the
symbolic reconstruction process in 2D (the model referred to above was tested in 1D).
Figure 3 shows, from left to right, a lowpass filtered image of Fiona, symbolic line/edge
representations at two scales, combined representations over 4 scales, and the latter
10

combined with the lowpass image. Using more scales leads to better reconstructions,
but the relative weighting of all components requires further investigation.
4 Object Detection and Segregation
Until here we have illustrated the multi-scale line/edge detection in area V1 and the
symbolic interpretation for reconstruction, but the goal of the visual cortex is to detect
and recognise objects by means of the what and where systems. Rensink [5] argued that
these systems can attend only one object at any time. In the Deco and Rolls model [4],
the ventral what system receives input from V1 which proceeds through V2 and V4 to
IT. The dorsal where system connects V1 and V2 through MT to area PP. Both systems
are “controlled,” top-down, by attention and short-term memory with object represen-
tations in PF, i.e. a what component from PF46v to IT and a where component from
PF46d to PP. The bottom-up (visual input code) and top-down (expected object and
position) data streams are necessary for obtaining size, rotation and position invariance,
which means that object templates in memory may be normalised. Here we will not go
into more detail, because our goal is not to (re)implement the entire model. Our goal is
to show how the line/edge code can be used in the what and where systems, focusing
on multi-scale processing.
Figure 4 (top row) shows an image with two faces and a leaf, plus detected events
at a fine scale (middle-left), with all relevant information, and at a coarse scale (middle-
right), with reduced and “deformed” information. At the coarse level, each individual
event (group of responding line/edge cells) or connected group of events corresponds
to one object. Each event at the coarse scale is related to events at one finer scale, which
can be slightly displaced or rotated. This relation is modeled by downprojection using
grouping cells with a dendritic field, the size of which defines the region of influence. A
responding event cell activates a grouping cell; only if the grouping cell is also excitated
by responding event cells one level lower, a grouping cell at the lower level is activated.
This is repeated until the finest scale. This coarse-to-fine-scale process is complemented
by inhibition: other grouping cells at the finest scale are activated by responding event
cells at that scale, and these grouping cells excitate the grouping cells at the one coarser
scale. This results in a figure-ground map at the first coarser scale “above” the finest
scale (Fig. 4 top-right). This result was obtained with λ = [4, 40], ∆λ = 4.
A process as described above can be part of the where system, but it cannot obtain
size, rotation and position invariance; it needs to be embedded into the Deco and Rolls
model [4]. In addition, when two objects are very close, they will become connected at
coarse scales (Fig. 4 bottom row), and separation is only possible by the what system
that checks features of individual objects.
5 Face Recognition
We assume that templates (views) of faces are stored in memory
3
and that these have
been built through experience. When the where system detects a face, the attentional
3
We will not go into the view-based vs. mental-rotation discussion.
11

system will direct the what system in order to check features for identification. Here we
present a very simple, straightforward recognition scheme for testing the line/edge rep-
resentation, assuming that input and stored faces are more or less normalised in terms
of position and size. From the Psychological Image Collection at Stirling University
(UK), we selected 88 face images of 25 persons in frontal and (near) 3/4 view, with dif-
ferent expressions, half against a dark and half against a white background. For typical
examples see Fig. 5.
Because small rotations and changes in expression do not significantly change the
line/edge representations at coarser scales, and because in practical applications frontal
and/or 3/4 views with different expressions may be represented in a database, we created
only 25 templates, one for each person, by randomly selecting one of the available im-
ages. The multi-scale line/edge representation was computed at 8 scales equally spaced
on λ = [4, 30]. Classification was done using all 88 images. For each template, at each
scale, a positional relaxation area [24] was created around each responding event cell,
by assuming grouping cells with a dentritic field size coupled to the size of underlying
complex cells. These grouping cells sum the occurence of events in the input images
around event positions in the templates, a sort of local correlation, and activities of all
grouping cells were grouped together (global correlation). The final grouping was com-
pared over the 25 templates, scale by scale, and the template with maximum response
was selected. Finally, the template with the maximum number of correspondences over
the 8 scales was selected (in the case of 4-4 the second template). Figure 5 shows in
the upper-left corner of each image 8 bars (scales) with the length of the bar being the
number of the selected template (1–25). Despite the extreme simplicity of the method,
average recognition rate was 90% when only grouping events (no discrimination be-
tween lines and edges) and 92% when lines and edges were grouped separately. Mis-
classifications were only due to extreme expression (Fig. 5 bottom-right) or wrong view
(last images on first and second row), although some images were correctly identified
(2nd image on 2nd row and 1st image on 4th row). Also, added noise (4th image on
1st row) and glasses (4th image on 3rd row) were no problem. Our result (92%) is very
close to the 94% obtained by Petkov, Kruizinga and Lourens [17].
6 Discussion
In this paper we presented an improved scheme for line/edge (event) detection on the
basis of simple and complex cells. This scheme has no thresholds nor free parameters,
it improves completeness and continuity, and it can be applied at many scales. If nec-
essary, events due to textures can be suppressed by NCRF inhibition [9], such that sig-
nificant image structures are preserved. We showed that the multi-scale representation
and symbolic interpretation are suitable for visual reconstruction, which is necessary
for developing a 2D brightness model on the basis of one that was tested in 1D [23].
We also presented simple schemes for object segregation and face recognition.
The line/edge representation at coarser scales leads to a stable abstraction of image
features (Fig. 2). This explains, at least partly, the generalisation that allows to clas-
sify faces with noise, glasses, and relatively normal expressions and views (Fig. 5). It
should be stressed that the recognition scheme is not yet complete, because a hierar-
12
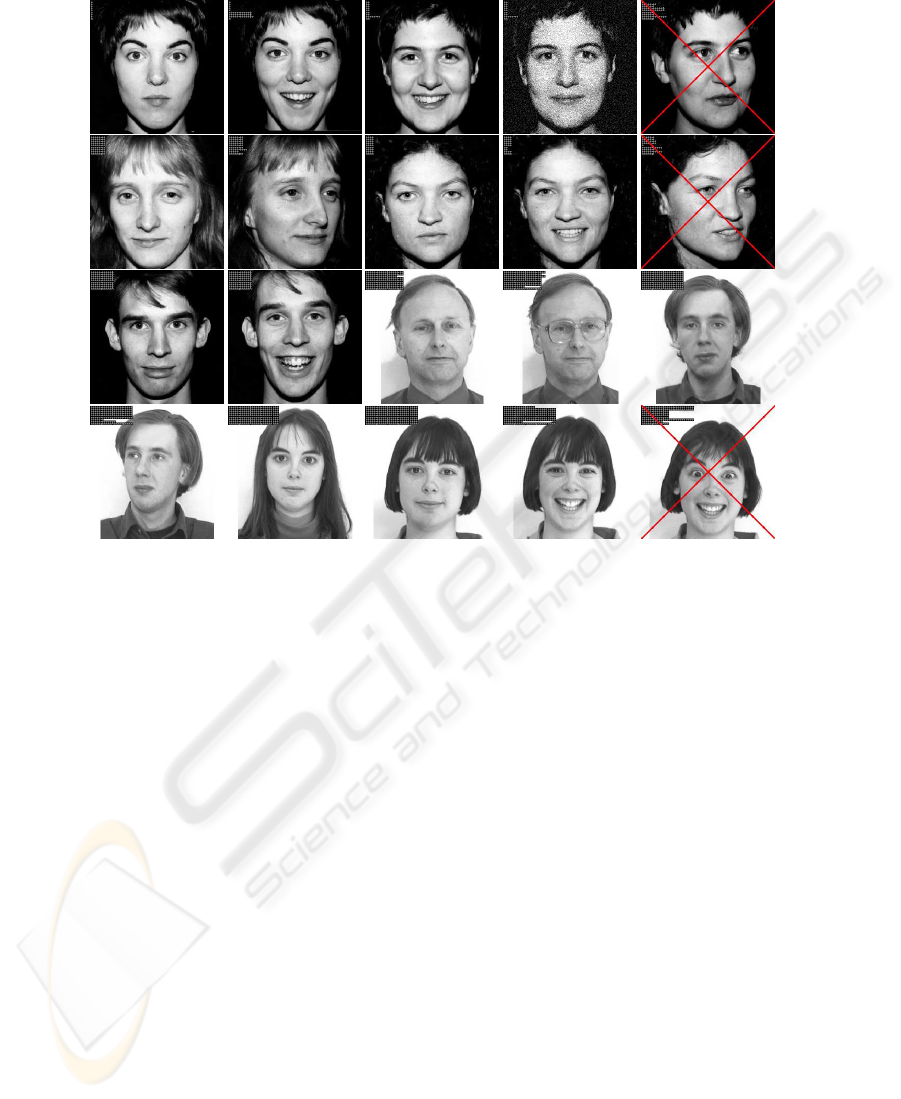
Fig.5. Examples of recognised and unrecognised (crossed) faces.
chical linking from coarse to fine scales, as already applied in the segregation process,
has not been applied. Such an extension can lead to better recognition rates, especially
when multiple views (frontal, 3/4 and side) of all persons are included as templates in
“memory.” In addition, the multi-scale keypoint representation [15], which has not been
employed here, will contribute very important information.
All multi-scale processing and the representations, including keypoints, are restricted
to area V1. On the other hand, the Deco and Rolls scheme [4], with ventral and dorsal
data streams, necessary for obtaining translation and scale invariance through projec-
tions via areas V2, V4 etc., is solely based on responses of simple cells. In the future,
this scheme must be based on features extracted in V1, and further multi-scale process-
ing can be added in higher areas V2 and V4. We expect that such extensions in adaptive
up and down projections will lead to much better results. Afterall, our visual system
does not have any difficulty in telling persons apart!
Acknowledgements
This investigation is partly financed by PRODEP III Medida 5, Action 5.3, and by
the FCT program POSI, framework QCA III. The Stirling images are available at
http://pics.psych.stir.ac.uk/
13

References
1. W
¨
assle, H.: Parallel processing in the mammalian retina. Nature Rev. Neuroscience 10
(2004) 747–757
2. Berson, D.: Strange vision: ganglion cells as circadian photoreceptors. TRENDS in Neuro-
sciences 26 (2003) 314–320
3. Kastner, S.: Beyond a relay nucleus: new views on the human LGN. Perception Suppl. 34
(2005) 36
4. Deco, G., Rolls, E.: A neurodynamical cortical model of visual attention and invariant object
recognition. Vision Res. (2004) 621–642
5. Rensink, R.: The dynamic representation of scenes. Visual Cogn. 7 (2000) 17–42
6. Rasche, C.: The making of a neuromorphic visual system. Springer (2005)
7. Hubel, D.: Eye, brain and vision. Scientific American Library (1995)
8. Heitger et al., F.: Simulation of neural contour mechanisms: from simple to end-stopped
cells. Vision Res. 32 (1992) 963–981
9. Grigorescu, C., Petkov, N., Westenberg, M.: Contour detection based on nonclassical recep-
tive field inhibition. IEEE Tr. IP 12 (2003) 729–739
10. Rodrigues, J., du Buf, J.: Visual cortex frontend: integrating lines, edges, keypoints and
disparity. Proc. Int. Conf. Image Anal. Recogn. Springer LNCS 3211 (2004) 664–671
11. Elder, J., Zucker, S.: Local scale control for edge detection and blur estimation. IEEE Tr.
PAMI 20 (1998) 699–716
12. van Deemter, J., du Buf, J.: Simultaneous detection of lines and edges using compound
Gabor filters. Int. J. Patt. Recogn. Artif. Intell. 14 (1996) 757–777
13. Fleet, D., Jepson, A., Jenkin, M.: Phase-based disparity measurement. CVGIP: Image Un-
derstanding 53 (1991) 198–210
14. Zhaoping, L.: V1 mechanisms and some figure-ground and border effects. J. of Physiology
(2003) 503–515
15. Rodrigues, J., du Buf, J.: Multi-scale keypoints in V1 and face detection. 1st Int. Symp.
Brain, Vision and Artif. Intell., Naples (Italy) Springer LNCS 3704 (2005) 205–214
16. Yang, M., Kriegman, D., Ahuja, N.: Detecting faces in images: A survey. IEEE Tr. PAMI
24 (2002) 34–58
17. Petkov, N., Kruizinga, P., Lourens, T.: Biologically motivated approach to face recognition.
Proceeding of International Workshop on Artificial Neural Networks’ (1993) 68–77
18. du Buf, J.: Responses of simple cells: events, interferences, and ambiguities. Biol. Cybern.
68 (1993) 321–333
19. Kr
¨
uger, N., Peters, G.: Object recognition with banana wavelets. Proc. 5th Europ. Symp.
Artificial Neural Networks (1997) 61–66
20. Heath, M., Sarkar, S., Sanocki, T., Bowyer, K.: A robust visual method for assessing the
relative performance of edge-detection algorithms. IEEE Tr. PAMI 19 (2000) 1338–1359
21. Lindeberg, T.: Scale-space theory in computer vision. Kluwer Academic Publishers, Dor-
drecht, The Netherlands (1994)
22. du Buf, J.: Ramp edges, Mach bands, and the functional significance of simple cell assembly.
Biol. Cybern. 70 (1994) 449–461
23. du Buf, J., Fischer, S.: Modeling brightness perception and syntactical image coding. Optical
Eng. 34 (1995) 1900–1911
24. Bar, M.: A cortical mechanism for triggering top-down facilitation in visual object recogni-
tion. J. Cogn. Neuroscience (2003) 600–609
14
