
ENWIC: VISUALIZING WIKI SEMANTICS AS TOPIC MAPS
An Automated Topic Discovery and Visualization Tool
Cleo Espiritu, Eleni Stroulia, Tapanee Tirapat
Department of Computing Science, University of Alberta, Edmonton, Alberta, Canada
Keywords: Novel E-learning interfaces and interactions, Web-based education software, Intelligent information and
knowledge management systems, Intelligent visualization tools.
Abstract: In this paper, we present ENWiC (EduNuggets Wiki Crawler), a framework for intelligent visualization of
Wikis. In recent years, e-learning has emerged as an appealing alternative to traditional teaching. The
effectiveness of e-Learning is depended upon the sharing of information on the web, which makes the web a
vast library of information that students and instructors can utilize for educational purposes. Wiki’s
collaborative authoring nature makes it a very attractive tool to use for e-Learning purposes; however, its
text-based navigational structure becomes insufficient as the Wiki grows in size, and this backlash can
hinder students from taking full advantage of the information available. ENWiC’s goal is to provide student
with an intelligent interface for navigating Wikis and other similar large-scale websites. ENWiC make use
of graphic organizers to visualize the relationships between content pages so that students can gain a
cognitional understanding of the content as they navigating through the Wiki pages. We describe ENWiC’s
automated visualization process, and its user interfaces for students to view and navigate the Wiki in a
meaningful manner, and for instructors to further enhance the visualization. We also discuss our usability
study for evaluating ENWiC’s effectiveness as a Wiki Interface.
1 INTRODUCTION
Wikis and blogs are becoming increasingly popular
means of on-line communication, collaboration and
information sharing. As of October 12, Wikipedia
(Wikipedia) contains over 2M articles in more than
20 languages and the numbers increase daily.
Furthermore, an abundance of domain-specific wikis
exist on a variety of topics, such as for example
computing science (http://c2.com/cgi/wiki,
http://wiki.java.net/bin/view/Javapedia/WebHome),
image sharing (http://www.openclipart.org/cgi-
bin/wiki.pl), etc.
The collaborative nature of information
publishing in Wikis makes them a convenient tool
for e-Learning purposes. Wikis are an ideal medium
for instructors and students to interact. It is easy to
add and modify Wiki content and to establish links
between Wiki pages. This ease of use strongly
encourages users to contribute content, giving the
Wiki an incredible wealth of information. However,
this wealth does come at a cost: the more pages a
Wiki has, the more difficult it becomes to navigate
through it. It is common for a Wiki page to contain a
sizable number of links in its body text. Users have
to read through the text to locate these links and to
guess what the next appropriate pages might be. It is
also easy for users to feel “lost” after having gone
through a number of links, since the standard wiki
interface does not provide any navigation context.
Furthermore, the nature of the relationship between
a page and its neighbors is not always intuitive,
since wikis do not impose any requirements on what
links are appropriate and do not support any
metadata for link annotation. To alleviate this
problem, some Wikis provide special purpose pages,
such as roadmaps, categories, and lists of back links.
However, it is not immediately apparent to the users
how to utilize these pages; novice wiki users,
especially, may not even be aware of the purpose
and usage of such pages. Even these special-purpose
pages are typically overwhelmingly long lists of text
links.
The objective of this work is to provide a more
intuitive user interface to wikis, in order to take
advantage of the large information repositories that
they provide. We are especially interested in
supporting student usage of wikis offering technical
content. Students accessing these wikis need an
easy-to-learn and easy-to-use interface that will
enable them to effectively locate information
relevant to their tasks and, in the process, to achieve
a deeper understanding of the concepts presented in
the various wiki pages.
The ENWiC (EduNugget Wiki Crawler) tool
builds on the EduNuggets framework (Stroulia &
35
Espiritu C., Stroulia E. and Tirapat T. (2006).
ENWIC: VISUALIZING WIKI SEMANTICS AS TOPIC MAPS - An Automated Topic Discovery and Visualization Tool.
In Proceedings of the Eighth International Conference on Enterprise Information Systems - HCI, pages 35-42
DOI: 10.5220/0002493900350042
Copyright
c
SciTePress

Jari 2003) and represents the structure of a Wiki as a
topic map (TopicMaps). A topic map models the
semantics of an application domain in terms of
topics, associations and their instances. Thus, it
imposes a structure to the domain data, which can
also provide the basis for a graphical visualization.
A web crawler is used to automate the topic-map
creation process, while further refinements can be
made by authoritative experts – such as instructors
or wiki moderators - to add concepts and structure to
the topic map. Since graphic organizers have been
shown to be useful in assisting students in learning
concepts and identifying relationships between
concepts (Amin 2005; Robinson & Skinner 1996),
we visualize the Wiki topic map as a graph to help
students navigate the Wiki. By defining different
types of associations in the topic map, different
types of graphic organizers can be created to service
each cognitive domain defined in Bloom's taxonomy
(Bloom 1956; Donelan). This will help students
achieve different levels of understanding of the
content faster than using only indices and text of the
Wiki.
The rest if the paper is organized as follows:
Section 2 will talk about related research; Section 3
will describe the goals and ideals of ENWiC and
give an overview of the program; Section 4 will
cover the details of the program; Section 5 will
discuss the experimentation we ran with ENWiC;
and finally, we will conclude what we have
discovered for ENWiC.
2 RELATED RESEARCH
Touchgraph (TouchGraph) released a Wiki browser
for the Meatball Wiki and the Emacs Wiki to
demonstrate their toolkit. It uses the link database of
a Wiki to create the graph. The downside to this
browser is that it will only work with Wikis that
have a link database, and there is no easy way to
manipulate the graph if a user wishes to do so.
TM4L (Topic Map For Learning) (Dicheva,
Dichev & Wang 2005) provides an editor and a
viewer for topic maps, designed for e-Learning
purposes. It provides pre-defined associations,
relationships and topic types to allow for easy
creation of learning content. It also supports user-
defined association types as well. The Viewer
visualizes the topic map in a graph or a tree, but it
does not provide a browser to let user directly access
the URIs that a topic node may contain.
The Platypus (Campanini, Castagna & Tazzoli
2004) and SHAWN (Aumueller 2005) tools use
semantic-web technologies to describe the ontology
of a Wiki. Both utilize RDF (Resource Description
Framework) metadata to structure and organize the
Wiki content. In the Platypus Wiki, users are
provided with a standard Wiki editor and a
companion metadata editor for each Wiki page.
Users can set up a site link table which maps a
keyword to a URL; when another user writes a Wiki
page, the tool will automatically look for keywords
from the site link table and covert them to links to
the corresponding URLs. When viewing a page, the
metadata is shown in a side panel to help with
navigation. In SHAWN, users can edit both the
metadata and the content of a page in the same
editor. SHAWN automatically displays forward
links and pages with relating metadata based on the
triplets entered by the author(s) of the page.
Smith (Smith & Fiore 2001) developed a set of
visualization tools for Usernet. Usernet can grow to
contain a very large number of messages, and like a
Wiki, a typical Usernet client just does not have an
adequate organization and navigation structure to
effectively convey the ontology of the messages.
Smith uses a number of information types - such as
the history of a thread and the participation history
of each user – to create a variety of views to
represent the threads in a newsgroup.
Canas and his colleagues (Canas et al. 2005)
described how concept maps, a type of graphic
organizer, can visualize ‘knowledge’ which will
assist users in organizing information and searching
information on the web. Their CmapTools represents
knowledge as concepts and propositions in a map.
CmapTools utilizes the concept maps to enhance
web search; a user can simply click on a concept
node, and search queries are generated based on
relating concepts and authority concepts. After
executing the search, the results are ranked based on
the distance matrices from the map.
Like CmapTools, VisSearch (Lee 2005) uses a
graph to enrich search results. Users create a search
graph that contains query nodes and associations
between them. The search graph can be reused; users
can select multiple nodes, which will combine the
existing queries to form a new query. Users can also
associate relevant bookmarks to a query node as a
means of organizing useful links. VisSearch also
takes advantage of search results from multiple users
to recommend potentially useful sites. A VisSearch
server takes search results from users with similar
interests and analyzes the data so that when another
user searches for similar information, it can
determine what results may be interesting to the
user.
3 ENWIC REQUIREMENTS
The primary objective of our work with ENWiC is
to provide an intuitive interface for users to
effectively navigate the Wiki structure to find
ICEIS 2006 - HUMAN-COMPUTER INTERACTION
36

information relevant to their tasks. The ENWiC
Viewer provides an interactive graphical interface
that visualizes the Wiki as a topic map. There are
two intuitions behind the ENWiC design, aimed to
support this objective. First, the ENWiC topic map
provides an overall view of the wiki organization
structure, thus enabling users to maintain a mental
model of their browsing history and current context.
The topic map can be visualized at different levels of
detail, so that users can control the amount of
information presented to them. Second, the ENWiC
graphic organizers represent distinct types of
substructures, easily recognizable by the users who
may choose to focus on them when they correspond
to the types of relations they are interested in.
Finally, as with the standard wiki interface, users
can always jump to a specific topic using a search
function, instead of browsing through the graph.
In addition to this primary functional
requirement, ENWiC was designed with the
following quality requirements in mind:
1. Implementation independence: Most graphical
wiki interfaces (Touchgraph, Platypus and
SHAWN) assume a particular Wiki
implementation. ENWiC works with all Wiki
implementation.
2. Automatic topic-map discovery: The topic-map
representation of the Wiki is generated
automatically, based on the wiki-pages
hyperlink structure. In addition ENWiC
attempts to discover domain-independent
relations, such as linear topic sequencing or
hierarchical topic dependencies, in order to
embed in the topic map distinct graphic
organizers that can assist users to navigate and
understand the visualization better.
3. Easy authoring of domain-dependent
semantics: ENWiC provides a simple tool to
add domain-dependent graphic organizers to
provide more semantics to the visualization.
To meet the first two requirements, ENWiC includes
a crawler that traverses the wiki pages. The crawler
examines the HTML tags of each page to extract
links and emphasized text such as header texts.
Links are followed to discover the complete Wiki
content pages and are treated as associations
between the “neighbouring” pages. Emphasized text
elements in a page are used as key terms for the
content page, and they are also used to classify links.
The third requirement is achieved by offering
instructors an authoring environment that allows
them to modify the crawler-discovered topic map to
enrich its content. Wizards are also provided to
guide them through the graphic organizer creation
process.
3.1 Bloom’s Taxonomy Graphic
Organizers
The design of ENWiC is largely inspired by the use
of graphic organizers in support of learning. Graphic
organizers such as spider maps, hierarchical
diagrams and charts can persuade students to engage
in a different kind of thinking instead of just
comprehending from text (Lamb 2001). Graphic
organizers let student see the ‘bigger picture’ instead
of just a part of the content. This addresses the
problem with a standard Wiki, where the action of
clicking through discrete pages only exposes parts of
the Wiki to the users.
Bloom’s taxonomy (Bloom 1956) describes six
different levels of cognitive understanding that a
learner can gain on a subject. Mastery at the
knowledge level implies a learner’s ability to
recognize and recall information on the subject.
Mastery at the comprehension level is accomplished
when the subject has grasped the domain’s
semantics and can interpret and analyze facts to infer
conclusions and make predictions based on them. At
the application level, the learner is able to apply the
knowledge in new contexts. A learner who has
mastered a domain at the analysis level can see
patterns and implicit organization in the domain
structure and at the synthesis level he is able to
generalize form the give fact and apply knowledge
from many areas to construct new information.
Finally, at the evaluation level, the learner can
assess presentation and theories about the domain.
Donelan (Donelan) relates a taxonomy of
graphic organizers to Bloom’s levels of
understanding.
a) At the knowledge level, spider maps and linear
strings support the learners’ ability to
remember basic facts on the subject.
b) At the comprehension level, hierarchy
diagrams enable them to understand the
semantic organization of the domain concepts.
c) At the application level, flow charts guide
learners to apply known facts to solve
problems.
d) At the analysis level, fishbone and concept
maps reflect the learners’ ability to explain
facts.
e) Idea map – at the Synthesis level - reflects the
ability to combine known facts to form
solutions for problems.
f) Double-cell diagrams and comparison matrices
- at the Evaluation level - reflect the ability to
rate concepts and information.
ENWiC supports all these Bloom’s graphic
organizers. The underlying intuition is that when
these organizers are used to present the domain
ENWIC: VISUALIZING WIKI SEMANTICS AS TOPIC MAPS - An Automated Topic Discovery and Visualization Tool
37
knowledge visually, the learners can pick up the
visual clues and accomplish a deeper level of
mastery faster. The ENWiC crawler automatically
builds different types of associations among topics
and the ENWiC viewer visually reflects these
relations. Additional graphical organizers can be
created using the ENWiC administration tool.
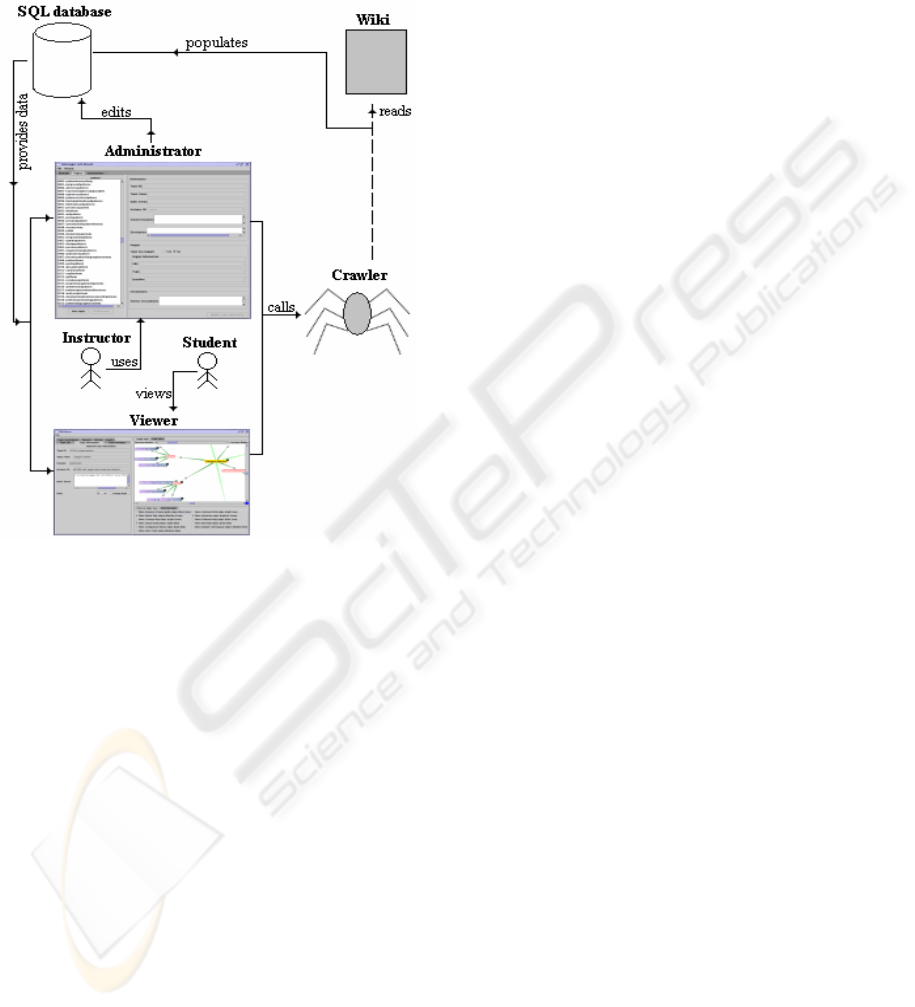
Figure 1: Overview of the ENWiC architecture.
4 THE ENWIC SYSTEM
ARCHITECTURE
As shown in Figure 1, the ENWiC system consists
of three major components: the viewer, the crawler,
and the administrator. The crawler, given a home
page, visits all Wiki pages and produces a topic map
based on the data it discovers in the pages. Using the
topic maps produced by the crawler, the viewer
provides a graphical interface to the original wiki
content. The administrator enables authoritative
content providers to add and edit topics and
associations to the crawler-produced topic maps.
The administrator component is designed for
instructors to use if they wish to provide students
with extra semantics to the topic maps produced by
the crawler, while the viewer application is designed
for students to study the available Wiki domains and
navigate through the topics.
4.1 The Crawler
Given the URL of a web-site homepage, the ENWiC
crawler traverses all the Wiki pages by extracting
the hyperlinks included in each page. Each traversed
page is stored in the ENWiC database as a topic
under a domain specified by the user to correspond
to the web site. Links between pages are marked
with an 'instance of' relationship; thus, the path that
the crawler has traversed to discover a page starting
from the initial URL can be found by examining the
linear sequence of the 'instance of' relationships.
Since there are multiple alternate paths to a page that
the crawler may discover as it examines more pages,
the crawler marks these alternate links as
associations. They are displayed in different colours
in the Viewer so the users can identify them as
alternate paths.
Each page usually contains several segments,
separated from each other with bold-face headings.
The crawler attempts to classify them so that they
can be visually presented in a more organized
manner. This is accomplished by extracting the text
encapsulated in HTML header tags on a page. Each
extracted header is made into a topic, and links that
fall under that header become associated with that
header's topic in the topic map. In the application,
the header topics have the text 'SECTION' in their
names to indicate that they only account for a
section of a page, and not the full page. In the graph,
their nodes are coloured differently from the regular
page nodes.
For each page discovered, the crawler uses the
title of the page, the text of the link leading to the
page, and the header text to create the topic's name
and index terms. The crawler also ranks each page
according to the number of links going to the page
(link-in rank), and number of links going out of the
page (link-out rank). The rank information is also
visualized by the Viewer in order to help students
identify which pages may be more useful; if a page
is linked by many other pages then that page may
contain some very useful information, and if a page
has many links going out then that page may be a
good index of relating pages.
4.2 The Viewer
The Viewer consists of two main components:
1. A visualization panel that displays a graph to
represent the Wiki domain.
ICEIS 2006 - HUMAN-COMPUTER INTERACTION
38
2. An information panel that provides: a master list
of topics in the domain; information on the
selected topic in the graph; a browser that
displays the selected topic's Wiki page; a search
function; and a history of recently visited topics.
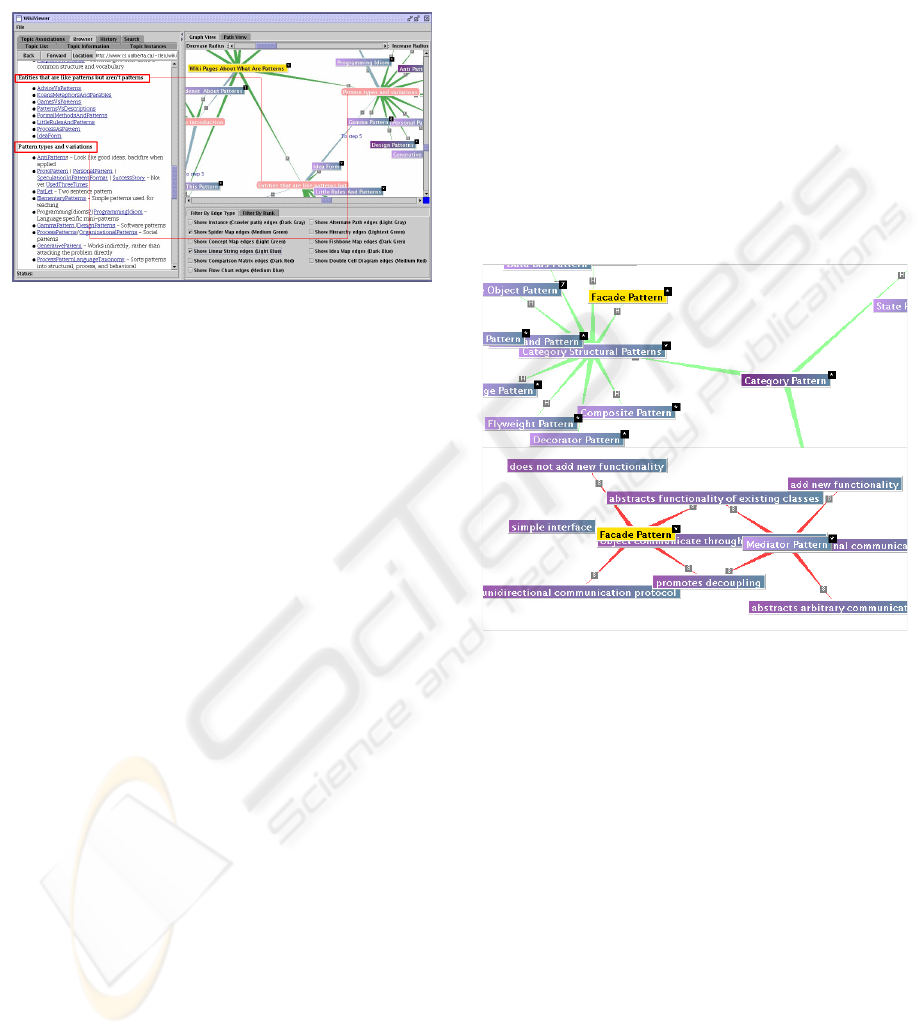
Figure 2: The ENWiC Viewer. Blue/purple nodes
represent page nodes while pink nodes represent sections
of a page. The yellow node is the currently selected node.
The Viewer takes the topic information from the
database to create a XML topic map. The topic map
is visualized using the Touchgraph (TouchGraph)
toolkit. Topic nodes that represent pages are drawn
as a rectangle while nodes that represent sections are
drawn as a round rectangle. Page nodes are coloured
based on rank; a gradient paint of purple and blue is
used to represent the link-in rank and the link-out
rank respectively. A deeper colour indicates a higher
rank. Figure 2 shows the Pattern Roadmap page of
the Portland Pattern Repository's Wiki
(http://c2.com/cgi/wiki?WikiPagesAboutWhatArePa
tterns) as seen with the ENWiC viewer.
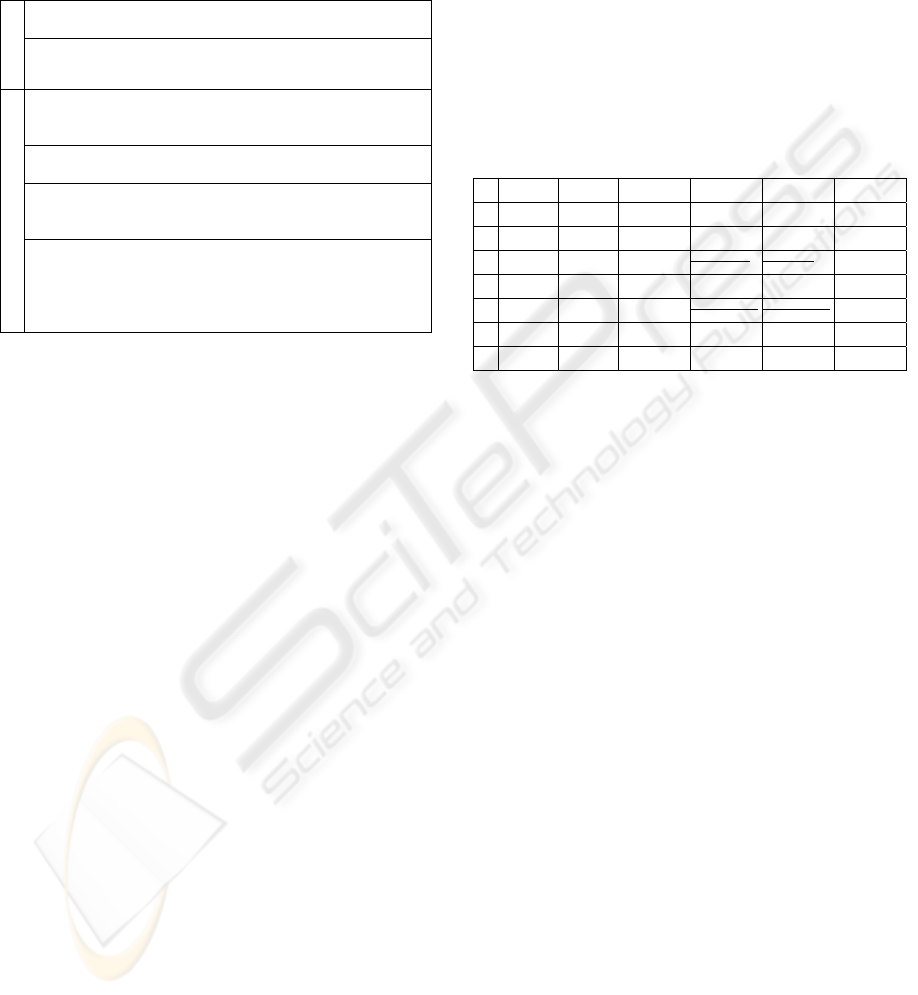
Edges are coloured and annotated based on the
type of association. The user can select which type
of edges to show to single out diagrams of interest,
as shown in Figure 3.
The Viewer is equipped with a search function
so that users can directly look for topics of interest
and jump to the corresponding node in the graph
immediately. This is useful when the domain has a
large number of topics and users may not be able to
locate specific topics in the graph readily. The
search function will allow them to isolate the desired
topic node immediately and view the relationships it
shares with other topic nodes. The Viewer also
keeps a history of visited topic nodes so that users
can backtrack easily. The history is also visualized
in the History View as a graph that will show any
diverging paths that the user has taken.
4.3 The Administrator
The purpose of the Administrator application is to
allow users to enter domain-dependent information
as addendum to the domain-independent information
discovered by the crawler. The user can modify any
topic or association using the application.
Bloom's diagrams can be built using the Graphic
Organizer Wizards provided by the application. The
wizards allow users to easily add more semantics
and relations to the crawler-produced topics. Each
type of diagram created using the wizards will be
colour-coded in the Viewer so it would be easy for
users of the Viewer to identify the types.
The Administrator application can also act as a
simple graphic organizer builder. Users can start a
new domain and add topics and associations
manually or with the wizards. This is useful if the
user just wanted to use a few pages to create a
meaningful diagram, and did not need the entire
Wiki to be crawled.
Figure 3: Isolating the hierarchy diagram (top) and double
cell diagram (bottom) using filters help users see different
information about Facade pattern.
5 EVALUATION
5.1 Experimental Design
To evaluate ENWiC, we carried out an experiment
that tested its usability against a standard Wiki. We
set up two conditions: the control condition, where
the subject uses a standard Wiki to answer
questions; and the experimental condition, where the
subject uses ENWiC to answer questions. Half of the
subjects will switch from control condition to
experimental condition, and vice versa for the other
half. The subjects are computing science students,
and so we choose design patterns as the subject
domain for our tasks. We selected the Portland
Pattern Repository's Wiki (http://c2.com/cgi/wiki)
for this experiment since its content concentrates on
software development, and we used ENWiC to
ENWIC: VISUALIZING WIKI SEMANTICS AS TOPIC MAPS - An Automated Topic Discovery and Visualization Tool
39
crawl a mirror of the Wiki to create the topic map.
We also used the Administrator wizards to put in
hierarchy diagrams, double cell diagrams and
comparison matrices to add some domain-dependent
relations and keywords that the Crawler did not pick
up in the pages.
Table 1: The experiment tasks.
Give an example of how credit card service can use the
Strategy pattern.
e
a
s
y
Consider a chat room application. What is the subject and
what are the observers?
What is the class of design pattern that Decorator belongs
to? What is the class of design pattern that Memento
belongs to?
List two patterns that promote decoupling by using a central
object for communication.
Consider a pager service. Why is the façade pattern
inadequate for this scenario? Which pattern would be more
suitable?
d
i
f
f
i
c
u
l
t
You would like to make a deposit to your personal accounts
at the bank. The bank has a group of tellers; you are called
to the teller that can handle deposit to personal accounts,
who will process your request. What pattern does this
resemble?
After giving them a short tutorial on Wiki and
ENWiC, the subjects answered a total of six
questions: three using ENWiC and three using the
Wiki. Each set of three contained one easy question
that involves only one design pattern and two
questions that required subjects to combine
information from different patterns. The subjects
have a maximum of 15 minutes to answer each
question.
During the experiment, we observed the subjects
and we recorded the time to completion, the number
of unique nodes/pages visited, the number of mouse
clicks on ENWiC nodes and the number of link
traversals and back-button clicks on Wiki. After they
completed their tasks, we asked our subjects to fill
out a questionnaire about the usability of the two
applications, and their overall impression and
experience with the two applications.
Finally, we evaluated the correctness and the
completeness of their answers.
5.2 Results and Observations
We found that time-to-completion was not an
adequate measurement since it depended more on
the subject than the condition. Generally, completion
times were shorter with ENWiC, but some subjects
took more time than others regardless of the
conditions. Also, subjects took less time to answer
later questions since they remembered information
from the first few questions and had a better idea of
where to look. On average, completion time for a
task in ENWiC is 3:17 minutes, while in Wiki it is
3:31 minutes. Since ENWiC’s loading time per page
is quite longer than Wiki, the completion times for
ENWiC could potentially be even better.
For a better measure, we examined the number
of unique pages/nodes visited and the number of
clicks. As shown in Table 2, we noticed our subjects
used significantly less number of clicks to complete
the hard questions when using ENWiC. This was not
significant with the easy questions where the
answers were on a single page, but on the hard
questions, subjects were able to move to desired
pages just by using the graph, as opposed to having
to click on the Back button many times while using
a traditional browser.
Table 2: The number of clicks and unique pages/nodes
visited for each subject (A-F) for each question (1-6).
1 2 3 4 5 6
A
5,E:3,2 2,W:5,5 1,W:8,6 4,E:1,1 6,E:7,3 3,W:43,26
C
2,W:4,2 5,E:3,3 4,E:5,3 1,W:40,14 3,W:33,17 6,E:3,2
E
2,W:2,2 5,E:3,3 4,E:4,4 1,W:24,7 3,W:9,4 6,E:2,2
B
5,W:4,3 2,E:1,1 1,E:8,7 4,W:19,16 6,W:29,18 3,E:6,6
D
2,E:3,3 5,W:2,2 4,W:10,6 1,E:3,3 3,E:3,3 6,W:9,7
F
2,E:4,3 5,W:2,2
4,W:2,2
1,E:13,8 3,E:4,4 6,W:2,2
Each cell (formatted as O,W/E:C,P) reports the order
in which the question was asked (O), the tool in
which it was answered (E for ENWiC and W for
Wiki), the number of clicks involved (C) and the
number of unique nodes/pages (P) visited. The first
three subjects in the table used Wiki first and then
switched to ENWiC, while the other three subjects
used ENWiC first before using Wiki. The crossed-
out values indicated that the subject was timed-out
before he could finish the task.
The numbers for the easy questions (1 & 2) were
similar for both tools, but for the harder questions, it
can be seen that the number of pages/nodes the
subjects used in Wiki is more than ENWiC except in
one case (outlined in bold), where that particular
subject knew which pages to look. In terms of the
number of clicks, the margin between ENWiC and
Wiki is even higher, indicating that the subjects went
through significantly less irrelevant information and
pages when using ENWiC.
According to our observations, reading times
were also reduced in some cases, especially when
the subjects had to seek out certain relationships, as
it was faster to look at the links on the graph than to
read the text to find the information. Also, subjects
using Wiki may overlook links to potentially better
pages; for example, when answering question (1)
from Table 1, the Wiki page that described Strategy
pattern contains a link to another page that has an
example of Strategy pattern. On ENWiC, that link
has a section node “Example” associated with it, and
thus ENWiC users easily recognized that link as a
ICEIS 2006 - HUMAN-COMPUTER INTERACTION
40
useful; it took Wiki users longer to realize that, and
in some case they did not visit the link at all.
ENWiC was able to give the area of where
solutions may be located. For example, when
subjects answered questions (4) or (5) from Table 1,
when they search and locate the Façade pattern, they
identified the Mediator pattern as the most likely
solution for the second part of the question since it
appeared in the graph near the Façade pattern node,
while it was not as obvious for the Wiki users. When
a subject misses such relationship, they have to go
through more patterns to finally identify the
Mediator pattern. Thus, ENWiC helps reduce the
number of unique pages that a user has to read since
it can limit the area of pages that user has to look
through.
We carried out a statistical hypothesis testing
based on our data. For each question, we examined
whether the number of clicks and the number of
pages visited for each task was smaller when using
ENWiC than when using the standard Wiki
interface. Thus, we state our hypotheses as:
H
0
: μ
Wiki
= μ
ENWiC
(Null Hypothesis) [Eq.1]
H
1
: μ
Wiki
> μ
ENWiC
(Alternate Hypothesis) [Eq.2]
Selected significance level: t
0.05,4
= 2.132 [Eq.3]
We used T-statistics for our hypothesis testing. The
results are summarized in Table 3.
Table 3 shows that there was a significant
decrease in the number of clicks and number of
visited pages when using ENWiC for questions 4
and 5. These were difficult questions, in that to
answer them the subjects had to combine
information from more than one wiki pages.
Question 3, although it was also difficult, did not
have a significant difference because some subjects
were able to utilize the Wiki Category page to
answer the question. Question 6, again difficult, did
not have a significant difference because some
subjects remembered some information while
looking for solutions to previous questions. They
were able to identify which pattern is the most likely
candidate for the solution, thus reducing the number
of pages and clicks they used while working on this
question.
Table 3: Results for our hypothesis testing for each
individual question. The values marked with * are
significant enough to reject the null hypothesis (Eq.1).
Question T
o
(# of clicks) T
o
(# of pages)
1
0 -0.707
2
0.555 0.5547
3
0.372 0
4
2.997* 2.428*
5
2.526* 2.138*
6
1.127 1.121
We also carried out a similar hypothesis testing
for the number of clicks and pages needed to
complete all tasks. We believe that the number of
pages and the number of clicks needed to complete
all tasks in Wiki is more than in ENWiC. We state
our hypotheses as:
H
0
: μ
Wiki
= μ
ENWiC
(Null Hypothesis) [Eq.4]
H
1
: μ
Wiki
> μ
ENWiC
(Alternate Hypothesis) [Eq.5]
Selected significance level: t
0.05,34
= 2.032 [Eq.6]
The results for the above hypothesis testing are
summarized in Table 4.
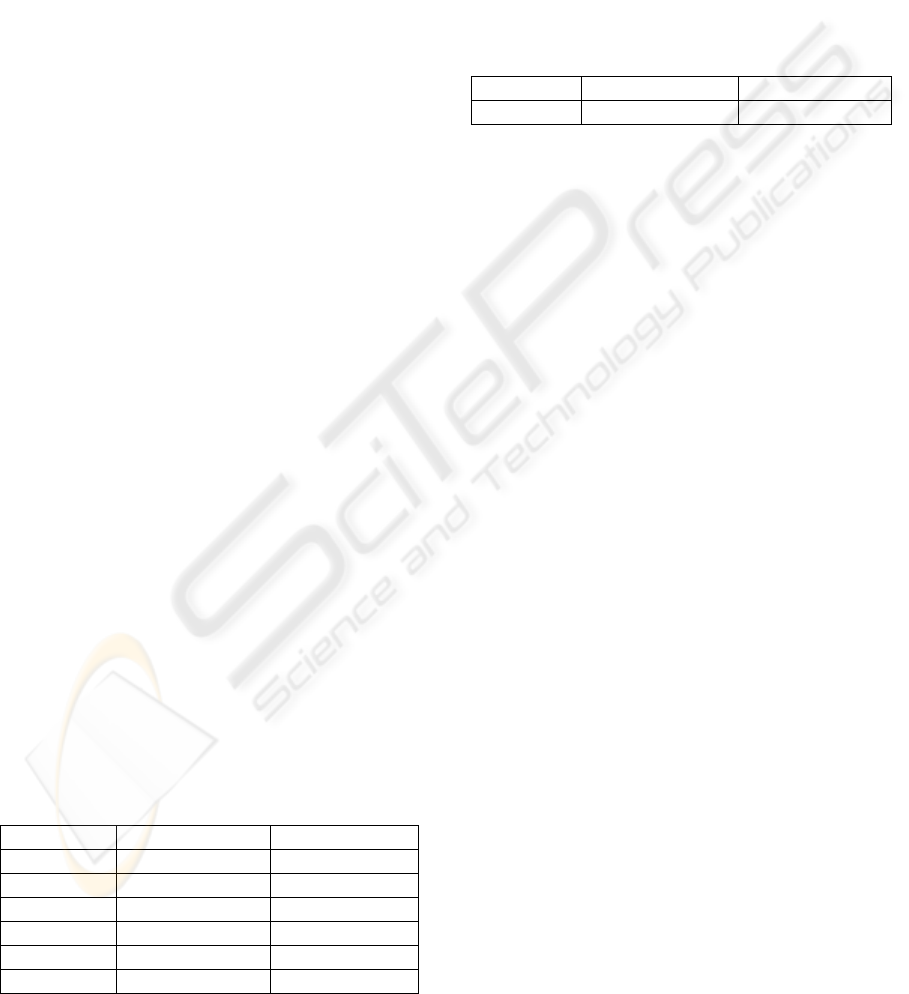
Table 4: Results for our hypothesis testing for all tasks.
The values marked with * are significant enough to reject
the null hypothesis (Eq.4).
Question T
o
(# of clicks) T
o
(# of pages)
1-6
2.611* 1.790
The results in Table 4 validate our observations
that subjects generally use less number of clicks
when using ENWiC instead of Wiki. The shorter
completion times and the lower number of clicks in
ENWiC agree with the cognitive theory, which
suggested that textual presentations cause more
memory stress than visual presentations. Since it
was easier for subjects to remember their location
with ENWiC, they could complete tasks with shorter
times and paths.
Correctness and completeness of the tasks were
not significantly different between the two tools,
which were expected because ENWiC gets its data
from the Wiki, so once subjects locate the proper
information, they usually arrive at the same
conclusion. ENWiC just helps subjects to identify
the proper data faster.
Since ENWiC does differ from conventional
browsers, we found that subjects needed some time
to learn and adjust to the interface. Some subjects
learned quickly and were able to utilize the tool very
well, while some had difficulties adjusting and
learning how to read the graph and utilize the
diagram filters. We found that subjects who like to
use index and category pages from the Wiki were
better at interpreting the graph of ENWiC, while
subjects who use the search function or prefer to
read text may not adjust as well to the graph. Since
the search functions in the Wiki and in ENWiC were
not as sophisticated as search engines like
http://www.google.com, the answers cannot be
directly obtained using the Wiki or ENWiC search.
Some subjects did appreciate that the ENWiC search
function can narrow down the area of where the
solution may be, but the few subjects who did not
utilize the graph did not find ENWiC a lot more
useful than Wiki.
Based on the questionnaires, almost all subjects
found ENWiC to be an interesting tool to use. The
main advantages they outlined were: relationships
ENWIC: VISUALIZING WIKI SEMANTICS AS TOPIC MAPS - An Automated Topic Discovery and Visualization Tool
41

between topics can be seen clearly, which allows for
easier navigation; they did not feel as lost when
searching for answers; and they can select and
traverse the relevant path faster.
The one disadvantage of ENWiC that all subjects
agreed upon is its speed. Since the ENWiC viewer
has to render a graph while loading a page, the
display of it takes more time as compared to the
standard Wiki interface. Subjects who are used to
moving and reading pages quickly found the speed
of ENWiC an annoyance that deteriorates
satisfaction.
Multiple intelligence (Gardner 1983) suggested
that there are eight different types of intelligence,
which implies that there may be eight different
styles of learning depending on the individual. Two
of the eight types of intelligence are: linguistic
(words) and spatial (visual). From our experiment, it
is evident that ENWiC is useful for subjects who
could interpret graphs and visuals better, as ENWiC
is targeted for spatial learning, while subjects who
learn with words (linguistic intelligence) may or
may not find ENWiC better than a standard Wiki.
Subjects who could adapt to both types of learning
style liked ENWiC because it was it was different
than conventional text navigation, which made it
more interesting and enjoyable to use.
6 CONCLUSIONS
E-Learning is fast becoming the mode of choice for
delivering courseware in educational institutions.
Wikis are on-line knowledge bases, built
collaboratively by communities of people studying
or having an interest in a particular domain. As such
they are frequently used in support of teaching and
learning.
ENWiC offers an alternative user interface to the
standard text interface of Wikis. Its graphical
representation of a Wiki helps users to see an
overview ‘map’ of the Wiki, which enables efficient
navigation. It is highly beneficial for users who are
visual learners and like to see the relationships
between topics, and its stimulating interface can
capture users’ interest to encourage them to learn.
Since the creation process is mainly automated by a
crawler, it is also easy for authoritative experts to
use ENWiC as an instructional tool.
Our usability study indicates that ENWiC
supports shorter times for accomplishing tasks based
on wiki information. Through its visualization of the
domain, ENWiC makes visible the wiki navigation
structure, which is beneficial to self-learning. Its
usage is not be limited to Wikis only, as its design
can be easily applied large scale websites, such as
blogs or online journals, which will help expand
content that can be effectively used for e-Learning.
REFERENCES
Amin, A.B.M (2005). Using Graphic Organisers to
promote active e-learning [Electronic version].
Proceedings of World Conference on Educational
Multimedia, Hypermedia and Telecommunications
2005, 4010-4015. Norfolk, VA: AACE.
Aumueller, D. (2005). SHAWN: Structure Helps a Wiki
Navigate [Electronic version]. Proceedings of the
BTW-Workshop “WebDB Meets IR”.
Bloom, B.S. (1956). Taxonomy of Educational Objectives,
Handbook I: The Cognitive Domain, Addison Wesley.
Campanini, S.E., Castagna P. & Tazzoli R. (2004).
Platypus Wiki: a Semantic Wiki Wiki Web [Electronic
version]. SWAP, Proc. Semantic Web Applications and
Perspectives– 1
st
Italian Semantic Web Workshop.
Canas, A.J., Carff, R., Hill, G., Carvalho, M., Arguedas,
M., Eskridge, T.C, Lott, J. & Carvajal, R. (2005).
Concept Maps: Integrating Knowledge and
Information Visualization [Electronic version]. In
Knowledge and Information Visualization 2005, 205-
219.
Dicheva D., Dichev, C. & Wang, D. (2005). Visualizing
Topic Maps for e-Learning [Electronic version].
ICALT’05, Fifth IEEE International Conference on
Advanced Learning Technologies, 950-951.
Donelan, C.I. From Spider Maps to Double-Cell
Diagrams: Graphic Organizers Support Student
Learning. ENC Online. Retrieved May 2005, from
http://www.enc.org/features/focus/archive/graphic/doc
ument.shtm?input=FOC-003559-index
Gardner, H. (1983). Frames of Mind: The Theory of
Multiple Intelligence, Basic.
Lamb, A. (2001, May). Learning Resources: Graphic
Organizers. The Teacher Tap. Retrieved August 2005,
from http://eduscapes.com/tap/topic73.htm
Lee, Y.J. (2005). Facilitating Web Search with
Visualization and Data Mining Techniques [Electronic
version]. Knowledge and Information Visualization
2005, 326-342.
Robinson, D.H. & C. H. Skinner (1996). Why Graphic
Organizers Facilitate Search Processes: Fewer Words
or Computationally Efficient Indexing? [Electronic
version]. Contemporary Educational Psychology, 21,
166-180.
Smith M.A. & Fiore A.T. (2001). Visualization
components for persistent conversations [Electronic
version]. Proc. of CHI 2001.
Stroulia E. & Jari K. (2003). EduNuggets: an intelligent
environment for managing and delivering multimedia
education content. International Conference on
Intelligent User Interfaces 2003.
Topic Maps: http://www.topicmaps.org/xtm/1.0
TouchGraph LLC: http://www.touchgraph.com
Wikipedia: http://www.wikipedia.com
ICEIS 2006 - HUMAN-COMPUTER INTERACTION
42
