
ENTERPRISE RESOURCE PLANNING (ERP) SYSTEMS
SUCCESS MEASUREMENT: AN EXTENDED MODEL
Princely Ifinedo
Department of Computer Science and Information Systems, Univesity of Jyväskylä, Agora Building, Jyväskylä, Finland
Keywords: ERP systems success, IS success, Measurement, Assessment, Structural equation modeling, Private firms.
Abstract: Enterprise Resource Planning (ERP) systems are diffusing globally, and it is important to measure the
success of such software in adopting firms. Evidence suggests that firms investing huge sums of money in
information systems (IS) sometimes do not assess the success of such systems for a variety of reasons,
including the lack of knowledge about what to assess. Also, the IS success evaluations research area is
varied, often providing little succour to practitioners. ERP systems success assessment is just beginning to
surface, and this paper discusses an effort towards extending an available success measurement model.
Essentially, two relevant success dimensions not included in the model proposed by Gable and colleagues
(Gable et al., 2003; Sedera and Gable, 2004) were incorporated and tested using criterion analysis and
structural equation modeling technique. The implications of our findings for practice and research are
discussed.
1 INTRODUCTION
An ERP is a complex business information
technology (IT) package designed to integrate
business processes and functions by permitting the
sharing of common data and practices in a real-time
environment (Davenport, 1998; 2000; Somers et al.,
2000). Organizations adopt them for a variety of
reasons, including the replacement of legacy systems
and cost reductions (Davenport, 1998; 2000).
Assessing the success of ERP in organizations is
difficult because of its complex nature (Sedera et al.,
2002, 2003a; Gable et al., 2003).
Furthermore, some firms appear to have given up
hope of evaluating the benefits or success of their
ERP due to a lack of knowledge regarding such
exercises (Ifinedo, 2005). In-depth interviews with 7
case companies regarding how they evaluate the
success of their ERP revealed that only 3 had any
formal evaluations, the others indicated that they
don’t carry out such evaluations; yet almost all these
firms have adopted costly top brands ERP systems.
Our observations are similar to those made by
Kumar (1990) and Seddon et al. (2002) where these
researches discussed the poor state of IS systems
evaluations in organizations. Seddon et al. (2002, p.
11) concluded, “…firms do not conduct rigorous
evaluations of all their IT investments” perhaps due
to a lack of knowledge in such areas. Participants in
our study (Ifinedo, 2005) echoed a similar view.
IT systems success evaluation issues are critical
for both practitioners and researchers (Ballantine et
al., 1997; Seddon et al., 2002; McLean et al., 2002),
and over the past three decades, evaluating the value
and success of IT systems for organizations has been
a recurring issue (DeLone and McLean, 1992;
Myers et al., 1997). Various assessment approaches
have surfaced. One stream of research focuses on the
use of attitudinal and subjective measures (Ives et
al., 1983; Doll and Torkzadeh, 1988), while another
utilizes financial and objective parameters (e.g.
Brynjolfsson and Hitt, 1996). In both instances,
understanding the success of the IT systems could be
limited when the dimensions and measures of
success are restrictive (Grover et al., 1996; Myers et
al., 1997; Gable et al., 2003). Grover et al. (1996)
argued for measures that are more comprehensive to
be used for information systems (IS) success studies.
Perhaps it was the plethora of IS success assessment
approaches that led Keen (1980) to seek clarification
of the “dependent variable.” In response, DeLone
and McLean [D&M] (1992) developed an
integrated, multi-dimensional, and inter-related IS
success model that is now the dominant model for IS
evaluation research (Ballantine et al., 1997; Seddon,
1997). Please see Figure 1 for the D&M model.
Further, in developing their ERP success
71
Ifinedo P. (2006).
ENTERPRISE RESOURCE PLANNING (ERP) SYSTEMS SUCCESS MEASUREMENT: AN EXTENDED MODEL.
In Proceedings of the Eighth International Conference on Enterprise Information Systems - DISI, pages 71-78
DOI: 10.5220/0002496400710078
Copyright
c
SciTePress

measurement model, Gable and colleagues (Gable et
al., 2003; Sedera et al., 2003a) suggested that
perhaps one of the reasons why there are mixed
results reported with regard to IS success research is
the utilization of limited or narrowly defined
success dimensions. It comes as no surprise,
therefore, that practitioners espouse a lack of
knowledge regarding assessing the success of their
acquired IT systems when the research community
appears to lack a consensual approach on “what to
assess?”
Thus, the lack of knowledge for some
practitioners about what to measure or assess in the
context of ERP systems (Ifinedo, 2005), is the
primary motivation for this study. As previously
mentioned, Gable and colleagues have stepped up to
this challenge, and this study only serves to
complement their effort. In advancing the
knowledge in this area, we specifically ask: Are the
dimensions of success represented in the ERP
success measurement model proposed by Gable and
colleagues comprehensive? If otherwise, can the
model be extended? The purpose of this study is to
present an extended model that could be used by
practitioners. Our focus is on private organizations
in contrast to the public sector organizations that
Gable and colleagues studied. Mansour and Watson
(1980) note that IT issues for a government
environment differs from those in the private sector
because of the profit oriented nature of the latter.
This research is conducted in Finland and Estonia
- two small neighboring technologically advanced
Northern European countries with a comparable
cultural values (Ifinedo and Davidrajuh, 2005).
Finnish companies began adopting ERP in the late
1990s (van Everdingen et al., 2000; Ifinedo, 2005),
and the software is a “key IS management issue” in
Estonia (Ifinedo, 2005; 2006).
2 BACKGROUND
Here, ERP systems success refers to the utilization
of such systems to enhance organizational efficiency
and effectiveness (DeLone and McLean, 1992;
Grover et al., 1996; Gable et al., 2003), and it is
different from ERP implementation success (Martin,
1998; Tan and Pan, 2002; Markus et al., 2000). Our
scan of the literature of ERP success research
revealed that researchers either use narrowly defined
measures (Nelson and Somers, 2001; Zviran et al.,
2005; Wu and Wang, 2005) or elaborate on broad
conceptualization of the concept (e.g., Tan and Pan,
2002; Markus and Tanis, 2000). Some of the
researchers used the end-user satisfaction instrument
(Doll and Torkzadeh, 1988) that has been criticized
for its limited scope (Saarinen, 1996). Markus and
Tanis (2000) discussed ERP success by including
performance metrics and outcomes, and noted that
their “theoretical framework … is too broad in scope
for direct empirical testing (Ibid, p. 200).
Gable and colleagues (Gable et al., 2003; Sedera
et al., 2003a; Sedera and Gable, 2004) provide
perhaps the most comprehensive ERP systems
success measurement model, to date, and others
have used it (e.g., Sehgal and Stewart, 2004). Gable
and colleagues developed an additive model that
redefines the dimensions in the original D&M IS
success model. They noted that Seddon and Kiew
(1994) tested paths in D&M model finding support
for some and not for the others. And, recently
Iivari’s (2005) study corroborates findings made by
Seddon and Kiew. In brief, Gabel and colleagues
eliminated (through multi-stage data collection and
statistical analysis) the Use and User satisfaction
dimensions. Arguments against dropping them are
also available in the literature (Saarinen, 1996;
Seddon, 1997). Furthermore, in their arguments for
the mutual exclusivity of success dimensions, Gable
et al. (2003) suggested an overarching view of
success in which “each measure [and/or dimension]
only addresses one important aspect of IS success”
(p. 578). In brief, the retained dimensions of ERP
system success in Gable and colleague model are as
follows: System Quality (SQ), Information Quality
(IQ), Individual Impact (II) and Organizational
Impact (OI). Please see Figure 2.
We asked whether this model (Figure 2) can be
extended to include other relevant factors? To that
end, we consulted the literature and conducted case
interviews in 7 ERP adopting private firms in
Finland and Estonia. In-depth discussions of this
study are available elsewhere (Ifinedo, 2005).
Evidence obtained from 16 senior personnel in these
firms revealed that the cooperative role and quality
of service of the ERP providers (vendors and
consultants) is linked to the overall success of their
ERP. One interviewee captured the views of others
when he commented: “As for me, I consider the
support from the vendor, their expertise and
commitment levels to be critical to our ERP success”
(Head of IT, Estonian manufacturing firm).
In this light, we believed that a more comprehensive
ERP success model should incorporate the
Vendor/Consultant quality dimension. The quality of
ERP providers throughout the life span of any ERP
acquisition is imperative, and is recognized in the
literature (Davenport, 1998; Markus and Tanis,
2000; Somers et al., 2000; Ko et al., 2005). Markus
and Tanis (2000) highlighted “dependence on
vendors” as a key issue in ERP implementations that
differentiates these systems from other IT
implementations. Recently, Ko et al. (2005)
ICEIS 2006 - DATABASES AND INFORMATION SYSTEMS INTEGRATION
72

underscored the crucial role that vendors/consultants
play during ERP implementations. Vendors and
consultants are grouped together because they
represent an external source of expertise to the firm
in ERP implementations.
Moreover, Sedera et al. (2003b) found that
“consultant and vendor items loaded together
yielding a new factor named External knowledge
player” (p. 1411).
Furthermore, we argue that the underlying
philosophy of ERP systems that facilitates the
harmonization and integration of organizational
functions and departments (Davenport, 1998; 2000;
Markus and Tanis, 2000) makes a case for the
incorporation of a dimension relating to the issue of
inter-departmental or cross-functional impacts.
Along this similar line of reasoning, Myers et al.
(1996) argued that any IS success model should
incorporate Workgroup Impact in light of the
contributions made by work teams/groups toward
organizational productivity, and these authors added
it to the D&M model. Workgroup encompasses the
sub-units and/or functional departments of an
organization. Furthermore, “interdepartmental co-
operation” and “interdepartmental communication”
ranked 3rd. and 6th. respectively in a study of 22
critical success factors (CSFs) of ERP
implementation by Akkermans and van Helden
(2002). Other CSFs studies have produced
comparable results (see Esteves and Pastor, 2001).
Thus, our conceptualization of ERP systems success
measurement model is shown in Figure 3 with two
new dimensions: Vendor/Consultant Quality (VQ)
and Workgroup Impact (WI).
Figure 3: Extended ERP Systems Success.
3 METHODOLOGY
This study is a part of three-stage research effort
using both qualitative and quantitative research
approaches. Here, we report the main survey.
Admittedly, it was impossible for us to determine
the number of firms adopting ERP in Finland and
Estonia due to the unavailability of such a sampling
frame. Rather, we sampled firms generated from
local contacts, ERP User Groups and vendors lists,
as well as published lists of Top Enterprises for 2004
for both countries. Firms were chosen by our ability
to obtain contact addresses for key organizational
personnel. We identified 350 firms in Finland and
120 firms in Estonia. In order to ensure data validity
and reliability, four knowledgeable individuals
completed the questionnaire prior to our mailing it,
and their comments helped us improve the quality.
Respondents in our survey indicated agreement with
statements using a 7-point Likert-type scale, where 1
= strongly disagree and 7 = strongly agree (the
questionnaire is omitted due to space restrictions).
Since the unit of analysis of this study was at the
functional and organizational levels only key
organizational informants including chief finance
officers, unit managers, and IT managers received a
packet consisting of a cover letter, questionnaire,
and a self-addressed, stamped envelope. 40% of the
mailings were matched pairs (two questionnaires in
the packet), and the recipients were encouraged to
give one of the questionnaires to an appropriate
person within their organization. It was felt that
multiple respondents from one organization would
enhance the validity of the study, as common source
variance would be reduced. The other 60% included
only one questionnaire. We encouraged the subjects
to present views representative of their organization.
S
Q
I
Q
II
OI
ERP
Systems
Success
Figure 2: Gable et al. (2003) ERP Systesm Success Model.
SQ
IQ
Use
User
Satisfaction
OI
Figure 1: DeLone & McLean (1992) IS Success Model.
II
S
Q
I
Q
V
Q
II
OI
WI
ERP
Systems
Success
ENTERPRISE RESOURCE PLANNING (ERP) SYSTEMS SUCCESS MEASUREMENT: AN EXTENDED MODEL
73

3.1 Results
Our overall response rate is 9.5% (44 firms)
combined for the two countries, namely, 29 and 15
firms for Finland and Estonia, respectively. In total,
we received 62 individual responses: 39 from
Finland and 23 from Estonia. Of which, there were
26 (42%) top-level management and 36 (58%) mid-
level managers. These groups of respondents are
among the most knowledgeable informants
regarding ERP success (Shang and Seddon, 2002;
Gable et al., 2003, Sedera et al., 2004). There were
35 (56.5%) men and 27 (43.5%) women in our
sample. On average, they had 9 years of work
experience in their respective organizations. Of the
respondents, 40% had college degrees, and 43
(69.3%) were aged between 31 and 50 years. Of the
62 respondents, 33.9% of them had SAP in their
organizations, 14.5% had Movex, 9.6% had Scala,
8.1% had Hansa, and the remaining 33.9% had other
mid-market ERP (including Concorde, Scala, etc.).
The majority of firms implemented their ERP
between 1998 and 2002. We received responses
from a wide range of industries, including
manufacturing, financial services, retail businesses.
Our sample included 15 small firms, 25 medium-
sized firms, and 22 large companies using the
workforce categorization guidelines provided by the
European Commission (2003) and 32. Laukkanen
et al. (2005).
3.2 Instrument Development and
Validity
The research instrument was developed from
measures and constructs that have been validated in
the literature (Gable et al., 2003; Sedera et al.,
2003a; Sedera and Gable, 2004). Although for one
construct – Workgroup Impact – we used guidelines
provided by Myers et al. (1996, 1997), and
information garnered from our case interview
(Ifinedo, 2005). We used 45 measures for the 6
dimensions and 3 measures to assess the ERP
systems success construct. SQ comprised 10
measures such as “Our ERP has accurate data”, and
IQ comprised 9 measures, including “The
information on our ERP is understandable” (Gable et
al., 2003; DeLone and McLean, 1992). VQ consists
of 5 measures, including “Our ERP
vendor/consultant is credible and trustworthy”
(Thong et al., 1994; Ko et al., 2005). II consists of 6
measures, including “Our ERP improves individual
productivity” (Gable et al., 2003, DeLone and
McLean, 1992; Myers et al., 1997). WI comprised 7
measures, including “Our ERP helps to improve
workers’ participation in the organization” (Myers et
al., 1996; 1997; Ifinedo, 2005). “Our ERP reduces
organizational costs” is among the 8 measures
included in the OI dimension. The ERP systems
success construct has 3 measures from Gable et al.
(2003) (see below: Criterion analysis). The content
validity of the study is enhanced over stages in the
study, including the pilot test. Regarding the
reliability of our measures, the Cronbach Alpha for
each dimension ranged from 0.769 to 0.942, which
is above the 0.70 limit recommended by Nunnally
(1978), thus indicating a reasonably high reliability
of the research measures.
4 DATA ANALYSIS
4.1 Additivity of the ERP Systems
Success Dimensions
Following guidelines in Gable et al. (2003), we
assessed the additive nature of our model by
investigating the criterion validity of the measures in
our instrument. We assessed our ERP systems
success using the following three statements: (A)
“Overall, the impact of our ERP on me has been
positive,” (B) “Overall, the impact of our ERP on
my workgroup has been positive,” and (C) “Overall,
the impact of our ERP on my organization has been
positive.” To assess the content and the criterion
validity of ERP success, we computed the following
composite measures: (D) “criterion average” is the
average of the three criterion items, and (E)
“dimensions average” is the average of the six
success dimensions. Table 1 shows the correlation of
(A), (B), (C), and (D) with the six dimensions and
their average (E). Gable et al. (2003, p. 585) stated,
“The extent to which each dimension or the
dimension average correlates with the criterion
scores is evidence of their criterion validity” (see
also, Kerlinger, 1988).
The correlations are significant at the 0.01 level
(two-tailed), with the exception of the correlation
between “Organization Impact” and “Impact on
Individual,” which is 0.70. The three largest
correlations are for (A), (C), and (D) with (E), which
are respectively 0.70, 0.72, and 0.74. Consistent with
Gable et al. (2003), the largest correlation (0.74) is
between (D) criterion average and (E) dimension
average, which suggests that (D) and (E) are the
strongest measures of overall ERP success. Gable et
al. (2003, p. 585) noted, “that the dimension average
yields the largest correlation with all the criteria
further supports the view that the dimensions are
additive, and thus when combined yield a stronger
overall measure of success than possible from any
ICEIS 2006 - DATABASES AND INFORMATION SYSTEMS INTEGRATION
74

single dimension.” In this regard, our data supports
the work of Gable et al.
Table 1: Correlations: Criteria and Dimensions.
Dimensions A B C D
1 SQ .55 .54 .64 .61
2 IQ .59 .58 .63 .64
2 VQ .41 .42 .40 .43
4 II .51 .57 .60 .59
5 WI .60 .58 .57 .62
6 OI .70 .61 .67 .69
E Dimension
Average
.70 .68 .72 .74
A: Impact on Individual, B: Impact on Workgroup,
C: Impact on Organization, D: Criterion Average.
We also used PLS Graph 3.0 to assess our model.
The PLS (Partial Least Squares) procedure is a
second-generation multivariate technique used to
estimate structural models (Chin, 1998; 2000). This
approach is suitable for this study because of our
small-sized data, and the developing knowledge
regarding the additive nature of IS success
measurement. PLS is capable of testing complex
models consisting of multiple interactions measured
with multiple indicators. PLS recognizes two
components of a casual model: the measurement
model and the structural model (Chin, 1998; 2000).
The measurement model consists of relationships
among the conceptual factors of interest (the
observed items or variables) and the measures
underlying each construct. This model demonstrates
the construct validity of the research instrument, i.e.
how well the instrument measures what it purports
to measure. The two main dimensions are the
convergent validity (composite reliability) and the
discriminant validity. PLS Graph 3.0 computed the
composite reliability of each dimension or construct.
The composite reliability of each construct in the
model with the highest predictive power in this
study are as follows: SQ - 0.73; IQ - .62, VQ - 0.51,
II - 0.58, WI - 0.50, OI - 0.63, and ERP success -
0.77 (please see the discussions below). This is
adequate for this study (Hair et al., 1998). The
discriminant validity is assessed by checking the
extent to which items measure a construct. This is
assessed by checking the square root of the average
variance extracted (AVE) for each construct. In no
case was any correlation between the constructs
equal to or greater than the squared root of AVE
(Fornell and Larcker, 1981; Chin, 1998). This
suggests that our measures are distinct and
unidimensional (The result is omitted due to space
restrictions, but available upon request). Thus, we
can say that the convergent and discriminant validity
of our data are psychometrically sound and adequate
for an explanatory study such as this one (Fornell
and Larcker, 1981; Chin, 1998; Hair et al., 1998).
The structural model gives information as to how
well the theoretical model predicts the hypothesized
paths or relationships. PLS Graph 3.0 provides the
squared multiple correlations (R
2
) for each
endogenous construct in the model and the path
coefficients. The R
2
indicates the percentage of a
construct’s variance in the model, while the path
coefficients indicate the strengths of relationships
between constructs (Chin, 1998; 2000). PLS does
not generate a single goodness of fit metric for the
entire model, unlike other structural modeling
software, but the path coefficients and the R
2
are
sufficient for analysis (Chin, 1998; 1999).
4.2 Alternative Models
The examination of alternative models in structural
modeling could facilitate insights (Doll and
Torkzadeh, 1988; Hair et al., 1998; Sedera and
Gable, 2004). Thus, we developed alternative Model
1 to Model 6, and checked their path coefficients
and R
2
s. The details of these models are shown in
Table 2 (See also the Appendix for their
illustrations). The R
2
of Models 1, 2, 3, 4, 5, and 6
respectively are 0.335, 0.366, 0.050, 0.305, 0.362,
and 0.316. Clearly, Model 2 has the best R
2
suggesting its relative strength in predicting ERP
success in comparison to the other models. It has to
be noted that all the models but Model 3 explained
more than 30% of the variance in the ERP success
model, which is adequate for this study. Our
extended ERP success framework represented in
Model 2 suggests that ERP success is a second-
order factor. This is consistent with results in the
work of Gable and colleagues (Gable et al., 2003;
Sedera and Gable, 2004). Even though our ERP
success model has more dimensions than do Gable
et al. (2003), the conclusions seem to be comparable.
Further, Figure 4 shows the path coefficients in
Model 2. Chin (1998) recommends that path
coefficients should be at least 0.20, and ideally
above 0.30 to be considered meaningful. Apparently,
SQ and OI predict “success” more than do any other
dimensions with their relatively better path
coefficients. Again, this result corroborates the
results by (Sedera et al., 2002) in which these two
dimensions were noted as the most important in
assessing ERP success. These researchers sampled
the views of key organizational stakeholders in 23
Australian public sector organizations using the four
dimensions in the Gable et al. model.
ENTERPRISE RESOURCE PLANNING (ERP) SYSTEMS SUCCESS MEASUREMENT: AN EXTENDED MODEL
75
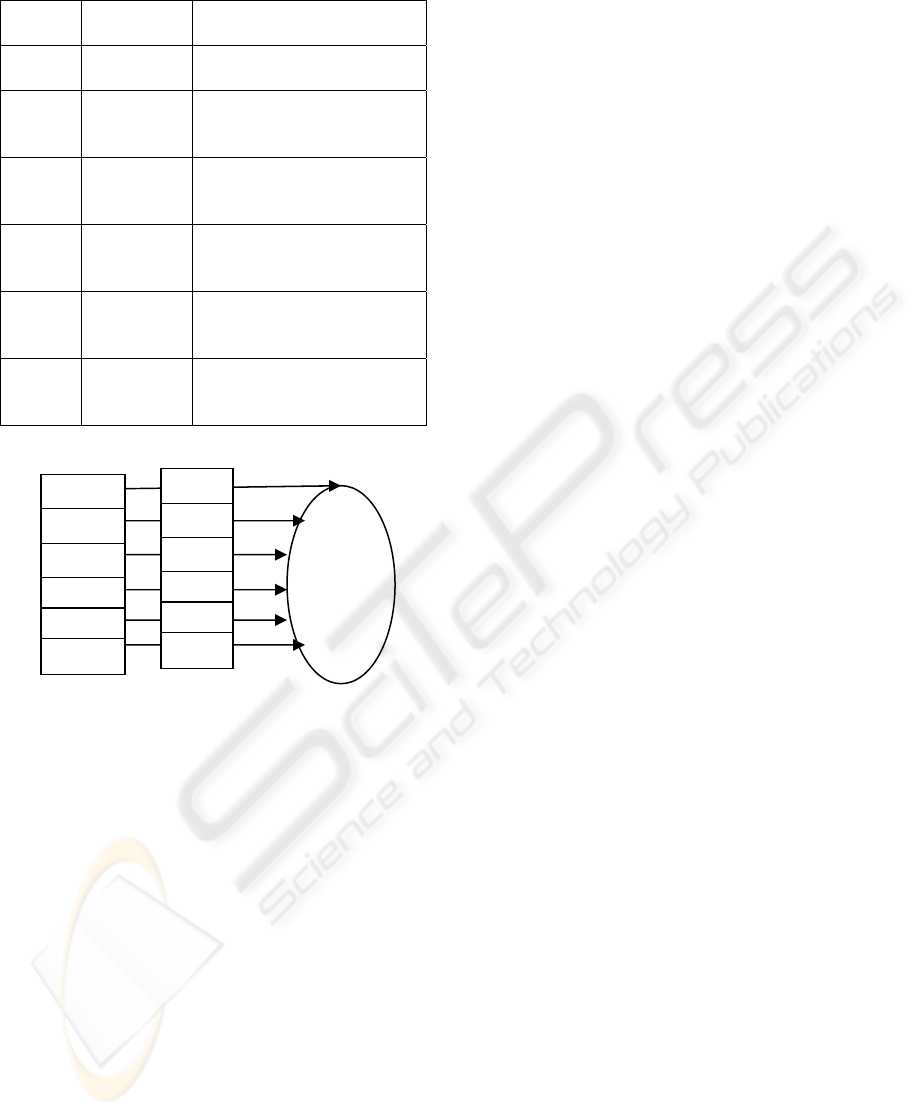
Table 2: Structural models and their Corresponding R
2
.
R
2
Structural
Model
Description
R
2
=
0.335
Model 1 One first-order factor, with
all the 45 items
R
2
=
0.366
Model 2 Six first-order factor (SQ,
IQ, VQ, II, WI, OI), One 2
nd
order factor
R
2
=
0.050
Model 3 Six first-order factor, Two
2
nd
order factors, One 3
rd
order factor
R
2
=
0.305
Model 4 Four first-order factor (SQ,
IQ, II, OI), One 2
nd
order
factor (Gable et al. (2003)
R
2 =
0.362
Model 5 Five first-order factor (SQ,
IQ, II, WI, OI), One 2
nd
order
factor (without VQ)
R
2 =
0.316
Model 6 Five first-order factor (SQ,
IQ, VQ, II, OI), One 2
nd
order factor (WI)
Figure 4: Results of PLS Graph 3.0 for Model 2.
5 DISCUSSIONS AND
CONCLUSION
This paper discusses ERP success measurement
model as proposed by Gable and colleagues (Gable
et al., 2003, Sedera et al., 2003a, Sedera and Gable,
2004). Specifically, we asked whether the Gable and
colleagues’ model is comprehensive. We found
through literature review and interviews with case
companies that their ERP systems success
measurement model might be limited in scope as
two important dimensions are not considered. To
that end, this paper presents perhaps the first attempt
at validating and extending their model, and in a
different setting (private sector) and geographical
location. Importantly, this paper draws from the
issues of additivity and mutually exclusivity of ERP
success measures discussed by Gable and colleagues
as we incorporated two relevant dimensions,
namely, Workgroup Impact and Vendor/Consultant
Quality, which we found to be relevant in the
discourse.
With regard to research, this endeavor could
entice further studies. Our operationalized set of
ERP dimensions (and measures) offers perhaps a
more comprehensive model in the literature. The
proposed ERP systems success measurement model
(Figure 3) has sound psychometric properties as
assessed through structural equation modeling
technique, and criterion validity. Particularly, this
effort might engender the development of an
appropriate scale to assess ERP system success for
adopting organizations. Further, we find support for
the claim that ERP systems success is a second-
order factor (Sedera and Gable, 2004), and our data
shows that a six-factor construct outperforms the one
with four as proposed by Gable and colleagues.
Additionally, our model offers other useful insights,
for example, System Quality and Organizational
Impact were found to be perhaps the two most
important dimensions to watch out for in evaluating
ERP systems success, this finding adds credence to a
previous study (Sedera et al., 2002) carried out in
public sector organizations. Admittedly, our findings
are not conclusive and further testing and
refinements is expected. Future research might need
to focus on utilizing confirmatory factor analysis as
knowledge is accumulated in this area of research.
Our study has implications for practice as well.
As noted, this study is motivated by the need to
present practitioners with guidelines for assessing
the success of their ERP software. It is not claimed
that our guideline is the final word regarding ERP
success measurement, evaluation or assessment for
ERP adopting firms; however, our comprehensive
list of success dimensions could be valuable
especially for firms with no formal means of
conducting such an exercise. It is worth noting that
anecdotal evidence exists indicating that our
research instrument is already in used for such
purposes in our research settings. Management can
use the dimensions of Systems Quality and
Organizational Impact of acquired systems in
assessing the effectiveness or success of such
technologies in instances where a more
comprehensive instrument or formal evaluation
techniques are not readily available. Our model
could be modified for other enterprise systems,
including Customer Relationship Management
(CRM), and Supply Chain Management (SCM).
To conclude, we highlight the limitations of this
study. It is exploratory, and our sample is not
random. Nor can we rule out personal bias, even
though the respondents claimed to present an
average view for their respective organizations on
selected issues. Our sample comprises mixed ERP
software, including top-brand names (e.g. SAP and
ERP
Systems
Success
S
Q
I
Q
V
Q
II
WI
OI
0.213
0.092
0.084
0.135
-0.242
0.296
R
2
= 0.366
ICEIS 2006 - DATABASES AND INFORMATION SYSTEMS INTEGRATION
76

Oracle) and mid-market products (e.g. Scala and
Nova). It is possible that the heterogeneous nature of
the ERP systems used for our study are limiting.
Finally, our sample consists of small, medium, and
large companies. The diversity in the sample is
good, but it may affect our findings. A homogenous
sample of only large or small firms might yield
results different from the ones discussed herein.
Future studies could improve the findings of this
study by addressing some of these limitations.
REFERENCES
Akkermans, H., van Helden, K., 2002. Vicious and
virtuous cycles in ERP implementation: a case study
of interrelations between critical success factors, EJIS,
11, 35-46.
Chin, W., 1998. Issues and opinion on Structural Equation
Modeling, MIS Quarterly, 22, 1, vii-xvi.
Chin, W., 2000. Tutorial - Partial least squares for
researchers: An overview and presentation of recent
advances using the PLS approach. In ICIS, Brisbane,
Australia.
Doll, W. J., Torkzadeh, G., 1988. The measure of end user
computing satisfaction. MIS Quarterly, 12, 2, 259-274.
Davenport, T., 1998. Putting the enterprise into the
Enterprise System, HBR, 76, 4, 121-131.
Davenport, T., 2000. Mission Critical, Harvard Business
School Press, Boston, MA.
DeLone, W. H., McLean, E. R. 1992. Information systems
success: the quest for the dependable variable, ISR, 3,
1, 60-95.
Esteves, J., Pastor. J., 2001. Enterprise resource planning
systems research: An annotated bibliography, CAIS, 7,
8, 1-52.
Gable G, Sedera, D., Chan T., (2003. Enterprise systems
success: A measurement model. In the 24th. ICIS,
576-591.
Grover, V., Jeong, S. R., Segars, A. H., 1996. Information
systems effectiveness: The construct space and
patterns of application, I&M, 31, 177-191.
Hair, J. F. Jr., Anderson, R. E., Thatham, R. L. and Black,
W. C., 1998. Multivariate Data Analysis. Prentice-Hall
International, Inc., pper Saddle River, NJ.
Ifinedo, P. 2005. Do Organisational-technological
contingency factors influence the perception of ERP
systems success? An exploratory study in the Baltic-
Nordic region of Europe. In Proceedings of 4th.
IBIMA, Lisbon, Portugal.
Ifinedo, P., Davidrajuh, R., 2005. Digital divide in Europe:
assessing and comparing the e-readiness of a
developed and an emerging economy in the Nordic
region, Electronic Government: An International
Journal, 2, 2, 111-133.
Ives, B., Olson, M.H., Baroudi, J. J., 1983. The measure
of user information satisfaction, CACM, 26, 10, 785-
793.
Keen, P., 1980. MIS Research: Reference disciplines and a
cumulative tradition. In the IICIS.
Kerlinger, F. N., 1988. Foundation of Behavioral
Research., Holt Rinehart and Winston, NY.
Ko, D., Kirsch, J. L., King, W. R., 2005. Antecedents of
knowledge transfer from consultants to clients in
enterprise system implementations, MIS Quarterly, 29,
1, 59-85.
Kumar, K., 1990. Post implementation evaluation of
computer-based information systems: current
practices, CACM, 33, 2, 203-212.
Markus, L.., Tanis, C. , 2000. The enterprise systems
experience–from adoption to success. In R.W. Zmud
(Ed.) Framing the Domains of IT Research: Glimpsing
the Future Through the Past, Pinnaflex Educational
Resources, Inc, Cincinnati, OH.
Markus, M. L., Tanis, C., Fenema, P. C., 2000. Multisite
ERP implementation, CACM, 43, 4, 42-46.
Myers, B. L., Kappelman, L. A., Prybutok, V. R., 1996. A
case for including work group productivity measures
in a comprehensive IS assessment model. In the 27th.
Annual Meeting of the DSI.
Myers, B. L., Kappelman, L. A., Prybutok, V. R., 1997. A
comprehensive model for assessing the quality and
productivity of the information systems function:
Toward a theory for information systems assessment”,
IRMJ, 10, 1, 6-25.
Nelson, K. G., Somers, T. M., 2001. Exploring ERP
success from an end-user perspective. In the 7th.
AMCIS.
Nunnally, J. C., 1978. Psychometric Theory, McGraw-
Hill. New York, 2
nd
. edition.
Saarinen, T., 1996. An expanded instrument for evaluating
information system success. I&M, 31, 103-118.
Seddon, P. B., 1997. A re-specification and extension of
the DeLone and McLean model of IS success, ISR, l 8,
3, 240-253.
Seddon, P. B., Graeser, V., Willcocks, L. P., 2002.
Measuring organizational IS effectiveness: An
overview and update of senior management
perspectives, The DATA BASE for advances in IS, 33,
2, 11-28.
Sedera, D., Gable, G. G., Palmer, A., 2002. Enterprise
resources planning systems impacts: a delphi study of
Australian public sector organisations. In the
6
th
.PACIS.
Sedera, D., Gable G., Chan T., 2003a. Measuring
enterprise systems success: A preliminary model. In
the 9th. AMCIS, Tampa, Florida, USA.
Sedera, D., Gable, G., 2004. A factor and structure
equation analysis of the enterprise systems success
measurement model. In the 25th. ICIS.
Sehgal, R., Stewart, G., 2004. Exploring the relationship
between user empowerment and enterprise system
success measures. In the AMCIS.
Somers, T. M., Nelson, K. G. and Ragowsky, A., 2000.
Enterprise resource planning (ERP) for the next
millennium: Development of an integrative framework
and implications for researcher, In the 6th. AMCIS.
Tan, C. W., Pan, S. L. 2002. ERP success: the search for a
comprehensive framework. In the 8th. AMCIS.
ENTERPRISE RESOURCE PLANNING (ERP) SYSTEMS SUCCESS MEASUREMENT: AN EXTENDED MODEL
77
Wu, J., Wang, Y., 2005. Measuring ERP success: the Key-
users’ viewpoint of ERP to produce a viable IS in the
organization, Computers in Human Behavior. In Press.
Zviran, M., Pliskin, N., Levin, R., 2005. Measuring user
satisfaction and perceived usefulness in the ERP
context, JCIS, 45, 3, 43-52.
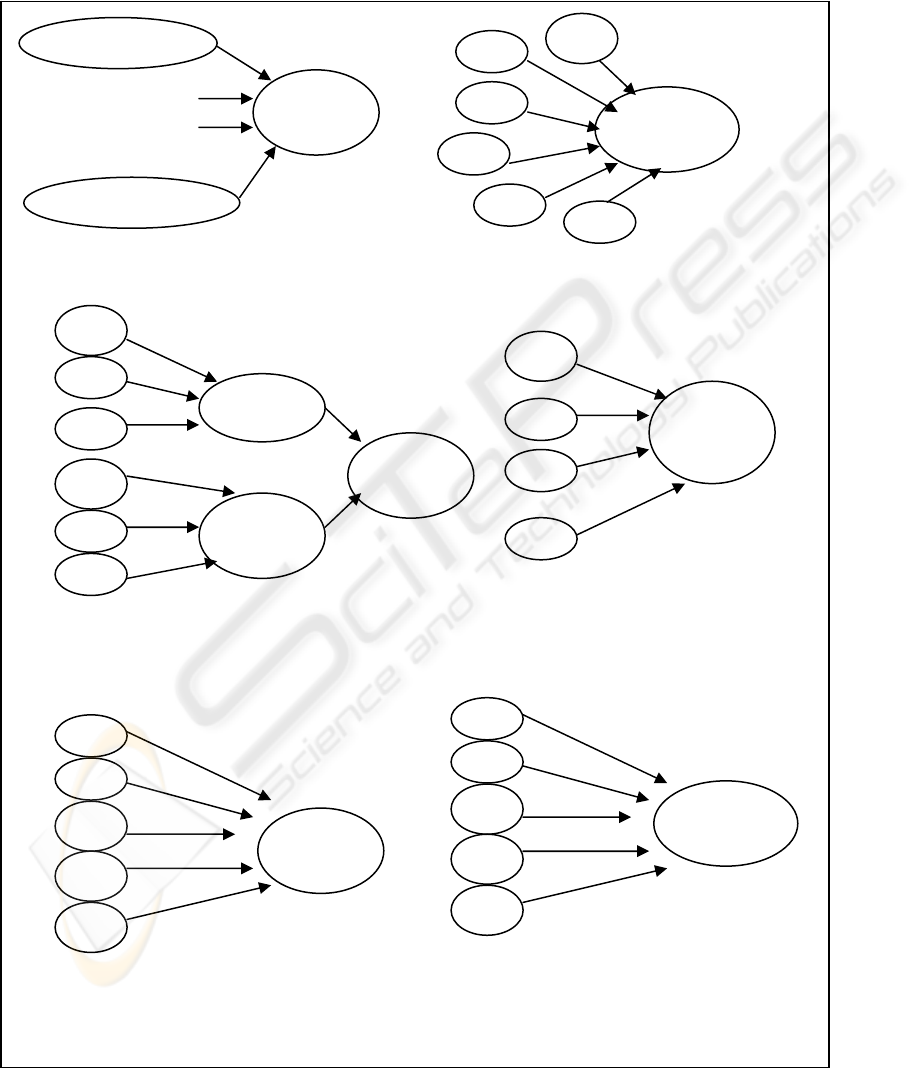
APPENDIX
Illustrations of the alternative ERP systems success
models
ERP
Success
Measure 1
Measure 45
…
…
SQ
I
Q
Quality
Impac
t
ERP
Success
SQ
I
Q
II
ERP
Success
OI
Model 1: One firs
t
-order factor, with
all the 45 items
Model 2: Six firs
t
-order factor and one 2
n
d
order factor
Model 3: Six firs
t
-order factor, Two 2
n
d
order factors, one 3
rd
order factor
Model 4: Four firs
t
-order factor (Gable
et al.)
Model 5: Five firs
t
-order factor, one
2
nd
order factor (without VQ)
Model 6: Five firs
t
-order factor, one 2
n
d
order
factor (without WI)
SQ
I
Q
V
Q
WI
OI
ERP
Success
II
I
Q
WI
OI
S
Q
II
WI
OI
I
Q
ERP
Success
S
Q
VQ
II
OI
I
Q
ERP
Success
II
ICEIS 2006 - DATABASES AND INFORMATION SYSTEMS INTEGRATION
78
