
Multi-modal Categorization of Medical Images Using
Texture-based Symbolic Representations
Filip Florea
1
, Eugen Barbu
2
, Alexandrina Rogozan
1
and Abdelaziz Bensrhair
1
1
LITIS Laboratory, INSA de Rouen
2
LITIS Laboratory, University of Rouen, Avenue de l’Universit
´
e
76801 St. Etienne du Rouvray, France
Abstract. Our work is focused on the automatic categorization of medical im-
ages according to their visual content for indexing and retrieval purposes in the
context of the CISMeF health-catalogue. The aim of this study is to assess the
performance of our medical image categorization algorithm according to the im-
age’s modality, anatomic region and view angle. For this purpose we represented
the medical images using texture and statistical features. The high dimensional-
ity led us to transform this representation into a symbolic description, using block
labels obtained after a clustering procedure. A medical image database of 10322
images, representing 33 classes was selected by an experienced radiologist. The
classes are defined considering the images medical modality, anatomical region
and acquisition view angle. An average precision of approximately 83% was ob-
tained using k-NN classifiers, and a top performance of 91.19% was attained with
1-NN when categorizing the images with respect to the defined 33 classes. The
performances raise to 93.62% classification accuracy when only the modality is
needed. The experiments we present in this paper show that the considered im-
age representation obtains high recognition rates, despite the difficult context of
medical imaging.
1 Introduction
The context of our work is related to the CISMeF project
3
(French acronym for Catalog
and Index of French-language health resources) [1]. The objective of CISMeF is to
describe and index the main French-language health resources (documents on the web)
to assist the users (i.e. health professionals, students or general public) in their search
for high quality medical information available on the Internet.
Given that the content of the medical images placed in on-line health documents
(e.g. guidelines, teaching material, patient information, and so on) is significant for the
CISMeF users, we focus our attention on the development of automatic image cate-
gorization and indexation tools, to facilitate the access to the rich information that the
images are carrying. Contrary to the DICOM format extensively used in PACS (i.e.
Picture Archiving and Communication System), the compressed bitmap formats used
in on-line documents (such as JPEG, PNG or GIF) contain no additional metadata.
The cost of manually annotating these images would be high because the task is time-
consuming and requires advanced domain dependent knowledge.
3
http://www.cismef.org
Florea F., Barbu E., Rogozan A. and Bensrhair A. (2006).
Multi-modal Categorization of Medical Images Using Texture-based Symbolic Representations.
In 6th International Workshop on Pattern Recognition in Information Systems, pages 48-57
DOI: 10.5220/0002500300480057
Copyright
c
SciTePress

In our context, the medical images are extracted from documents, and thus, we con-
sidered the text-objects related to each image (i.e. image caption, image name and/or
image-related paragraphs) as sources of image information. However, preliminary ex-
periments showed that the automatic mapping between the images and their related
texts is not always possible and the presence of all acquisition parameters (i.e. medical
modality, inspected anatomical region, biological system, organ and view angle) is un-
likely. Therefore, even though this approach is in development, due to its incomplete
nature, it is considered only as a secondary image descriptor.
In this paper we present one of the approaches of MedIC module (Medical Image
Categorization) developed by the CISMeF team to automatically extract the acquisition
modality (e.g. radiography, ultrasound or magnetic resonance imaging), the anatomical
region and the acquisition view-angle of medical images. This information is to be
added to the index of the CISMeF resources containing the images. Thus, our final aim
is to allow the users to specify image-related keywords (in addition to the currently used
document-related keywords), when performing queries.
The outline of this paper is as follows. The next section presents some of the related
works. Section 3 describes the image database used and how we created and organize it.
The proposed method is described in Section 4 and experimental results are presented
in Section 5. We conclude the paper and outline perspectives in section 6.
2 Related Work
The majority of the existing medical image representation and categorization/retrieval
systems are dedicated to specific medical contexts (e.g. a given modality or anatomi-
cal region) [2], and thus use restricted context-dependent methods (i.e. representations,
classification schemes or similarity metrics). These systems are rarely accessible via
Internet making impossible their comparison and integration as effective tools to train
medical students or to assist healthcare professionals in the diagnosis stage. However
efforts are being made in organizing image retrieval benchmarks, with the aim of eval-
uating the performances obtained by different systems and approaches [3].
Recently, several studies were presented taking into consideration the categorization
of medical images into modality and anatomical related classes. The IRMA project pro-
poses a general structure for semantic medical image analysis [4], and recently, body-
region categorization results are presented, taking in consideration multiple modalities,
but focusing on X-Rays [5]. On the same dataset, [6] present another classification ap-
proach, based on the extraction of random sub-windows from X-Ray images, and their
classification with decision trees.
Even though these approaches showed good image categorization performances, the
reported results are mainly focused on a single modality (i.e. X-Ray) and the images
used are directly extracted from hospital teaching files. Having to deal with a context
open to various medical resources (Internet), our aim was an architecture capable of
dealing with: 1). significant image variability (multiple medical modalities, anatomical
regions, acquisition view-angles, variations in image quality, size, compression) and
2). the high dimensionality of an image representation space rich enough to effectively
tackle with this variability.
49
3 Medical Image Dataset
The image database used for the present experiments consists of 10322 anonymous
images divided in 33 classes. These images are extracted part from the Rouen Uni-
versity Hospital clinical file and part from web-resources indexed in CISMeF. For the
tests presented in this paper, we considered the main six categories of medical-imaging
modalities: standard angiography (Angio), ultrasonography (US), magnetic resonance
imaging (MRI), standard radiography (RX), computed tomography (CT) and nuclear
scintigraphy (Scinti).
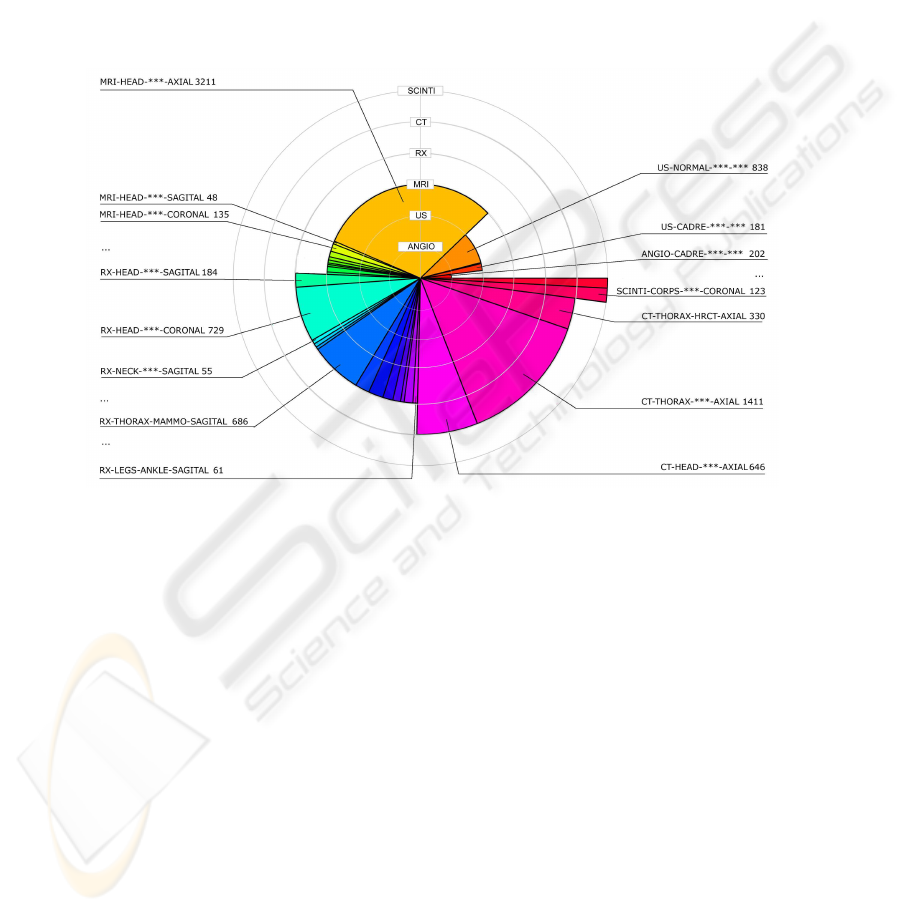
Fig.1. Database composition.
In Fig.1 the six modalities are represented on concentric circles (layers), from the
interior layer that represents the angiography modality, to the exterior one, represent-
ing the scintigraphy. The number of images in each modality is proportional with the
opening angle of its respective slice. The chart is presented in layers for an easier differ-
entiation of the modalities. Already we can easily observe a non-equivalent repartition
between the modalities (e.g. the angiographies and scintigraphies are numbering only a
couple of hundred images, whereas the MRIs, CTs and even RXs are exceeding 2000
images).
For each modality the corpus is further divided in anatomical (e.g. head, thorax,
lower-leg), sub-anatomical regions (e.g. knee, tibia, ankle) and acquisition-views (coro-
nal, axial, sagittal). This hierarchical organization of a medical corpus was already used
in a medical image categorization context [5]. Its main advantage is that it allows a
partition of images according to acquisition and regional criteria, and also the represen-
tation of medical information on an axis from the broadest (the modality) to the most
50
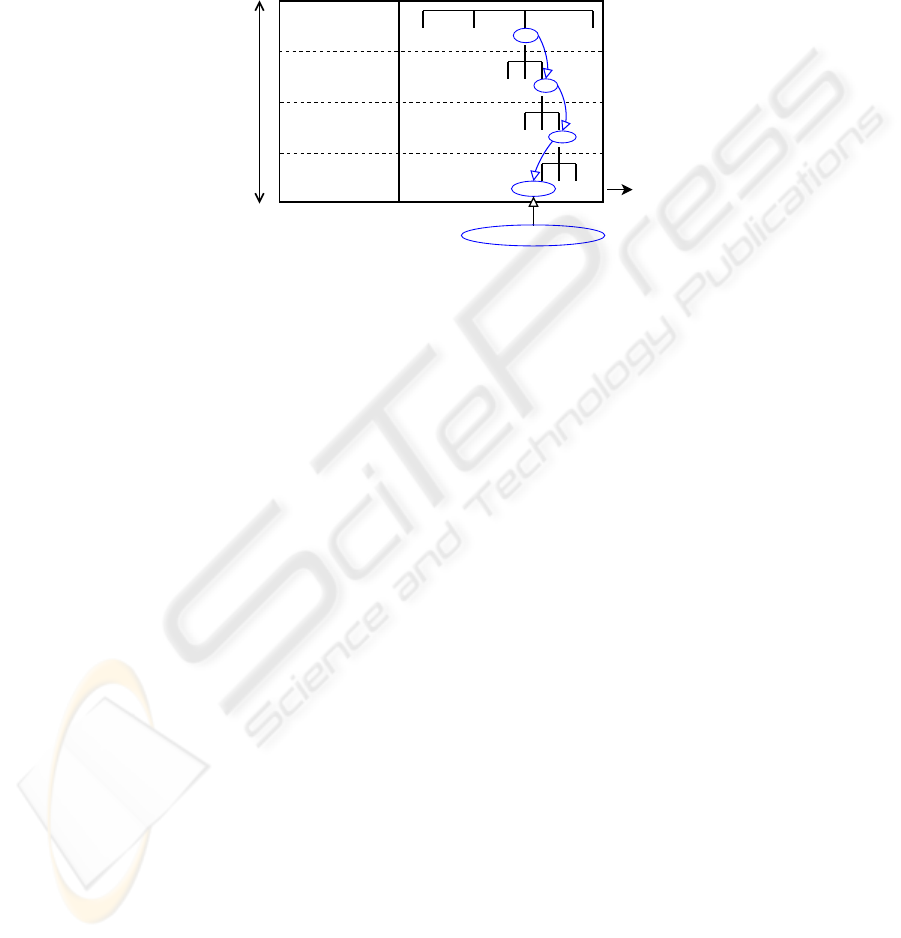
specific (the view). In our experiments the considered classes are the final leaves of
the organizational tree (Fig.2). Considering this hierarchical data structure, more gen-
eral classes could be defined, at any given node (e.g. RX-lowerleg) by merging all the
sub-classes resulted from that node.
Angio
...
...
...
...
U-sono
RX MRI
HEAD
LEGS
...
ANKLE
KNEE
CORONAL AXIAL
...
MODALITY
ANATOMICAL
REGION
SUB-ANATOMICAL
REGION
VIEW ANGLE
Medical
Information
more
general
more
specific
classes
RX - legs - knee - coronal
class
Fig.2. Medical image database organization.
The images present in the database are issued from various sources and thus, were
acquired with different digital or analogical equipments, in different hospital services
in a time span of several years. We note variations in dimension, compression, contrast,
background and textual annotations marked directly on the image. Furthermore, the
images published on the Internet are usually suffering further transformations: resizing,
cropping, high-compression, superposed didactical drawings and annotations. Thus the
intra-class variability (already high due to anatomical and pathological differences) is
increased (Fig.3). The categorization difficulty is further increased by the strong inter-
class similarity between some classes (representing different modalities and/or anatom-
ical regions) (Fig.4):
To account for the different characteristics presented by various imaging modalities
and anatomical regions we choose to combine several types of features extracted from
local representations.
4 System Overview
We designed this multi-modal categorization approach as a three stage process: a) the
extraction of different image-feature sets to describe the visual content, b) the descrip-
tion of these features using a symbolic representation to reduce the feature space di-
mensionality, and c) the classification of the description vectors into classes.
4.1 Image Scaling and Local Representations
All images were down-scaled to 256×256. Clearly, loosing the image aspect ratio in-
troduces some structural and textural deformations, but from our observations, images
51
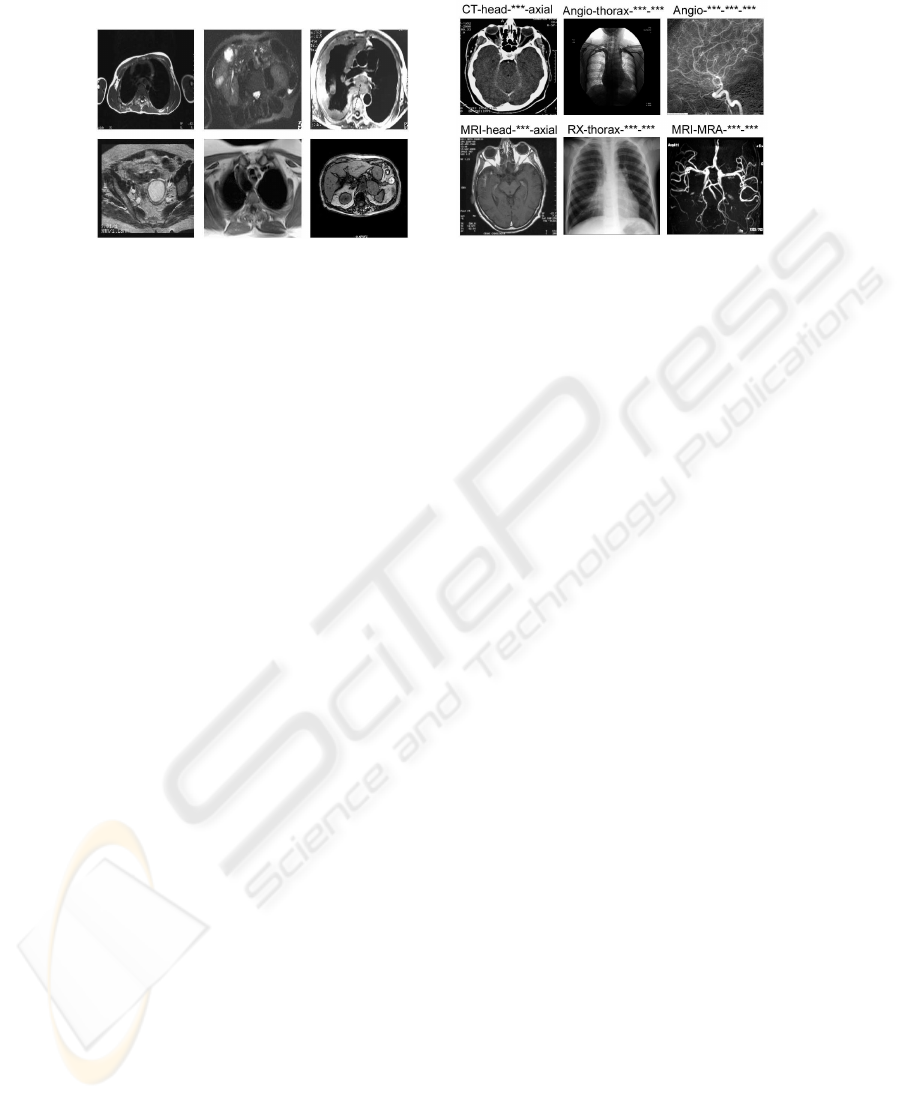
Fig.3. Intra-class variability: ”MRI-
upperbody-thorax-axial”.
Fig.4. Inter-class similarities.
of same category have similar aspect ratios, and finally will be deformed in the same
way.
As we already mentioned, even through the classes are representing distinct modal-
ities, anatomical regions and/or view-angles, the dataset is presenting significant intra-
class variability (Fig.3) and inter-class similarities (Fig.4). In this context, the image
details and the spatial distribution of information inside images are very important to
tackle with these confusions. To accurately capture details and spatial distribution, the
features should be extracted from local representations, previously defined (i.e. seg-
mented). However, relevant medical image segmentation is illusive without a priori
information about images (e.g. the modality and/or the anatomical region; exactly the
information we are trying to extract). Without the possibility of defining local represen-
tations through segmentation, we choose to capture the spatial distribution of features
by extracting them from image sub-windows, defined by splitting the original image
in 16 equal non-overlapping blocks (i.e. of 64×64 pixels). Thus, each image is repre-
sented by a vector of 16 blocks, and from each block features are extracted to describe
its content.
4.2 Feature Extraction
The properties of medical images render some of the most successfully used (i.e. for
image representation) features, like the color, inapplicable. The texture based features
combined with statistic gray-level measures proved to be a well suited global descriptor
for medical images [7].
From the large amount of methods developed for describing texture we extract fea-
tures based on the Harlick’s gray-level co-occurrence matrix (co), the box-counted
fractal dimension (fd) and the Gabor wavelets (gb). In addition we use features de-
rived from gray-level statistic measures (stat): different estimations of the first order
(mean, median and mode), second order (variance and l2 norm), third and forth order
moments (skewness and kurtosis).
These representations can be used as individual descriptors or combined. In previ-
ous experiments, using feature selection algorithms, we pointed out the complementar-
52
ity of these features [8]. Given that the context complexity calls for rich feature repre-
sentations, we exploit the feature complementarity by describing medical images using
all the extracted features.
4.3 Symbolic Representation by Labels
Considering all the features, in all 16 blocks, concerns related to the size of the feature
space are appearing. The large number of features can lead to poor classifier accuracy
(due to what is known as ”the curse of dimensionality”) or slow learning and decision
time.
In order to avoid these problems we label the blocks in an unsupervised manner, and
thus obtain an image description as a vector of labels (i.e. we assign a label for every
block using a clustering procedure).
The first step is to make a crisp partition of the input data set in a number of clusters
(400 in the results presented here). The algorithm used is CLARA (Clustering Large
Applications) [9]. CLARA finds representative objects, called medoids, in clusters. It
starts from an initial set of medoids and iteratively replaces one of the medoids by one
of the non-medoids if it improves the total distance of the resulting clustering. In order
to scale to large data sets sampling methods are employed.
The second step is to apply a hierarchical ascendant clustering algorithm, AGNES
(Agglomerative Nesting) [9], on cluster representants, to add more information to the
first results. AGNES use the Single-Link method applied on a dissimilarity matrix and
merge nodes that have the least dissimilarity in a non-descending fashion.
The hierarchy obtained in the second step is cut in our application at four different
levels (C = 100, 200, 300 and 400 clusters). Every block of the initial image can be
thus described by a maximum of four labels, leading to 16×4=64 characteristics for
the initial image. Using more than one label for a block conducts to a more detailed
multi-scale description of the distances between clusters.
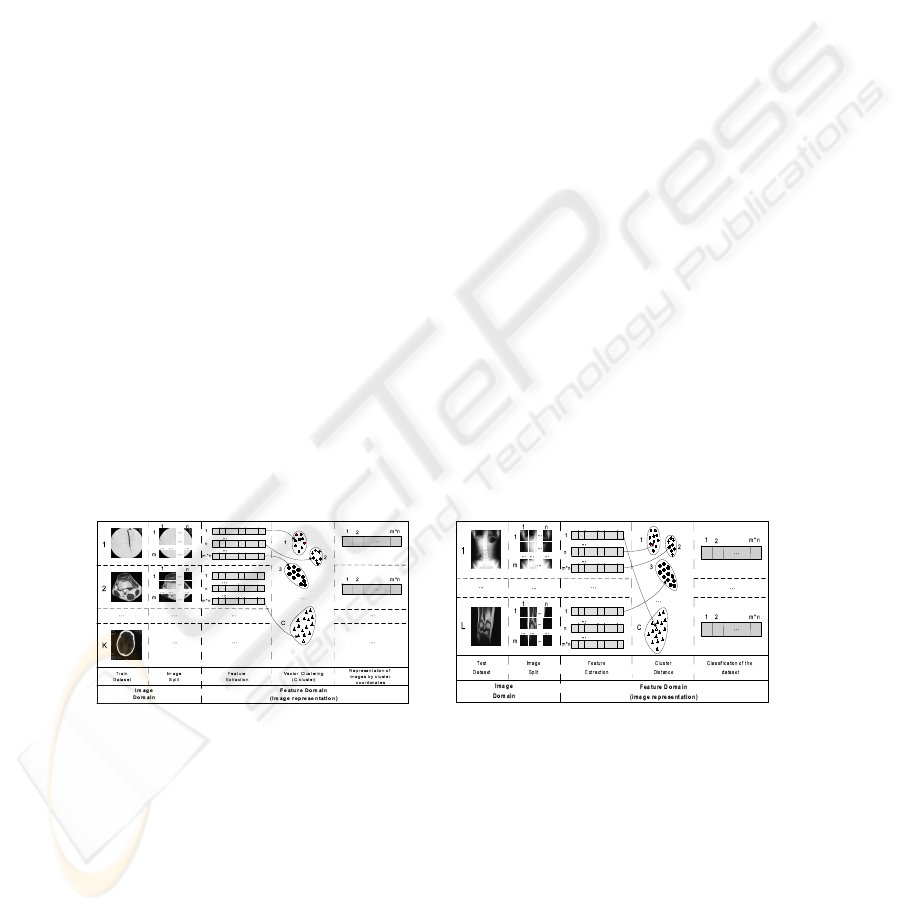
Fig.5. System architecture - Training. Fig.6. System Architecture - Test.
In Fig. 5 we consider a training set of K images, and the partition of each image in
m×n blocks (4×4 in the experiments presented in this paper). After the image feature
representation and the clustering of the image blocks, each initial image will be repre-
sented by maximum m×n×4 (i.e. 64 in this paper) symbolic labels. In the recognition
stage, each block is labeled using the label of the nearest cluster (Fig. 6).
53

4.4 Classification
The next step is the classification of images using this representation. We use labeled
clusters coming from the training images (with the associated class) to classify the test
images. A k-Nearest Neighbour classifier was employed, using the first (1-NN), the
first three (3-NN) and the first five (5-NN) neighbours (weighted by distance). This
classifier has the advantage to be very fast (compared to more complex classifiers) and
still accurate. For computing distances between nominal representations we used VDM
(i.e. Value Difference Metric), a metrics introduced by [10] to evaluate the similarity
between symbolic (nominal) features more precisely.
The principle of the VDM metric is, that two symbols w = x
aj
and z = x
bj
of a
nominal input x
j
are closer to each other, if the conditional probabilities P (y = s|x
j
=
w) and P (y = s|x
j
= z) are similar for the different possible output classes s. A
simplified VDM metric can be calculated as:
d
j
=
S
y
X
s=1
|P (y = s|x
j
= w) − P (y = s|x
j
= z)| =
S
y
X
s=1
|
N
w,s
N
w
−
N
z,s
N
z
|
N
w
(N
z
) is the number of data tuples, for which the input x
j
has as value w (z).
N
w,s
(N
z,s
) corresponds to the number of data tuples, for which additionally the output
has the symbol class s.
The image database was partitioned into training/test datasets, and the classification
accuracy was evaluated using a 10-fold stratified cross-validation scheme.
5 Results
The results, in term of classification accuracy, are presented in the Table 1. The table
shows the performances of the considered descriptors, individually and combined, when
all the 33 defined classes are taken into consideration.
The variations between the results obtained with each of the feature sets are never
more than 15%. The best classification results are obtained with the 4-level symbolic
representation of statistic and texture (stat+texture) feature-set and 1-NN - 91.19%
of classification accuracy. This feature set is composed of 16 co-occurrence (co) fea-
tures (4 features: energy, entropy, contrast and homogeneity, on 4 co-occurrence ma-
trixes, one on each direction: horizontal, vertical and diagonals), one fractal dimension
(fd), 24 Gabor (gb) wavelets features (2 measures on each of the 12 Gabor filter out-
puts; the 12 filters are obtained using a decomposition of λ = 3 scales and φ = 4
orientations) and the 7 statistic measures (stat). This adds to 48 features on each
of the 16 blocks, which finally produces a 768 feature representation vector for each
image.
Combining symbolic representations at all four levels (i.e. 100 clusters .. 400 clus-
ters) produces better results but the gain is not substantial (up to 2%). Furthermore
the differences between representations using 100 clusters and 400 clusters are rarely
bigger than 4%. This indicates that the proposed symbolic representation captures sim-
ilar image information at different levels, and thus joining the representation vectors
54
Table 1. Categorization Results.
100 clusters 200 clusters 300 clusters 400 clusters 100+. . .+400 clust.
features\dim (1×16) (1×16) (1×16) (1×16) (4×16)=64 classif
80,99 84,32 84,31 84,47 86,75 1-NN
co 77,86 80,49 81,17 81,29 83,79 3-NN
76,53 78,95 79,35 78,64 83,62 5-NN
82.73 84.96 85.84 86.72 87.54 1-NN
gb 79.13 81.42 82.30 83.80 84.50 3-NN
76.15 79.21 80.09 81.86 83.60 5-NN
85.54 86.01 86.28 87.79 88.01 1-NN
co+gb 82.52 82.87 83.04 85.23 85.31 3-NN
80.30 80.72 81.05 83.72 84.58 5-NN
84.13 85.70 86.46 88.10 88.56 1-NN
texture 80.45 81.99 83.92 85.59 85.97 3-NN
(co+gb+fd) 77.74 79.06 82.11 83.99 85.37 5-NN
86.99 88.13 89.08 90.12 90.33 1-NN
stat+ 84.16 85.07 85.94 87.49 87.79 3-NN
texture 82.11 83.30 84.11 85.91 87.26 5-NN
will only increase the final feature-space dimensionality and not the features capacity
of representing the images. The 1-NN is always the best choice with all the feature
combinations and number of clusters.
An 9.67% error rate (91.19% of classification accuracy) means that 998 images were
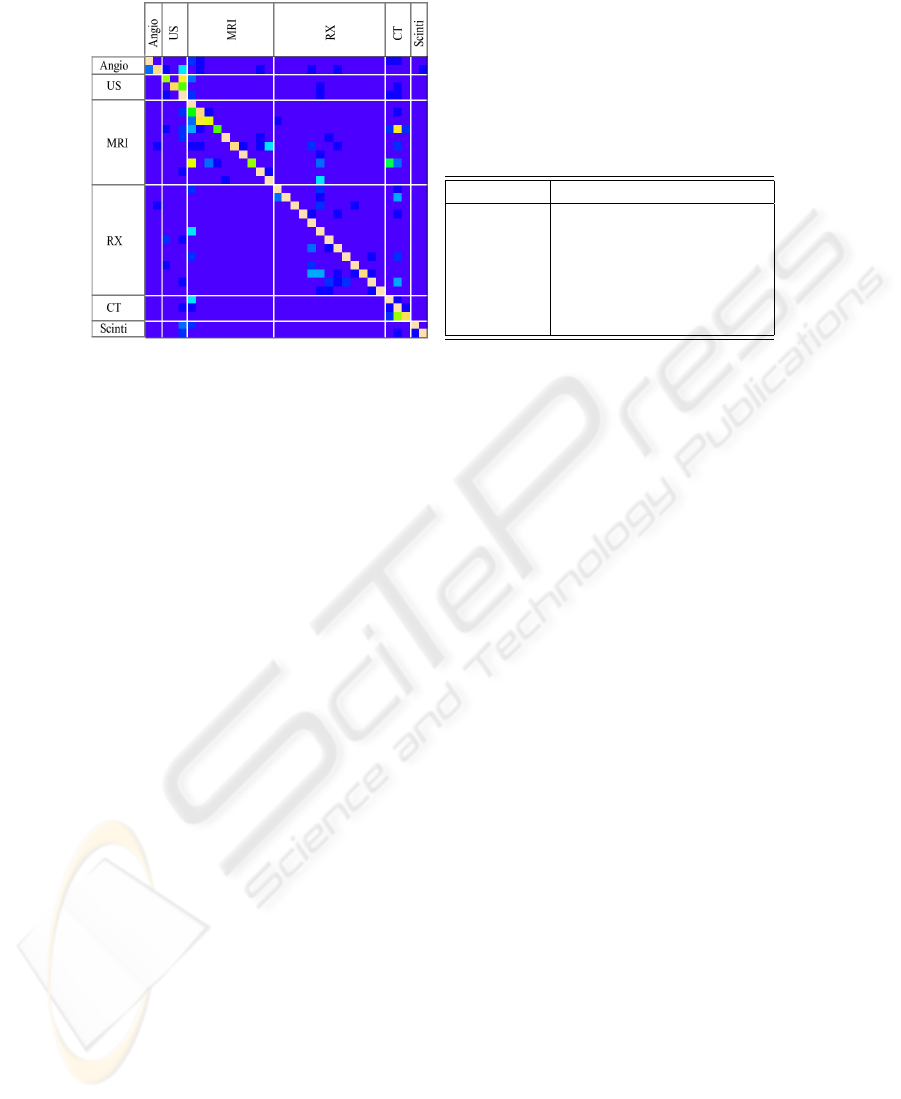
misclassified. Upon inspection of the resulted classification confusion matrix (Fig.7(a))
we observed that indeed the majority of the confusions were made between classes with
high visual similarity (see examples at section 3).
Furthermore, a significant number of confusions are made between classes rep-
resenting the same modality. This led us to a second experiment were we assessed
the performance of accurately extracting the modality, by merging all the classes de-
rived from a modality node (like in Fig.2). Using the 4-level symbolic representation of
stat+texture feature-set and 1-NN classifier, we obtained an error rate of 6.38%
(93,62% accuracy) for the six modalities, having 9664 images correctly classified and
658 miss-classified. In the confusion matrix presented in Table 7(b) we can observe
how the 658 confusions are spread between modalities. Here, we can also note the good
recognition rates of the scintigraphy class (98.57% accuracy), an expected result con-
sidering its compactness (low intra-class variability) and visually dissimilarity from the
rest of the modalities.
For comparison, we used Principal Component Analysis (i.e. PCA) to reduce the
feature space dimensionality and obtained similar (yet sightly superior) results, but us-
ing a superior number of features (i.e. 113, compared to our 16 or even 64). The main
advantage is that compared to PCA, the output of the proposed method is still rep-
resenting the image spatial distribution, allowing further spatial-dependent processing
(considering, for example, only the central blocks).
Using the entire stat+texture feature vector (768 features = 48 features × 16
image sub-blocks) and the 1-NN classifier, the classification performances are slightly
55
(a) Heatmap Representation of the 33 class
Confusion Matrix
a b c d e f
a= Angio-*** 235 2 3 23 4 13
b= US-*** 2 918 68 25 35 0
c= MRI-*** 4 43 3647 25 86 1
d= RX-*** 11 57 55 2431 28 8
e= CT-*** 4 25 84 7 2267 1
f= Scinti-*** 0 0 0 2 1 207
(b) Modality detection (6 class) confusion
matrix
Fig.7. Confusion Matrices.
superior (∼2-5%), but the classification time rises dramatically. Thus, this method is
providing a significant representation space dimensionality reduction (from the initial
768 features of the stat+texture feature vector, we obtain a vector of only 16
elements using 400 clusters; almost 50 times smaller).
6 Conclusion
We presented a medical image categorization approach in the context of CISMeF health-
catalogue. This application is important because it will add to the catalogue, the ca-
pability to formulate queries specifying image-related keywords, and thus, to retrieve
health-resources by the images they contain. We pointed out the difficulties of the con-
text, and we showed that even with these, our approach to describe and classify the
images, obtains good results.
The suggested method is close to VQ (Vector Quantification), where the blocks of
pixels are labeled with the indexes of the prototype blocks [11]. The VQ prototype
blocks are obtained minimizing the QME (i.e. Quadratic Mean Error) between the orig-
inal images and the VQ representation. In our case, the similarity is evaluated in a repre-
sentation space adapted to our categorization task (using texture and high-order statistic
features). We are considering a comparative experimentation of the two approaches.
In future work, we plan to add other features and classifiers to this architecture
aiming at improving these results. We previously showed that the textual annotations
marked directly on the images are containing reliable indicators of the medical modality
[12]. Taking into consideration this information as well as the decisions extracted upon
interpretation of image related paragraphs should allow us to enrich the MedIC module
to better assist the automatic indexing CISMeF heath-resources.
56

References
1. Darmoni, S., Leroy, J., Thirion, B., Baudic, F., Douy
´
ere, M., Piot, J.: Cismef: a structured
health resource guide. Meth Inf Med 39 (2000) 30–35
2. Liu, Y., Teverovskiy, L., Carmichael, O., Kikins, R., Shenton, et al.: Discriminative mr image
feature analysis for automatic schizophrenia and alzheimer’s disease classification. In: Proc.
of MICCAI’04. (2004) 393–401
3. Clough, P., Mu
¨
eller, H., Deselaers, T., Grubinger, M., Lehmann, T., Jensen, J., Hersh, W.: The
clef 2005 cross-language image retrieval track. In: Working Notes of the CLEF Workshop,
Vienna, Austria (2005)
4. Lehmann, T.M., G
¨
uld, M.O., Thies, C., Fischer, B., Keysers, M., Kohnen, D., Schubert, H.,
Wein, B.B.: Content-based image retrieval in medical applications for picture archiving and
communication systems. In Proceedings of Medical Imaging. 5033, San Diego, California
(2003) 440–451
5. G
¨
uld, M., Keysers, D., Deselaers, T., Leisten, M., Schubert, H., Ney, N., Lehmann, T.: Com-
parison of global features for categorization of medical images. In: Proceedings SPIE 2004.
Volume 5371. (2004)
6. Mar
´
ee, R., Geurts, P., Piater, J., Wehenkel, L.: Biomedical image classification with ran-
dom subwindows and decision trees. In: Proc. ICCV workshop on Computer Vision for
Biomedical Image Applications. Volume 3765. (2005) 220–229
7. Florea, F., Rogozan, A., Bensrhair, A., Darmoni, S.: Medical image retrieval by content and
keyword in an on-line health-catalogue context. In: Computer Vision/Computer Graphics
Collaboration Techniques and Applications, INRIA Rocquencourt, France (2005) 229–236
8. Florea, F., Rogozan, A., Bensrhair, A., Darmoni, S.: Comparison of feature-selection and
classification techniques for medical image modality categorization. In: accepted at 10th
IEEE OPTIM2006, SS Technical and Medical Applications, Brasov, Romania (2006)
9. Kaufman, L.: Finding groups in data: an introduction to cluster analysis. In: Finding Groups
in Data: An Introduction to Cluster Analysis. Wiley, New York (1990)
10. Stanfill, C., Waltz, D.: Toward memory based reasoning. Communications of the ACM 29
(1986) 1213–1228
11. Gersho, A., Gray, M.: Vector quantization and signal compression. Kluwer Academic Pub-
lishers, Boston (1992)
12. Florea, F., Rogozan, A., Bensrhair, A., Dacher, J.N., Darmoni, S.: Modality categorisation
by textual annotations interpretation in medical imaging. In et al., R.E., ed.: Connecting
Medical Informatics and Bio-Informatics. (2005) 1270–1275
57
