
Animated Simulation for Business Process Improvement
Joseph Barjis, Bryan D. MacDonald
Georgia Southern University
P.O. Box 8150
Statesboro, GA 30460, U.S.A.
Abstract. This paper is a companion paper and represents a practical example
of simulation and animation modeling of business processes. The theoretical
concept, methodology and modeling technique underlying this paper is
presented in the main paper published in the first section of this book. In this
paper we demonstrate simulation of business processes in a Pharmacy planning
for IT innovations. The simulation methodology is based on a type of Petri nets
adapted for business process modeling. The deliverable of this paper is a
gradual improvement of business processes of the Pharmacy through series of
“what-if” scenarios. We run animated simulation of each “what if” scenario to
visualize the impact of the changes and the dynamic behavior of each scenario
and demonstrate it to the business owner. Before proceeding, readers are
suggested to read the main paper that introduces the underlying simulation
methodology.
1 Introduction
In order to understand the role of simulation in business process improvements, it is
important to have a look at the roots of business process redesign that marked the
nineties decade as a decade of reengineering.
The revolutionary idea of reengineering, that dominated most of the research of
90s in the field, started with the fundamental work of [1]. Although the true roots of
reengineering may trace back as far as the business itself, however as a research field,
scientifically formulated, described and introduced, it started with these publications.
One of the main contributions of [1] was illustration of recursive relationship between
IT capabilities and business process redesign, which is still a fundamental tenet of
organizational change. They also introduced a framework of five steps for process
redesign that become a central concept for many frameworks developed afterwards.
Later, the five steps framework was improved to six steps framework [2, 3] that was
widely used by authors and practitioners throughout the 1990s. The concept of
business process redesign attracted close attention of many other eminent researchers
such as pioneering in this area [7] who contributed the “principles of reengineering”.
However, after the decade of reengineering behind and ubiquity of IT in every type
and level of business, we are challenged not with reengineering, but Business Process
Improvement (BPI), which is a continuous process rather then one time initiative as
with business process reengineering.
Barjis J. and D. MacDonald B. (2006).
Animated Simulation for Business Process Improvement.
In Proceedings of the 4th International Workshop on Modelling, Simulation, Verification and Validation of Enterprise Information Systems, pages
121-127
DOI: 10.5220/0002504801210127
Copyright
c
SciTePress

In this relation, a fundamental question is “why businesses need to change or
improve” in the first place. A short answer would be the fact of operation of
businesses in an environment of accelerating external change; it is also true that often
restructuring and reorganization within any business is an inevitable fact of life. There
are numerous factors that force organizations to consider changes and rethink the way
they accomplish their mission, approach customers, deliver services and interact with
the environment. These factors may be internal or external such as environment,
competition, policy and emerging technologies. Increasing number of publications
emphasize the importance of process modeling and simulation to manage, accomplish
and study business process changes, design or redesign. Authors [8] study and
provide evidence-based facts of significant contribution of process modeling and
simulation in business process reengineering (BPR) projects. Only modeling, as
suggested by [8], may not reveal sufficient information about the processes. For
significant benefits and results with certain accuracy, a serious business process
modeling should be complemented with simulation. On the other hand, only
simulation tools may provide a little help if there is no profound conceptual modeling
preceding it. It would be like “expedition without a map”. As [11] states, an analogy
can be drawn as constructing a building without design and construction drawings. A
valuable lesson extracted from these analogies is that, like expedition without a map,
simulation without a profound concept is possible, but the desired results would be
very hard to achieve if not impossible.
Now that change, adapt and measure the impact would be an inevitable ongoing
agenda of the 21st century enterprises, business process modeling and simulation is
not question of “to be or not to be”, but a prerequisite of success in setting the right
course of sailing. According to authors [8, 10, 11] the potential and full capacity of
business process modeling and simulation still have to reveal. In the following section
we study a Pharmacy that is planning to improve its business processes and
supporting them using new IT.
2 The Pharmacy: Prescription Filling Process
The process starts when a patient presents a prescription to the pharmacy counter and
requests prescription refilling. The pharmacy technician asks if the patient is an
existing one to access her profile information which should be already in the
Quickscrip’s database (Quickscrip is the main IS of the pharmacy). If it is a new
patient, the technician asks the patient to fill out short information including the
patient’s name, address, telephone number, allergies, and whether or not the patient
has any type of insurance. When the profile is created, the technician selects drugs
according to the prescription. The software automatically checks the current drug for
interactions which may cause concern when combined with prescriptions the patient
is currently taking. The software also asks if the technician wants to transmit a claim
to the patient’s insurance company, if one has been provided to the database. If a user
has no insurance coverage, a cash price is assigned to the prescription.
Once a claim has been transmitted to the patient’s insurance company via the
internet, a price is assigned to the prescription based upon the company’s response.
The computer generates a label and sends the information to the ‘robot’ for automatic
122

filling if the requested drug is available in the system’s inventory. The drug is
dispensed into a pre-selected bottle and counted using a laser and gear system which
places the medication into the bottle. The medication is then checked one final time
visually by a pharmacist who also reviews the original written prescription to ensure
no errors are made. Once verified, the prescription is bagged and then sent out to the
cashier for pick-up by the patient. The entire process normally takes no more than ten
minutes. At the pick-up counter, the patient signs for their prescription and pays the
cashier. The termination of this process is related to another process called inventory
control. Inventory is updated every time a medication is issued. Although the
inventory control process and its interrelation with the prescription filling process is
also studied in the case study, here we skip the details.
2.1 Transactions of the Prescription Filling Process
The very first interaction in the “Prescription Filling Process” starts when a patient
presents a prescription to be filled. Thus, the first transaction (T1) is “prescription
filling”. Actually, this is a super transaction that nests many other transactions. This
transaction is initiated by a “patient” and executed by a “pharmacist”. The result of
this transaction is a filled prescription. In this manner we identify all other
transactions:
Transaction 1:
Initiator:
Executor:
Fact:
prescription filling
patient
pharmacist
prescription is filled
Since this activity is a complex process that nests quite few other transactions, this
transaction is called composite transaction. The following transactions are initiated
during the execution of this first transaction.
Transaction 2:
Initiator:
Executor:
Fact:
Transaction 3:
Initiator:
Executor:
Fact:
Transaction 4:
Initiator:
Executor:
Fact:
Transaction 5:
Initiator:
Executor:
Fact:
Transaction 6:
Initiator:
Executor:
Fact:
creating profile
pharmacist
patient
profile is created
checking drug interaction
user interface
computer software
interaction fact is established
assigning price
pharmacist
insurance company
price is assigned
automatic filling
pharmacist
robot
drug is dispensed into a bottle
paying the drug
pharmacist
patient
drug is paid
123
Transaction 4 shows interaction of the process with environment (insurance
company). So, T4 is executed outside of the Pharmacy and the result is communicated
back to the Pharmacy.
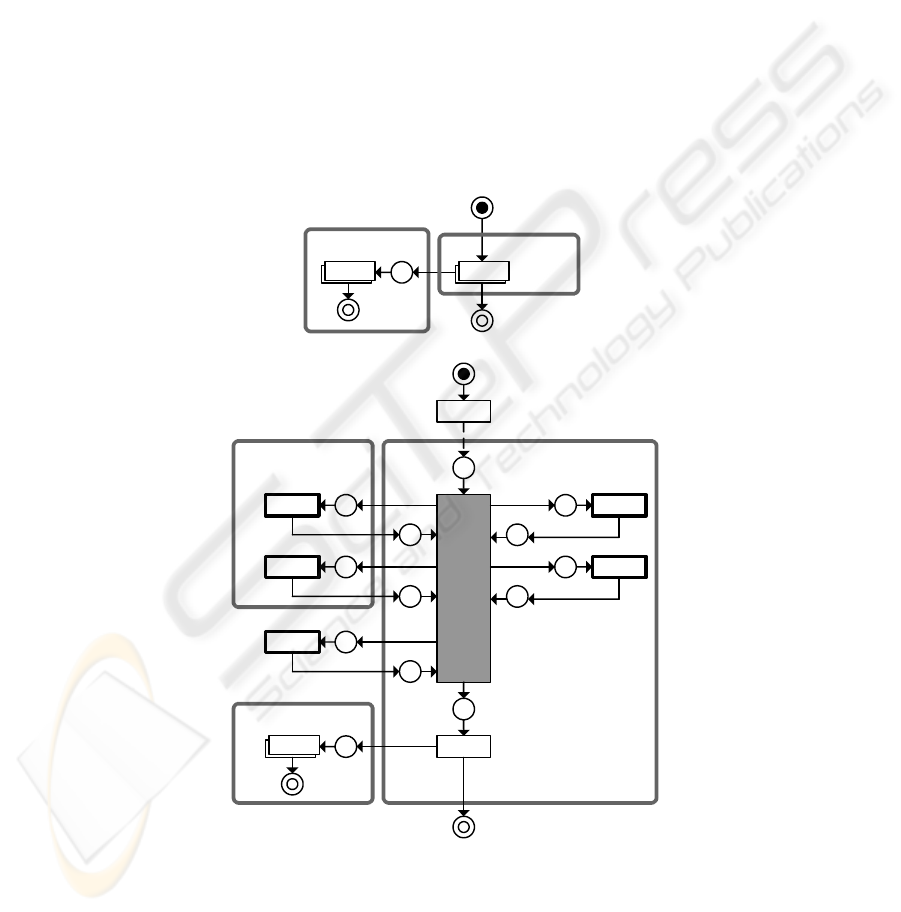
Figure 1 shows all these transactions as an interrelated network. It also shows that
once medication is issued (result phase of the first transaction T1/R), the inventory
control process updates the inventory (represented as a composite Transaction T1).
Although the description of the inventory control process is skipped here, it should be
apparent that this process is also a network of interrelated transactions rather then a
single transaction.
Since transaction T1 is a composite transaction, it is split into three phases (T1/O,
T1/E and T1/R) in order to show its relation with all transactions nested inside it. In
contrast, all other transactions are simple transactions and therefore they are
represented in a compact form where the three phases are compressed as one bold
rectangle. It should be noted that all transactions initiated during the execution phase
of the first transaction (T1/E) should be completed first before T1 result phase is
achieved (T1/R).
a)
T1
Inventory
T1
Prescription
b)
T1/O
Prescription
T1/E
T3
T5
T1/R
T6
T4
T2
Patient
T1
Inventory
Fig. 1. Petri net model of the “Prescription Filling” process: a) high-level; b) detailed.
124

In order to better understand the model of figure 1, it should be read in the
following manner: T1/O represents a request for prescription filling. T1/E represents
execution of this request. However, this Execution phase embeds series of other
interrelated transactions. Some of these transactions take place every time when a
patient requests prescription filling, while a subset of them depends on certain
conditions. Thus, T1/E, first of all, checks if the patient is an existing one or a new
one. For a new patient, there a new profile must be created. The process of creating a
new profile is represented by Transaction T2. Therefore Transaction T2 is initiated
during T1/E. The phase T1/E also requires checking if the requested medication has
no interaction with the medication currently taken by the patient. This process is
represented as Transaction T3. Similarly, Transactions T4, T5, and T6 also must be
completed during the execution of Transaction T1, because their results are needed to
complete T1. Once all the nested transactions are completed, the last phase of
Transaction T1, i.e., T1/R is accomplished and the process is terminated. Readers may
also have noted that the completion of this process is also related to the “inventory’
control process that makes sure the issued medication is subtracted from the inventory
and checks if this medication should be ordered for restacking. Since the focus is not
on the inventory process, it is simply represented by one composite transaction that in
fact is composed of a few business transactions.
As a final remark, it should be noted that the derived Petri net model serves as an
input model for any tool based on discrete event concept such as Arena
TM
simulation
system.
3 Animated Simulation of the Prescription Process
In this section we construct an animated simulation model of the prescription process
using the Arena
TM
simulation system that is widely used for business process
modeling [9, 12]. Arena has an integrated environment for developing Model Logic,
Animation model and conducting Statistical Analysis. Before building an animation
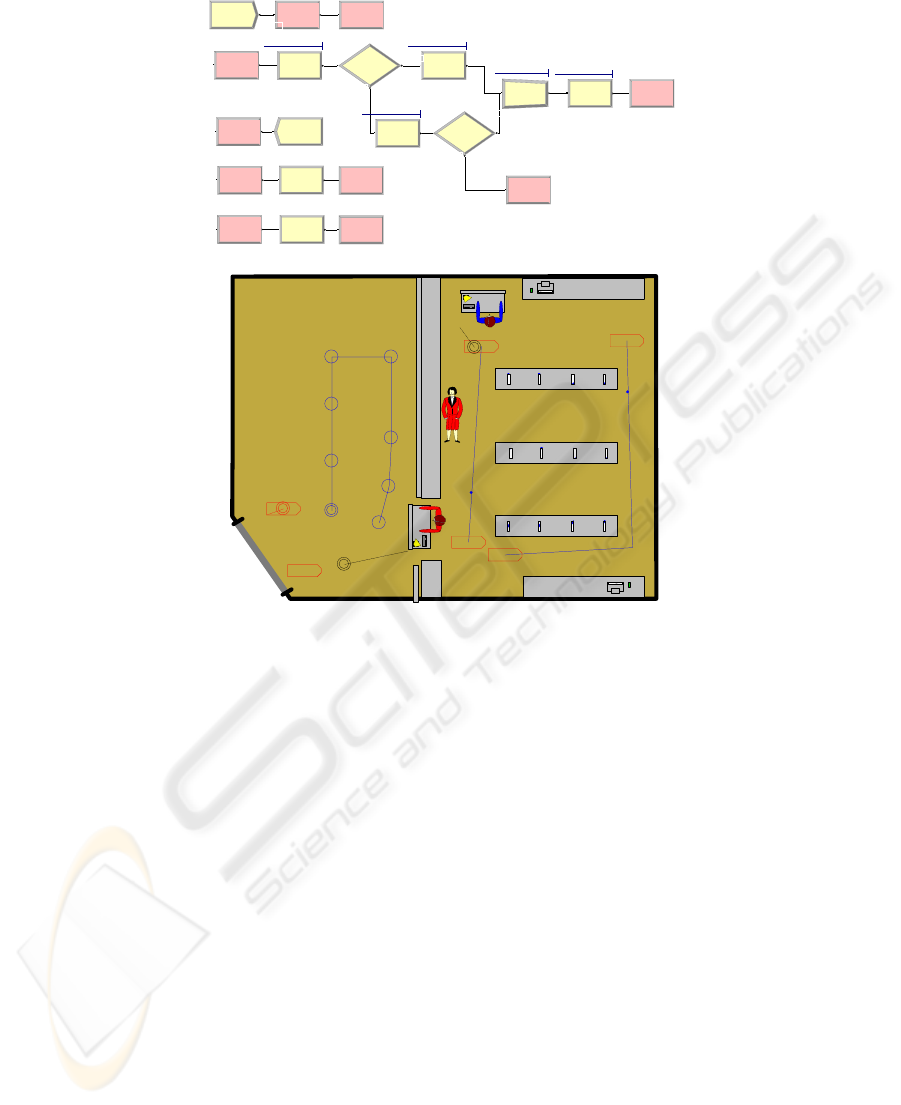
model, it is needed to develop a logical model, as illustrated in Figure 2a. Once a
logical model is built, an animation model, using different entities (graphics, pictures,
human agents, decorations), is developed (Figure 2b). However, the animation model
needs to be demonstrated on computer; therefore the animation model is not included
to save the paper space; however some outcomes of the simulations are discussed
below.
125
a)
Customer A rrival
Pharmacy Door Mov e To C l erk
Cl erk A rea
Submit
True
Fals e
New or Existing Create Profile
Interaction
True
Fals e
Is there Interacti on
Batch 3
Leave P harmac ey
Exit Street
Exit
Claim
Pharmacist
P ass to
Pharmacist
Filling
Cl erk P ayment
Area
Clerk P ayment
Paying
Fini s hed P aying
0
0
0
0
0
0
0
0
0
0
0
0
0
b)
Fig. 2. Screenshot of the Model Logic and Animation Model.
As illustrated above, the Prescription Filling Process consists of six business
transactions. In figure 2a, these transactions are represented as processes, grey
rectangles identified as Submit, Profile, Interaction, Claim, Filling and Paying. Figure
2b represents an animated model in which entities are moving, resources have states
(idle, busy), queues are created, etc.
Since the Arena software provides integrated package for constructing a model
and conducting simulation, analyst can run simulations of the process to analyze
performance and resource usage, to identify repetitive loops and inefficient
bottlenecks, and to predict process performance and productivity. For better analysis
and comparison, Arena simulation package provides analysts with features such as
generating a report on the simulation results. a full report of simulation may include
several pages detailing average time, queues, busy, idle, etc.
4 Conclusion
In this paper we discussed animation simulation for business process improvement. In
illustrating how all the steps from business process description to modeling and,
finally, simulation can be followed, we used a real life case of the Pharmacy.
126

This integrated study shows that the transaction concept is a profound concept in
identifying atomic processes and their relevant actors and their roles as an initiator or
executor. The Petri net models used in this paper show that these models are very
easy to build, understand and simulate. Although numerous tools are available to
simulate directly the Petri net models, we used Arena for its animation features, rich
library of entities and tool for importing diagrams from applications such as Visio.
Through this small example we learned that animated simulation allow analysts to
easily communicate different scenarios to non-technical users such as employees of
the Pharmacy or manager of the store.
As a conclusion, although it is a research in progress, we do believe that this paper
provides (or at least has the potential) pragmatic value for business process simulation
and business alignment with IT and communication of the results to non-technical
users via animation.
References
1. Davenport, T.H. and Short, J.E. (1990). The New Industrial Engineering: Information
Technology and Business Process Redesign. Sloan Management Review, Summer 1990,
Vol. 31 Issue 4, p11, 17p
2. Davenport, T.H. (1995a). Business Process Reengineering: Its Past, Present, and Possible
Future. Harvard Business Review, November 1995
3. Davenport, T.H. (1995b). Reengineering a Business Process. Harvard Business Review,
November 1995
4. Davenport, T.H., Champy, J.A. (1993). Reengineering the Corporation. New York,
HarperBusiness, 224 pages
5. Dietz, J.L.G. (1999). Understanding and modelling business processes with DEMO. In the
Proceedings of the Annual International Conference on Conceptual Modelling (ER’99),
Paris, November.
6. Dietz, J.L.G. (2002). The Atoms, Molecules and Matter of Organizations. Proceedings of
the Seventh International Workshop on the LAP, Delft, Netherlands, ISBN: 90-9015981-9.
7. Hammer, M. (1990). Reengineering Work: Don’t Automate, Obliterate. Harvard Business
Review, July-August
8. Hlupic, V.; de Vreede, G-J. (2005). Business process modelling using discrete-event
simulation: current opportunities and future challenges. International Journal of Simulation
and Process Modelling, 2005 - Vol. 1, No.1/2 pp. 72 – 81
9. Kelton, D. W., Sadowski, R.P., Sturrock, D.T. (2004). Simulation With Arena. 3
rd
ed.,
McGraw-Hill, ISBN: 0-07-121933-1
10. Kleijnen, J.P.C. (2005). Supply chain simulation tools and techniques: a survey.
International Journal of Simulation and Process Modelling, 2005 - v. 1, No.1/2 pp. 82 - 89
11. Seila, A.F. (2005). The case for a standard model description for process simulation.
International Journal of Simulation and Process Modelling, 2005 - v. 1, No.1/2 pp. 26 – 34
12. Vreede, G.J. de; Verbraeck, A.; Eijck. D.T.T. van (2003) "An Arena Simulation Library for
Business Process Modelling". Simulation, Vol 79, No. 1, pp. 35-42.
127
