
SIMILARITY OF DOCUMENTS AND DOCUMENT
COLLECTIONS USING ATTRIBUTES WITH LOW NOISE
Chris Biemann and Uwe Quasthoff
Institute of Computer Science, NLP department, Universityof Leipzig, Johannisgasse 26, 04103 Leipzig, Germany
Keywords: Document clustering, graph clustering, link similarity, content similarity.
Abstract: In this paper, a unified framework for clustering documents based on vocabulary overlap and in-link
similarity is presented. A small number of non-zero attributes per document, taken from a very large set of
possible attributes, ensure efficient comparisons procedures. We show that A) low frequent words are
excellent attributes for textual documents as well as B) sources of in-links as attributes for web documents.
In the cases of web documents, co-occurrence analysis is used to identify similarity. The documents are
represented as nodes in a graph with edges weighted by similarity. A graph clustering algorithm is applied
to group similar documents together. Evaluation for textual documents against a gold standard is provided.
1 INTRODUCTION
As the World Wide Web grows constantly at a
staggering rate, the needs of a user searching some
specific piece of information are hampered by the
sheer mass and almost anarchic structure of the
Web. Neither web pages follow a unified structure,
style or even language, nor their arrangement and
reachability by hyperlinking is controlled by any
central instance.
Search engines alleviate the problem to some
extend by ranking results that aims to place the most
prominent pages at high ranks. For adding more
structure in the result set, the corresponding links
can be grouped into different categories by
identification of Web communities. Previous
approaches group similar pages/servers using the
hyperlink structure of the web, e.g. (Gibson et al.,
1998, Chakrabarti et al. 1999, or Flake et al., 2000)
either directly or via bibliographic coupling, i.e.
links appearing together on many pages and make
little or no use of textual similarity. Merely anchor
texts of hyperlinks are taken into account by e.g. (He
et al., 2001, Chakrabarti et al., 1999). In this work,
we present a unified framework for grouping (web)
documents into meaningful clusters using
bibliographic coupling or full document text.
1.1 Motivation
The similarity of web documents has a wide range of
applications. First, one might search for nearly
identical documents in order to identify copyright
violations. Second, one might be interested in related
texts far from being identical to get additional
information about a topic. Last not least there might
be documents addressing the same topic but which
are by no means similar as strings.
In the case of web sites one might be interested
in the function of a specific site, e.g. if it constitutes
a search engine or a book store.
Information on web document similarity can be
used by search engines to group similar documents
into clusters. This might also help to detect link
farms and web rings that try to increase their page-
rank (Brin and Page, 1998) by heavily linking to
each other.
For the description of similarity we always use
only a small number of attributes per document. For
text documents we use low frequency words
contained in the documents, and for web sites we
analyse the link structure to find out how often two
web sites are linked from the same origin.
The document collection is in both cases
represented as a graph, which we further cluster with
a graph clustering algorithm. Manual examination of
web links and comparison to pre-classified labels on
low frequency words suggest that both measures are
able to capture (web) document similarity.
130
Biemann C. and Quasthoff U. (2007).
SIMILARITY OF DOCUMENTS AND DOCUMENT COLLECTIONS USING ATTRIBUTES WITH LOW NOISE.
In Proceedings of the Third International Conference on Web Information Systems and Technologies - Web Interfaces and Applications, pages 130-135
DOI: 10.5220/0001260601300135
Copyright
c
SciTePress

Another work on web document clustering that
uses graph clustering methods is (He et al., 2001),
where spectral clustering on a combination of textual
similarity, co-citation similarity and the hyperlink
structure is applied.
1.2 Background
We start with a unified approach for both kinds of
similarity. As in standard Information Retrieval we
describe a corpus containing n documents by a set of
m attributes. The attributes are words and each word
is either contained in the document or not. The
corresponding term-document-matrix is defined as
usual: D=(d
ij
) where d
ij
=1 if document i contains
term j and d
ij
=0 otherwise. The i-th line of D is
called the document vector for the i-th document.
The following step describes the selection of
attributes. Usually, all words with the possible
exception of stop words are considered. This
approach ensures a description for almost any
document because a meaningful document does not
contain only stop words. But high frequent words
are responsible for noise in this description. They are
not very special in the sense that they may have
multiple meanings and can be used in very different
settings. This disadvantage is usually addressed by
term weights, but this will only reduce some of the
noise. In our approach, we dramatically reduce the
number of attributes by reducing the number of
attributes to less then 30 for a typical document. For
this, we restrict the set of terms to all low frequent
words having an absolute frequency<f. In the
experiments, we deliberately choose f=256 which
means we ignored the 100.000 most frequent words.
Such a rigorous reduction of the feature space is not
recommendable for Information Retrieval. For
clustering, this helps to avoid artefacts caused by
ambiguity and speeds up processing considerably.
As a consequence, we get a very specific
description using only very special terms. This will
lead to a very strict similarity if two documents
share many such terms. As will be shown in the
evaluation, the converse is also true: With a high
probability, two similar documents share several
more special terms not used as attributes.
This approach using less then 30 attributes to
describe a document is tested in the following two
settings:
1. We describe a document with low frequent
words contained in the document.
2. we describe a web page by the link targets
found in this page.
Both approaches allow efficient calculation and give
remarkable results.
1.2.1 Document Similarity using DD
T
The similarity of two documents is usually
calculated as the dot product of the corresponding
document vectors. The product matrix S=DD
T
contains exactly these similarities. Having used only
low frequent words as described above we do not
need any term weighting.
The above similarity matrix can be calculated
efficiently steps by the following algorithm:
For each word do {
list all pairs of documents
containing this word;
sort the resulting list of pairs; }
For each pair (i,j) in this list, count
the number of occurrences as s
ij
;
Depending of the size if the collection, s
ij
>7 (or
so) will show some weak similarity, s
ij
>15 (or so)
will be returned for very similar documents.
1.2.2 Co-occurrence for Words using D
T
D
Using the matrix T= D
T
D instead of S=DD
T
we
count the co-occurrences of pairs of terms. Usually
in co-occurrence analysis (e.g. Krenn and Evert,
2001), there is an additional significance measure to
translate co-occurrence numbers into a significance.
But in our case of low frequent words (to be more
precise: in the case of similar frequencies for all
terms) there is no need for this significance measure.
From a more semantic point of view, repeated
co-occurrence of two words is known to show a
strong semantic association (Heyer et al., 2001). The
type of this association is not limited to similarity
(or, even stronger: synonymy), in fact we will find
any semantic relation. Similar thresholds as above
apply. For example, co-occuring terms of the word
Dresden (ordered by significance) are: Leipzig,
Chemnitz, Erfurt , ... , Frauenkirche, München,
Technischen Universität, Hamburg, Rostock,
Magdeburg , …, Staatlichen Kunstsammlungen, …,
Semperoper, …, Sächsische Schweiz, ...
These related terms are other cities near Dresden
and local organizations or tourist attractions.
1.2.3 Co-occurrence of Hyperlinks
In this section, we will use the in-links as attributes
for documents. Then, two documents are similar if
there are many sources linking to both of the
documents.
For technical reasons, we again use co-occurrence
statistics to calculate these similarities. The URLs
SIMILARITY OF DOCUMENTS AND DOCUMENT COLLECTIONS USING ATTRIBUTES WITH LOW NOISE
131
will first be considered as a kind of term occurring
in a document. This will be used to construct the
term-document-matrix D. On the other hand,
documents belong to URLs. Hence we can use the
term similarity matrix S to find similar URLs. To
see the striking similarity between co-occurring
words and co-occurring URLs, we refer to the most
significant URLs for www.dresden.de as depicted in
figure 1. For the city of Dresden, we find the same
relations as above. Moreover, we find the URLs for
the same objects.
2 VISUALISATION AND
CLUSTERING
A set of objects together with a similarity measure
can be interpreted as a weighted, undirected graph:
Nodes are given by objects, an edge between two
nodes is drawn iff their similarity exceeds some
threshold. For drawing such graphs, techniques like
simulated annealing (Kirkpatrick et al., 1983) have
proved to be useful. An implicit clustering algorithm
often places groups of similar objects close to each
other. But due to the limitations of two-dimensional
graph drawing we need an additional clustering
algorithm. As a result all nodes are coloured,
reflecting the different clusters by different colours.
It is known that the Chinese Whispers (CW)
graph clustering algorithm (Biemann, 2006) works
well in similar settings for word clustering. CW is
parameter free, requiring neither the number of
clusters or other settings to be specified. Forther, it is
time-linear in the number of edges, making its
application viable to mega-node graphs.
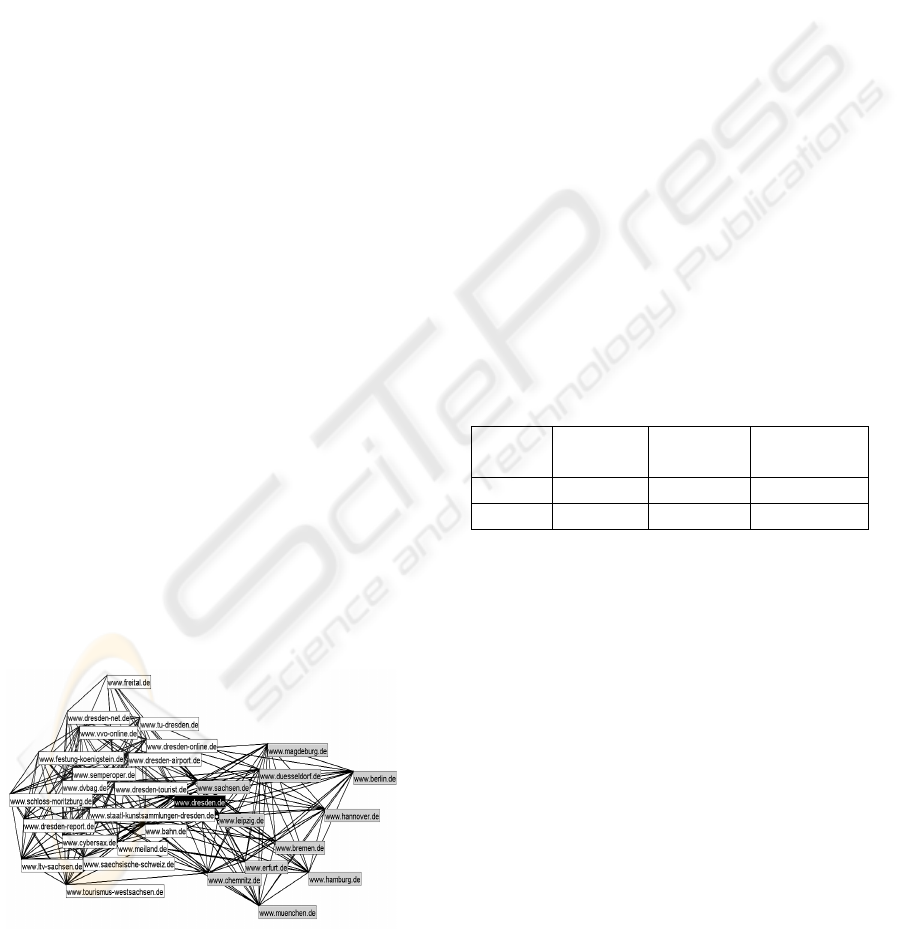
Figure 1 below shows the co-occurrence graph of
the server www.dresden.de. Different colour shades
symbolize the outcome of CW.
Figure 1: Server co-occurrence graph for www.dresden.de
with two clusters containing other German cities (right
hand side) and other organisations in Dresden (left hand
side).
3 EXPERIEMENTAL RESULTS
3.1 Results on the Web Graph
When trying to sort web documents into different
groups, one might be interested in single documents,
represented by the URL, or servers, represented by
the first part of the URL. For the two different tasks,
different results can be expected. Depending on the
application, one might chose one or the other option,
or combine both.
For experiments we used a small part of the
internet, downloaded for the Nextlinks Project
(Heyer and Quasthoff, 2004) and processed the links
contained in the documents in the way as described
in section 1.2 to obtain a co-occurrence graph of
URLs (or servers, respectively).
Table 1 characterizes the graphs obtained from
the web in terms of quantitative measures. Recall
that edges depend on the significance of two
URLs/servers to appear together on the same
(another) URL/server. Due to servers preferably
linking on the same server, more than 60% of visited
servers did not find their way into the graph and are
therefore excluded from the clustering.
Table 1: Quantitative characteristics for the two web
graphs.
node type total nodes # of edges
# of nodes
with edges
servers 2201421 18892068 876577
URLs 680239 19465650 624332
Unfortunately, there is nothing like a gold
standard for URL or web server classification, so the
clusters resulting from CW had to be examined
manually.
As the size of web graph components follow a
power-law distribution as experimentally determined
by (Broder et al., 2000), a similar distribution can be
found in our web co-occurrence graphs. This
structure is preserved by the CW algorithm which
can merely split components into smaller clusters,
but cannot cross component boundaries. Figure 4
shows the cluster size distribution for clustering the
two graphs.
WEBIST 2007 - International Conference on Web Information Systems and Technologies
132
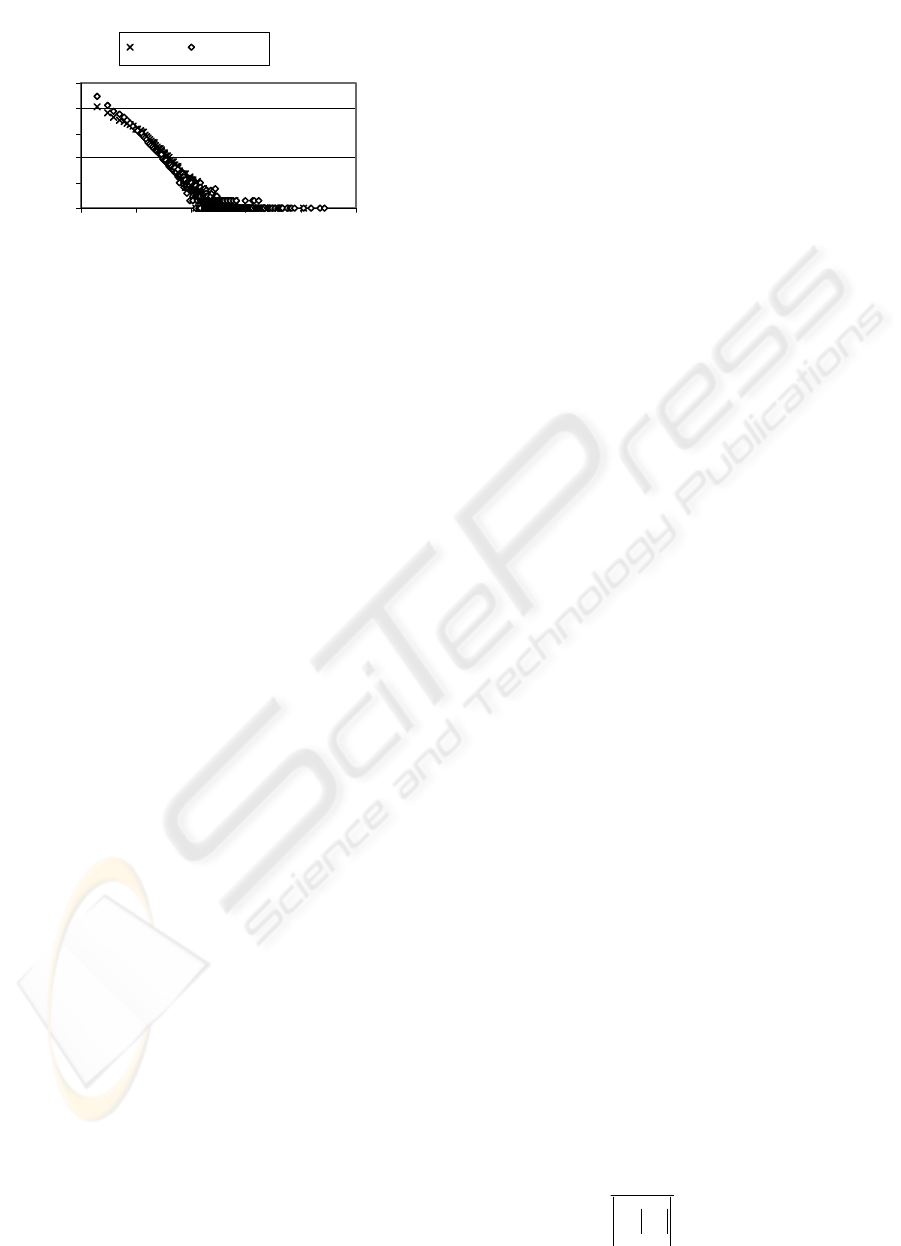
Cluster Size Distribution
1
10
100
1000
10000
100000
1 10 100 1000 10000 100000
Cluster size
# of clusters
URLs Serv ers
Figure 4: Power-law in cluster size distribution for URLS
and servers.
3.1.1 Examination of the URL Graph
First, we looked at the largest three clusters,
comprising 10970, 5344 and 4872 URLs. The
largest cluster contains a link farm launched by
some provider of sexually explicit content, over 67%
contain the same domain (with different sub-
domains) in the URL name and the others are
aliases. The second largest clusters contains a
variety of domain names that all link to pages
offering single - yet different - books in a uniform
layout, hosted by one single web hosting company.
Cluster three contains again pornographic pages
from several hosting companies as well as the
companies' homepages. The next large clusters are
composed from electronic sales, holiday flat offers
and a Russian web ring.
Examining 20 randomly chosen clusters with a
size around 100, the results can be divided into
• (6) aggressive interlinking on the same server:
pharmacy, concert tickets, celebrity pictures
(4)
• (5) link farms: servers with different names,
but of same origin: a bookstore, gambling, two
different pornography farms and a Turkish
link farm
• (3) serious portals that contain many intra-
server links: a web directory, a news portal, a
city portal
• (3) thematic clusters of different origins:
Polish hotels, USA golf, Asian hotels
• (2) mixed clusters with several types of sites
• (1) partially same server, partially thematic
cluster: hotels and insurances in India
Closer examining the four celebrity picture
clusters, we found 1789 pages from this site in our
database, organized in 18 clusters of 90-113
members. Within, the clusters are fully linked,
having no links to the other clusters. This seems like
a strategy to avoid link farm detection - the pages
look all the same.
3.1.2 Examination of the Servers Graph
Web host clusters can help grouping related servers
in order to present search engine results in a more
compact way and offer different possibilities for
ambiguous queries.
The largest cluster from the servers graph (26713
nodes) can be broadly described by education,
studies and schools/university. In the second cluster,
a link farm was found (21954 nodes) that used sub-
domains which counted as different servers in our
experiment. The third largest cluster (15151 nodes)
did not make any sense, in the next largest clusters
we found several pornographic link farms mixed
with a few sites not fitting into the category, health-
related pages, and a press-related cluster. All in all,
the large clusters in the servers graph are not as
homogeneous as the clusters in the URL graph and
quite a few unrelated pages could be seen in the
random test samples. As in the previous paragraph,
we randomly chose 20 clusters with a size around
100, which can be described as follows:
• (9) thematically related clusters: software,
veg(etari)an, Munich technical institutes, porn,
city of Ulm, LAN parties, satellite TV, Uni
Osnabrück, astronomy
• (6) mixed but dominated by one topic:
bloggers, Swiss web design, link farm, motor
racing, Uni Mainz, media in Austria
• (2) link farms using different domains
• (3) more or less unrelated clusters
3.2 Results on Document Similarity
For evaluating document similarity, it is possible to
use pre-categorized collections and to test whether
the clustering method reproduces the classes given
as a gold standard. The quality of a clustering can be
measured in various ways, e.g. a cluster distance
measure as proposed by (Meilă, 2002). For our
evaluation, we used a more intuitive measure: we
calculate the purity of clusters with respect to a
given classification and weight the contributions of
different clusters by cluster size.
Let D = {d
1
, ... d
q
} be the set of documents, G = {G
1
,
... G
m
} the gold standard classification and C = {C
1
,
... C
p
} be the clustering result. Then, the cluster
purity CP is calculated as given:
∑
∑
=
=
=
∩⋅=
p
i
ik
mk
p
j
j
CG
C
GCCP
1
..1
1
||max
1
),(
SIMILARITY OF DOCUMENTS AND DOCUMENT COLLECTIONS USING ATTRIBUTES WITH LOW NOISE
133
Of course, a trivial clustering assigning a
different label to each document would get a CP of
1. Therefore, the sizes of the resulting clusters have
to be taken into account additionally to judge a
clustering result when using CP. However, the
problem of trivial clusterings did not arise in our
data, as we shall see in figure 6. The measure
handles multiple classifications by choosing the
most appropriate classification for finding out the
class label G
i
which maximizes the purity of cluster
C
j
.
We used newswire of the year 2000 from dpa
(Deutsche Presseagentur / German News Agency).
A total of 202086 documents is assigned to 309
classes. Documents may have multiple classes
ranging from 1-8 with an average number of 1.49
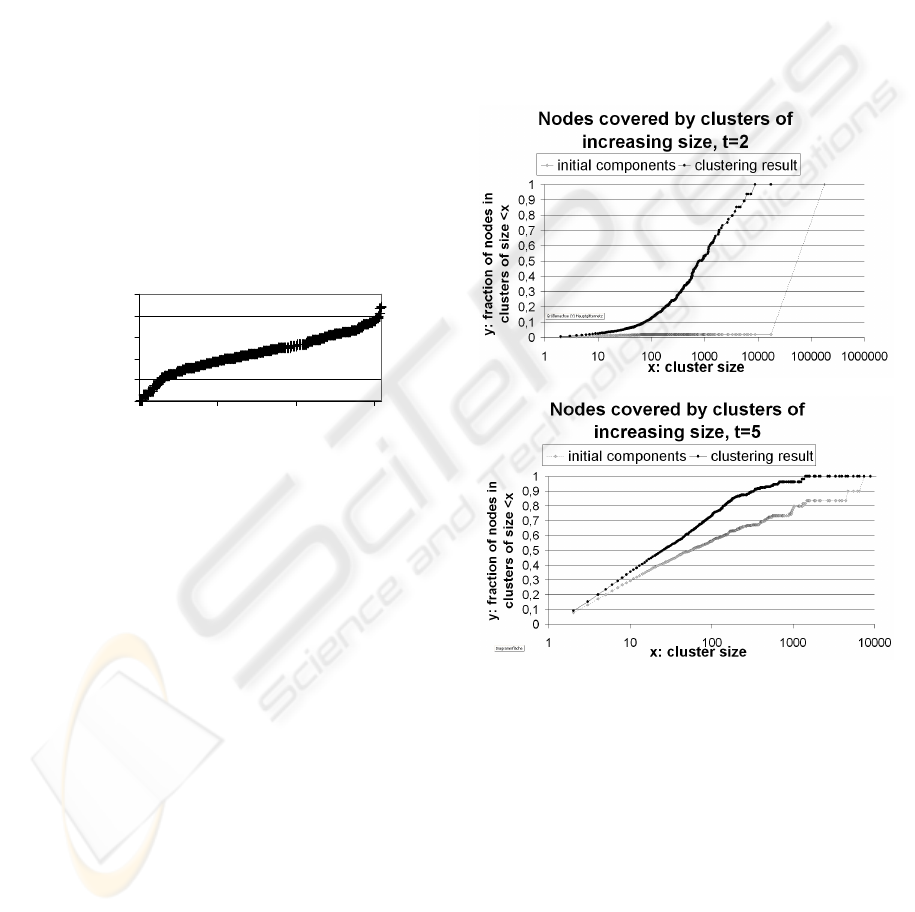
classes per document. Figure 5 gives an impression
of how the sizes of the classes are distributed by
drawing the size for each class.
Figure 5: class distribution in the dpa 2000 corpus.
The graph resulting from the matrix DD
T
as
described in the background section is constructed
by drawing an edge between two nodes (documents)
iff they have low frequency words in common. The
edge weight is the number of words in common. For
handling documents of differing sizes, it might be
useful to weight the edges by the inverse lengths of
the involved documents. We decided, however, not
to do so because the lengths of ticker news is more
or less uniform.
The lower the edge weight is, the less related the
documents are. By applying a filter on the graph that
cuts edges with weights lower than some threshold t,
noise is reduced and the graph is cut into more and
more components as the threshold increases. The
smaller the component, the more likely it will
contain similar documents, having lots of low
frequency terms in common and providing high
quality input data for a clustering step. The
drawback of increasing the threshold is a reduction
in coverage: more and more single nodes without
edges arise, which are not interesting in graph
clustering and are therefore excluded.
First we measured the influence of the filter
threshold value t on the component distribution. It
turned out that setting t = 2 yielded one very large
component and some much smaller components, For
t = 5 we observe more and smaller components, the
effect is even stronger for t = 10. Then, we were
interested in how the picture changes if we look at
the CW clusters instead of components. In Figure 6,
the cumulative fraction of nodes per cluster size is
depicted for components and clusters for the
different settings of t.
Figure 6: cumulative fraction of nodes per cluster size for
components (connected sub-graphs) and CW clusters for
different settings of t. The sizes of the graphs: 180430
(t=2), 82943 (t=5) and 36583 (t=10) nodes. The proportion
of nodes in clusters of size <3 never exceeded 22%.
It can be observed that the noisier the graph, the
stronger is the effect of CW. In the case of t=2, a
huge component was cut apart into many, much
smaller clusters, whereas in the case of t=10, the
cluster sizes did not differ considerably from the
components sizes.
Apart from the structural effects, the quality of
the clustering was examined. The cluster purity (CP)
was measured on the clustering results as well on the
Classes in the dpa corpus
1
10
100
1000
10000
100000
0 100 200 300
class number ordered by size
number of
documents
WEBIST 2007 - International Conference on Web Information Systems and Technologies
134
components in order to find out how much is gained
by clustering as compared to component discovery.
Table 2 summarizes the results.
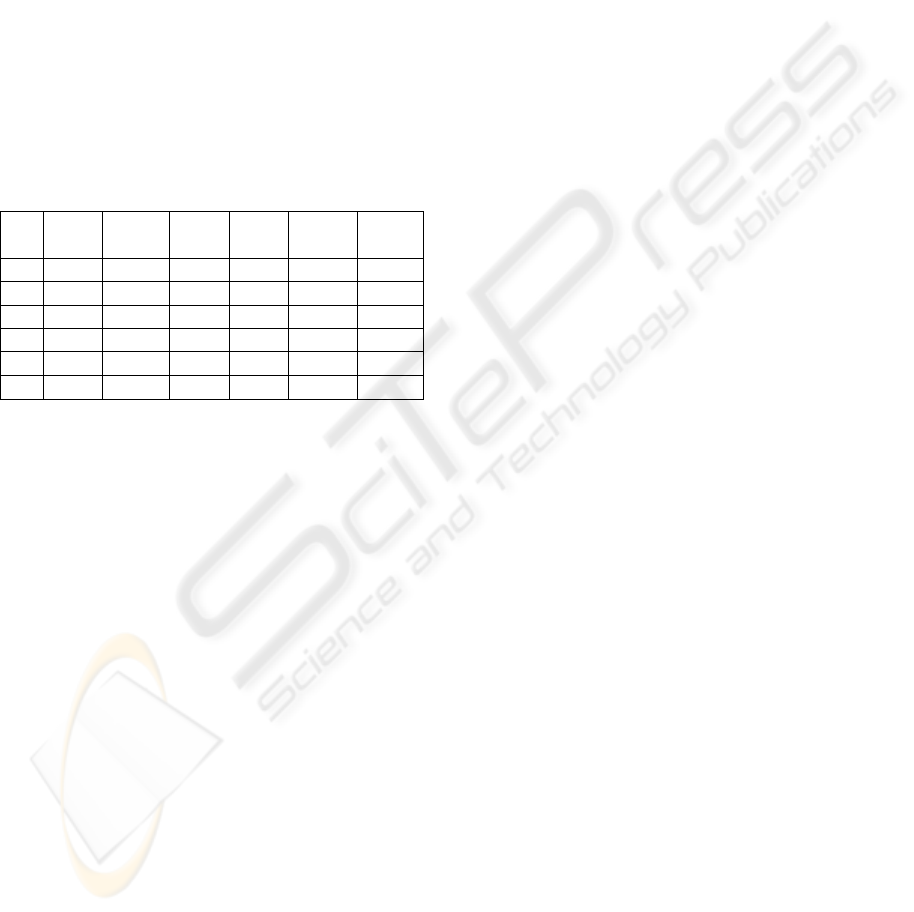
Almost in any case, CW clustering improves the
cluster purity compared to components. The lower
the threshold t, the worse are the results in general,
and the larger is the improvement, especially when
breaking very large components into smaller
clusters. It is possible to obtain very high cluster
purity values by simply increasing t, but at the cost
of reducing coverage significantly. A typical
precision/recall trade off arises.
The excellent clustering results in terms of purity
suggest that common low frequency terms is an
adequate distance measure for documents.
Table 2: cluster purity of components (comp) and CW
clustering for different cluster/component sizes, CP values
in %.
t cov.
CW
/comp
all
size
1-10
size
11-100
size
101-
2 89.28 comp 14.46 80.67 57.67 13.89
2 89.28 CW 44.71 77.91 58.02 42.73
5 41.04 comp 69.17 93.88 80.88 38.06
5 41.04 CW 90.31 93.98 85.57 90.39
10 18.10 comp 95.90 97.63 93.09 89.28
10 18.10 CW 97.23 97.67 95.60 97.76
4 CONCLUSION
We introduce two similarity measures on (web)
documents, one using co-occurrences of URLs and
another using common low frequency words. Data
sources for both are available to standard web search
engines. The collection is represented as a graph,
which we further cluster with the Chinese Whispers
algorithm. Manual examination on URLs and
comparison to pre-classified labels on low frequency
terms suggest that both measures are able to capture
(web) document similarity.
Further work will include experiments on a
larger subset of the web. For our methods of co-
occurrence calculation and graph clustering scale
well, we do not expect to run into calculation time
restrictions even for very large graphs.
Another issue is to examine to what extent the
two similarity measures group the same documents
together and in what aspects they differ. Knowledge
about this can give rise to a combined measure.
REFERENCES
C. Biemann 2006. Chinese Whispers - an Efficient Graph
Clustering Algorithm and its Application to Natural
Language Processing Problems. Proceedings of the
HLT-NAACL-06 Workshop on Textgraphs-06, New
York, USA
S. Brin and L. Page, L. 1998. The anatomy of a large scale
hypertextual web search engine, Proceedings of the
7th WWW conference / Computer Networks 30(1-7)
A. Broder, R. Kumar, F. Maghoul, P. Raghavan, S.
Rajagopalan, R. Stata, A. Tomkins and J. Wiener.
2000. Graph structure in the web. Proceedings of the
9th WWW conference, Amsterdam, Netherlands
S. Chakrabarti, B.E. Dom, D. Gibson, J. Kleinberg, R.
Kumar, P. Raghavan, S. Rajagopalan, A. Tomkins.
1999. Mining the Link Structure of the World Wide
Web. IEEE Computer 32(8), pp. 60-67
G.W. Flake, S. Lawrence and C.L. Giles. 2000. Efficient
Identification of web communities. KDD 2000
D. Gibson, J. Kleinberg and P. Raghavan. 1998. Inferring
web communities from link topology. In Proceedings
of the 9th ACM Conference on Hypertext and
Hypermedia (HYPER-98), ACM Press, New York
X. He, H. Zha, C. Ding, and H. Simon. 2001. Web
document clustering using hyperlink structures, Tech.
Rep. CSE-01-006, Department of Computer Science
and Engineering, Pennsylvania State University
G. Heyer, M. Läuter, U. Quasthoff, T. Wittig and C. Wolff.
2001. Learning Relations using Collocations. In: Proc.
IJCAI Workshop on Ontology Learning, Seattle/WA
G. Heyer and U. Quasthoff. 2004. Calculating
Communities by Link Analysis of URLs. Proceedings
of IICS-04, Guadalajara, Mexico pp. 151-156
S. Kirkpatrick, C.D. Gelatt and M.P. Vecchi. 1983.
Optimization By Simulated Annealing, Science 220
B. Krenn and S. Evert. 2001. Can we do better than
frequency? A case study on extracting PP-verb
collocations. Proceedings of the ACL-2001 Workshop
on Collocations, Toulouse, France
M. Meilă. 2002. Comparing clusters. Technical Report
418, Department of Statistics, University of
Washington
SIMILARITY OF DOCUMENTS AND DOCUMENT COLLECTIONS USING ATTRIBUTES WITH LOW NOISE
135
