
A TWO-STAGED APPROACH FOR ASSESSING
FOR THE QUALITY OF INTERNET SURVEY DATA
Chun-Hung Cheng
Dept of Systems Engineering & Engineering Management, The Chinese University of Hong Kong, Hong Kong
Chon-Huat Goh
School of Business, Rutgers University, Camden, NJ 08102, USA
Anita Lee-Post
School of Management, University of Kentucky, Lexington, KY 40506, USA
Keywords: Internet Survey Data, Quality, TSP, genetic algorithm.
Abstract: In this work, we propose to develop a procedure to detect errors in data collected through Internet surveys.
Although several approaches have been developed, they suffer many limitations. For instance, many
approaches require prior knowledge of data and hence they need different procedures for different
applications. Others have to test a large number of parameter values and hence they are not very efficient.
To develop a procedure to overcome the limitations of existing approaches, we try to understand the nature
of this quality problem and establish its linkage to travelling salesman problem (TSP). Based on the TSP
problem structure, we propose to develop a two-staged approach based on a genetic algorithm to help ensure
the quality of Internet survey data.
1 INTRODUCTION
Surveys have been widely used in various
disciplines to understand public opinions and views.
Typically, interview over telephone and postal mail
surveys are often used. Interview over telephone is
only effective for small and simple surveys while
postal mail surveys are costly and slow. With the
ubiquitous of personal computers, and the
availability of high-speed broadband network,
Internet survey has become a reality.
With the Internet, surveys can be conducted to
reach out a large number of potential survey subjects
at very low cost. However, the subjects enter their
responses without any assistance. Although data-
type and data-range checking may be implemented
together with an electronic survey form, they are not
always effective given a diversity of survey
questions and responses. Hence, data collected
through this means may contain erroneous values.
These erroneous data must be identified to ensure
the survey quality. In this work, we shall focus on
the detection of unsystematic errors. These errors are
those that are caused by survey design faults.
There are two kinds of approaches to assessing the
quality of data. Application-dependent approaches use
knowledge of data and, therefore, require different
quality-checking procedures for different survey
applications. On the other hand, application-
independent approaches do not need any prior
knowledge of data and provide one general quality-
checking procedure for all applications. The flexibility
and generalisability of application-independent
approaches make them more appealing than the
application-dependent approaches. In this work, we
shall also focus on application-independent
approaches.
Currently, application-independent approaches use
clustering analysis techniques. Clustering analysis
gathers data records into groups or clusters based on
their field values. Similar data records occupy the
same group while dissimilar records do not coexist in
the same group. Records, whose field values make
77
Cheng C., Goh C. and Lee-Post A. (2007).
A TWO-STAGED APPROACH FOR ASSESSING FOR THE QUALITY OF INTERNET SURVEY DATA.
In Proceedings of the Third International Conference on Web Information Systems and Technologies - Society, e-Business and e-Government /
e-Learning, pages 77-83
DOI: 10.5220/0001264200770083
Copyright
c
SciTePress
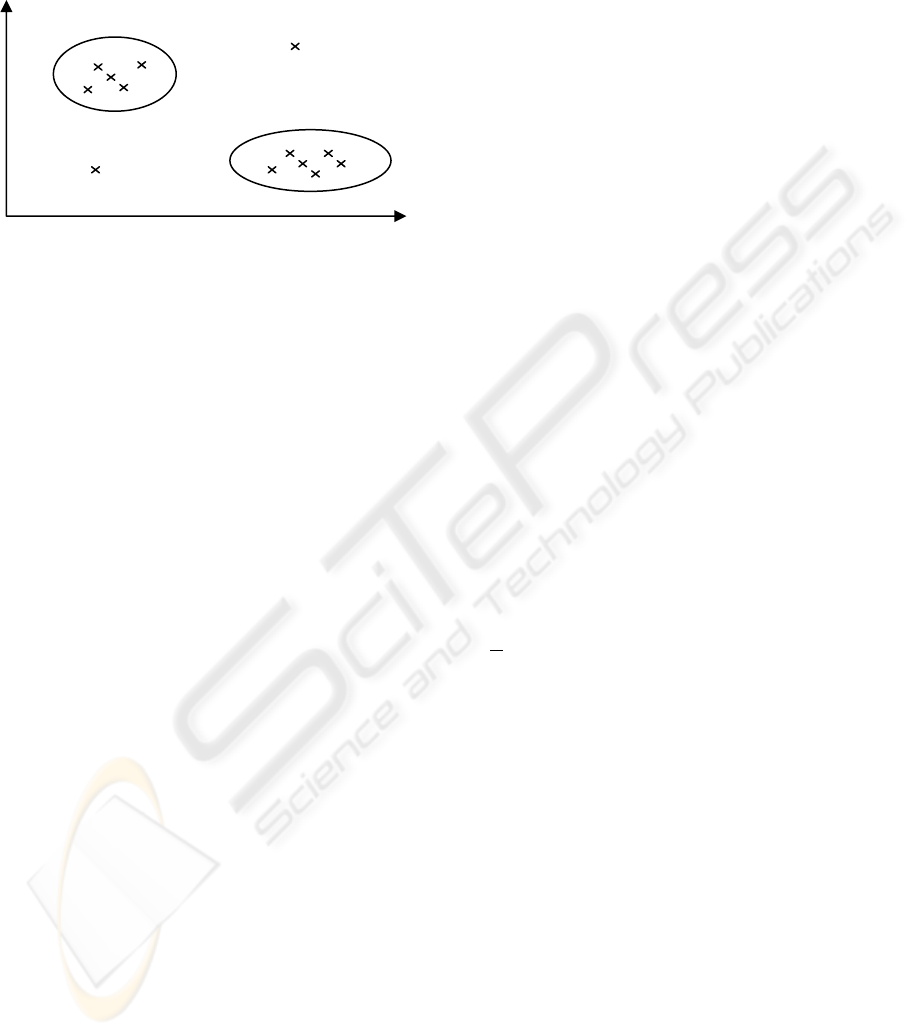
them significantly different from all others, may not
find themselves related to any other group members at
all (see Figure 1). They are called outliers (Storer and
Eastman, 1990).
Figure 1: Examples of outliers.
In this work, we apply a quality-checking
technique for data collected through Internet surveys.
The new approach provides many advantages over
current approaches.
• Unlike some current approaches, our
approach does not require knowledge of data.
Therefore, this approach is applicable to
many different Internet survey applications.
• Many clustering approaches, including
ours, require the user to test the clustering
algorithms with different parameter values.
However, we will show that our approach
significantly cuts down on the search and
evaluation of a number of parameter values
and, therefore, is more efficient than other
approaches.
• Many current approaches do not specify
systematic ways to choose the best
clustering result among many candidate
solutions. Our approach applies a selection
criterion to systematically evaluate the
clustering of a sample data in order to best
separate the outliers from similar records in
a group.
2 LITERATURE REVIEW
Although the classical database literature considers
errors in a database a serious problem (e.g., Felligi and
Holt, 1976 and Naus et al., 1972), few studies propose
ways to deal with the problem. There are two kinds of
quality-checking approaches: application-dependent
and application-independent approaches.
2.1 Application-Dependent Methods
Application-dependent approaches such as those by
Freund and Hartley (1967), Naus et al. (1972), and
Felligi and Holt (1976) are all statistical-based. In
detecting errors in a database, these approaches require
knowledge of the data. Using these approaches,
software developers may have to develop different
programs for different database applications.
2.2 Application-Independent Methods
All application-independent approaches use clustering
analysis techniques. Lee et al. (1978) first applied a
clustering approach. They defined a distance function
to measure the difference between two records. Based
on a distance matrix, they found the shortest path
between a pair of records. Since the determination of
the shortest path is an NP-complete problem (Storer
and Eastman, 1990), the shortest spanning path
algorithm (Slagle et al., 1975) is used to find an
approximate solution. A link between two records that
is longer than the pre-specified threshold value will be
broken. Records whose distances are less than the
threshold value are similar and are placed in the same
group. A record with no similar partners is an outlier.
Storer and Eastman (1990) proposed three related
clustering approaches. They used the same distance
function as defined by Lee et al. (1978). The first
approach is called the leader algorithm (Hartigan,
1975). The leader algorithm clusters M records into K
groups, where M and K are positive integer values and
M >
K. It assumes that the distance function between
two records and the threshold value for group
membership are available. The first record is a leader
for the first group. A record is assigned to an existing
group if its distance from the group leader is less than
the threshold value. It becomes a new leader for a new
group if its distance from every existing leader is more
than the threshold value.
The second approach is a modification of the
leader algorithm that we refer to as an average record
leader algorithm. This modified algorithm uses the
average record instead of the first record as an initial
leader. Therefore, the algorithm can generate a
solution independent of record order. On each pass, a
record that is furthest from its group leader becomes a
leader for a new group. If the algorithm were to
produce K groups, it requires K passes through the
data.
The third approach is another modification of the
leader algorithm. Storer and Eastman (1990) call it the
greatest distance algorithm. The greatest distance
algorithm uses a different criterion for selecting new
outlier
outlier
WEBIST 2007 - International Conference on Web Information Systems and Technologies
78

group leaders. First, Storer and Eastman (1990) define
a non-deviant cluster as one that has more than one
percent of all records. A new leader is the record that
is furthest from a leader of a non-deviant cluster and is
greater than the average record distance from its
cluster leader.
Many existing approaches use a non-hierarchical
approach. Cheng et al. (2006) proposed the use of
hierarchical clustering. They demonstrated that the use
of hierarchical reduces the number of parameter values
to test for data quality.
2.3 Limitations of Current Methods
Table 1 summarizes the parameters that need to be
pre-defined for all four approaches. The shortest
spanning path algorithm requires pre-specifying a
threshold value. Since there is no upper bound on the
value of the distance function, there are many possible
threshold values to test before a desirable value is
found. Worse yet, there is no systematic way to find
the desirable value. The search for the most desirable
parameter value may be time-consuming. A smaller
threshold value than the desirable may result in a
larger number of groups and possibly a larger number
of outliers that are actually error free. A larger
threshold value than the desirable may lead to a fewer
number of groups but it may group erroneous records
into existing groups along with correct records.
Table 1: Required parameters for different approaches.
Approach
Pre-specified
threshold value
Pre-specified
number of groups
SSP Yes No
LA Yes Yes
ARLA No Yes
GDA No Yes
HC Yes No
Note
SSP shortest spanning path algorithm
LA leader algorithm
ARLA average record leader algorithm
GDA greatest distance algorithm
HC hierarchical clustering
The leader algorithm also uses a pre-specified
threshold value and the number of groups to be
formed. It is difficult for the user to come up with the
desirable values for both the threshold value and the
number of groups to be formed as the number of
possible combinations for each value is very large.
The desirable values can be found only after an
extensive search. The remaining two algorithms need
the pre-specified number of groups. A larger number
of groups than desirable produces many outliers
containing no errors while a smaller number misses
some outliers containing errors since we do not have
prior knowledge of the data, we have to test the
algorithms with many parameter values.
Neither Lee et al. (1978) nor Storer and Eastman
(1990) discuss how to find the desirable parameter
values among many possible values. Moreover, they
do not specify any systematic methods to choose the
desirable clustering result among many candidates that
are generated from a given set of parameter values.
To systematically generate parameter values,
Cheng et al. (2006) propose the use of a dendogram.
Their method significantly reduces the number of
threshold values to test. However, Cheng et al. (2006)
do not provide any justification for the use of a
hierarchical approach. In this work, we try to provide a
justification for our approach.
3 TSP & DATA QUALITY
In this section, we try to establish the linkage between
data quality problem and travelling salesman problem
(TSP). Based TSP characteristics, we develop an
algorithm to deal with data quality problem.
A data record, R
i
, may be represented by a
vector. That is, R
i
= (x
i1
,x
i2
,...,x
iN
), where x
ip
is the
value of the pth field of R
i
, for p = 1,2,….N and i =
1,2,…,M. A record can be classified into one of the
three types (Lee et al., 1978).
Type I records: All field values in this type of
record are numerical. The distance between two
records R
i
and R
j
is defined as:
N / )
x
,
x
c( =
d
jpip
N
1=p
ij
∑
,
where
S
/ |
x
-
x
| = )
x
,
x
c(
pjpipjpip
, and
|
x
-
x
| =
S
ip
Mi1
ipMi1p
min
max
≤≤
≤≤
(1)
For example, if R
i
= (4.5, 3.1, 0.9, -2.1), R
j
= (4.1,
2.1, 0.3, -1.1), S
1
= 5.0, S
2
= 4.0, S
3
= 2.0, and S
4
= 2.1,
then d
ij
= 0.2765.
Type II records: All field values in this type of
record are non-numerical. The distance between two
records R
i
and R
j
is defined as:
A TWO-STAGED APPROACH FOR ASSESSING FOR THE QUALITY OF INTERNET SURVEY DATA
79

N / )
x
,
x
c( =
d
jpip
N
1=p
ij
∑
where
otherwise. 0
x
x
if 1
{ =)
x
,
x
c(
jpip
jpip
≠
(2)
Type III records: Fields in a type III record may
assume either numerical or non-numerical values. The
distance between two records R
i
and R
j
is defined as:
N / )
x
,
x
c( =
d
jpip
N
1=p
ij
∑
where
for a numerical field p,
S
/ |
x
-
x
| = )
x
,
x
c(
pjpipjpip
, and
|
x
-
x
| =
S
ip
Mi1
ipMi1p
min
max
≤≤
≤≤
or for a non-numerical field p,
otherwise. 0
x
x
if 1
{ =)
x
,
x
c(
jpip
jpip
≠
(3)
For example, if
R
i
= (black, black, 3.1, 5.0), R
j
=
(black, white, 2.1, 5.1),
S
3
= 4.0, and S
4
= 5.5, then d
ij
= 0.3170.
Lee et al. (1978), and Storer and Eastman (1990)
use Euclidean distances or city block distances for
type I records, and hamming distances for type II
records. There is no upper bound on the value of
either distance function. Therefore there are a large
number of possible threshold values.
To illustrate the new distance function, consider a
simple example with type III records. Table 1 is a
personnel database for a hypothetical company.
Matrix (4) shows the distance value between a
pair of records. Note that in the matrix,
d
ii
= 0 and d
ij
= d
ji
. A small distance value between two records
implies that they are similar, while a large distance
value means that they are different.
An erroneous record, being so different from
other records, has large distance values with other
records. When records are clustered into groups,
erroneous records (i.e., outliers) will not be
associated with other records.
Table 2: Example.
Record POS
1
EDU
2
MON
3
SAL
4
1 0 0 15 20,000
2 1 1 10 20,000
3 0 0 11 20,000
4 1 1 35 60,000
5 1 0 17 30,000
6 0 1 17 30,000
7 0 0 16 20,000
8 1 1 33 65,000
9 1 0 16 46,000
10 0 0 50 80,000
Note:
1. POS = 1, when an employee has a middle management
position;
and POS = 0, when an employee has a supervisor position.
2. EDU = 1, when an employee has a college degree;
and EDU = 0, when an employee does not have a degree.
3. MON is the number of months an employee has worked for
the company.
4. SAL is the current salary of an employee.
Records
1 2 3 4 5 6 7 8 9 10
┌─ ─┐
1 │.00.52.02.73.29.29.01.73.34.36 │
2 │.52.00.51.25.32.32.53.26.36.89 │
R 3 │.02.51.00.74.31.31.03.75.36.89 │
e 4 │.73.25.74.00.43.43.72.03.39.64 │
c 5 │.29.32.31.43.00.50.29.44.06.57 │ (4)
o 6 │.29.32.31.43.50.00.29.44.56.57 │
r 7 │.01.53.03.72.29.29.00.73.33.36 │
d 8 │.73.26.75.03.44.44.73.00.39.63 │
s 9 │.34.36.36.39.06.56.33.39.00.53 │
10 │.36.89.89.64.57.57.36.63.53.00 │
└─ ─┘
Records
1 3 7 4 8 5 9 2 6 10
┌─ ─┐
1 │.00.02.01.73.73.29.34.52.29.36 │
R 3 │.02.00.03.74.75.31.36.51.31.89 │
e 7 │.01.03.00.72.73.29.33.53.29.36 │
c 4 │.73.74.72.00.03.43.39.25.43.64 │
o 8 │.73.75.73.03.00.44.39.26.44.63 │
r 5 │.29.31.29.43.44.00.06.32.50.57 │ (5)
d 9 │.34.36.33.39.39.06.00.36.56.53 │
s 2 │.52.51.53.25.26.32.36.00.32.89 │
6 │.29.31.29.43.44.50.56.32.00.57 │
10 │.36.89.36.64.63.57.53.89.57.00 │
└─ ─┘
When we rearrange rows and columns in Matrix
(4) with the purpose of putting similar records
together, we may get one possible solution shown in
Matrix (5). It is not difficult to observe that there are
three clusters: {1,3,7}, {4,8}, {5,9}. It is also
WEBIST 2007 - International Conference on Web Information Systems and Technologies
80

apparent that Records 2, 6, and 10 are not associated
with other records in any way. Therefore, they are
the outliers.
Suppose we let a record in the row of Matrix (4)
be a city in a TSP. The distance value between two
records is the distance between two cities. We need
to find a sequence of the cities for the row such that
cities closer to each other will be placed closer
together. Hence, this sequencing problem can be
formulated as a TSP (Lenstra and Kan Rinnooy,
1975). Many approaches may be used to solve this
TSP. In this paper, we attempt to use genetic
algorithm.
4 OUR APPROACH
Our approach consists of two phases: obtaining a
sequence of sample data records, and classifying
records into groups. The first phase uses a genetic
algorithm and the second phase adopts a
classification criterion for grouping. An illustrative
example is used to show the computational process
of our approach.
4.1 Genetic Algorithm
The genetic algorithm approach was developed by
John Holland (1975). This approach is a subset of
evolutionary algorithms that model biological
processes to optimize highly complex cost functions.
It allows a population composed of many individuals
to evolve under specified selection rules to a state
that maximizes the “fitness” (i.e., minimizes the cost
function).
Clearly, the large population of solutions and
simultaneously searching for better solutions give the
genetic algorithm its power. Some of the advantages
of a genetic algorithm are that it (Haupt and Haupt,
1998):
• Optimizes with continuous or discrete
parameters.
• Does not require derivative information.
• Simultaneously searches from a wide
sampling of the cost surface.
• Deals with a large number of parameters.
• Is well suited for parallel computers.
• Optimizes parameters with extremely
complex cost surfaces; it can jump out of a
local minimum.
• Provides a list of optimum parameters, not
just a single solution.
• May encode the parameters so that the
optimization is done with the encoded
parameters, and
• Works with numerically generated data,
experimental data, or analytical functions.
4.1.1 Representation
A chromosome represents an individual. For example,
x
1
= (1011001) and x
2
= (0111011) are two distinct
individuals. Offspring (new individuals) are generated
by crossover. A crossover point will be selected
randomly. The parent chromosomes will be split at the
chosen point and the segments of those chromosomes
will be exchanged. Using this basic crossover operator,
two fit individuals may combine their good traits and
make fitter offspring.
Nevertheless, the simple representation scheme
described above is not suitable for TSP. Instead, three
vector representations for TSP were proposed
(Michalewicz, 1999): adjacency, ordinal, and path.
Each representation has its own genetic operators.
Among the three representations, the path
representation is the most natural representation of a
tour. For example, a tour 3 – 4 – 1 – 6 – 5 – 2 – 7 is
simply represented by (3 4 1 6 5 2 7). Our proposed
approach uses this representation.
4.1.2 Initialization
Initialization involves generating of possible solutions
to the problem. The initial population may be
generated randomly or with the use of a heuristic. In
our approach, the initial population is generated
randomly.
4.1.3 Fitness Function
Fitness function is used to evaluate the value of the
individuals within the population. According to the
fitness value scored, the individual is selected as a
parent to produce offspring in the next generation or
is selected to disappear in the next generation.
In TSP, the total distance is calculated as the
distance travelled from the starting city to the last
city plus the distance from the last city to the starting
city. In our data auditing problem, returning to the
starting city (i.e., record) does not have any practical
meanings. Therefore, the problem is simplified to
the associated Hamiltonian Path Problem (HPP). As
the first and last records need not be connected, we
may calculate the total distance of a path instead of a
tour in our fitness functions.
Let
ρ be the permutations of records along the
row of the initial matrix. For a sequence of cities
A TWO-STAGED APPROACH FOR ASSESSING FOR THE QUALITY OF INTERNET SURVEY DATA
81

(i.e., records): (1 3 7 4 8 5 9 2 6 10),
ρ(2) = 3 and
ρ(7) = 9. The proposed approach converts the initial
sequence of records (specified by the initial matrix)
to a new sequence that minimizes the following
fitness function:
∑
−
=
+
1
1
)1()(
n
i
ii
d
ρρ
where
n = number of records (i.e., rows
or columns).
(6)
4.1.4 Parent Selection
Parent selection is a process that allocates reproductive
opportunities to individuals. There are several
selection schemes: roulette wheel selection, scaling
techniques, ranking, etc. (Goldberg, 1989).
As the process continues, the variation in fitness
range will be reduced. This often leads to the problem
of premature convergence in which a few super-fit
individuals receive high reproductive trials and rapidly
dominate the population. If such individuals
correspond to local optima, the search will be trapped
like hill climbing.
In our approach, fitness ranking is used to solve the
problem of premature convergence (Whitley, 1989).
Individuals are sorted according to their fitness values,
the number of reproductive trails are then allocated
according to their rank.
4.1.5 Crossover
Several TSP crossover operators are defined: partially-
mapped (PMX), order (OX), cycle (CX), and edge
recombination (ER) crossover. Whitley et al. (1989)
found that ER is the most efficient crossover operator
for TSP. Starkweather et al. (1991) proposed an
enhancement to ER and find it more efficient than the
original operator.
In our approach, we use the EER operator. Since
the EER operator incorporates random selection to a
break tie, this mechanism creates an effect similar to
mutation. In our approach, we do not use any mutation
operator.
4.1.6 Mutation
Mutation is applied to each child individually after
crossover according to the mutation rate. It provides a
small amount of random search and helps ensure that
no point in the search space has a zero probability of
being examined. Several mutation operations have
been suggested by Michalewicz (1999). We do not
plan to use mutation operation. This is because the
crossover operator used incorporates a random
selection in completing a legal permutation and the
effect is similar to a mutation.
4.1.7 Replacement & Termination Criterion
In each generation, only two individuals are replaced.
In other words, parents and offspring may co-exist in
the population. The genetic process is repeated until a
termination criterion is met. In this case, we use a pre-
specified maximum number of generations as a
termination criterion.
4.2 Classification Criteria
We adopt the classification criteria developed by
Stanfel (1983) to classify data records into groups.
These classification criteria seek to minimize the
average distance within groups and maximize the
average distance between groups. Minimizing the
average distance within groups will put similar data
records into the same groups. At the same time,
maximizing the average distance between groups
will put dissimilar data records into different groups.
To formulate the chosen selection criterion, we
define:
⎩
⎨
⎧
=
ij
Y
otherwise
groupsametheinare
jandirecordsif
0
1
(7)
The expression for the average distance
within
groups is given as:
()
()
∑∑
∑∑
−
==
−
==
−
−
1
1
1
1
1
1
M
i
M
ij
ij
M
i
M
ij
ijij
Y
Yd
(8)
While the expression for the average distance
between groups is given as:
∑∑
∑∑
−
==
−
==
1
1
1
1
M
i
M
ij
ij
M
i
M
ij
ijij
Y
Yd
(9)
Hence, in order to achieve the objective of
maximizing the homogeneity of records within
groups as well as the heterogeneity of records
between groups, the difference between the average
()
()
∑∑
∑∑
∑∑
∑∑
−
==
−
==
−
==
−
==
−
−
−
1
1
1
1
1
1
1
1
1
1
M
i
M
ij
ij
M
i
M
ij
ijij
M
i
M
ij
ij
M
i
M
ij
ijij
Y
Yd
Y
Yd
(10)
WEBIST 2007 - International Conference on Web Information Systems and Technologies
82

distance within groups and the average distance
between groups is minimized as shown in criterion
(10):
4.3 Illustrative Example
Phase one of the proposed approach takes Matrix (4)
as input and rearranges its rows and columns to obtain
a sequence of records. As shown in Matrix (5), the
sequence produced is (1 3 7 4 8 5 9 2 6 10). Phase two
takes the sequence and classifies data records into
groups to minimize criterion (10). As a result, we find
this grouping result: {1,3,7}, {4,8}, {5,9}, {2}, {6},
{10}.
Unlike most of the existing methods, our
approach does not require any parameters. The
generation of a sequence of data records and
assignment of data records into groups are all
automatic.
Based on the grouping result, we conclude that
records 2, 6, and 10 are outliers. A survey
administrator will examine these outliers and
determine whether they contain any error or not. Our
example postulates that an employee with a college
degree, in a middle management position, and with
more years of seniority should have higher current
salary. On the other hand, an employee without a
college degree, in a supervisor position, and with
fewer years of seniority should have a lower current
salary. However, record 2 indicates that the employee
has a college degree and in a middle management
level but has relatively low current salary. Record 10
indicates that the employee has exceptionally high
current salary for his/her position (i.e., supervisor) and
education (i.e., does not have a degree). Record 6 may
(or may not) contain errors.
5 CONCLUSION
In this work, we discussed the use of clustering
algorithms for assessing the quality of Internet
survey data. Limitations of some existing
approaches were identified. To address these
limitations, we first examined the nature of the
quality problem of Internet surveys and then
established that the problem is equivalent to a TSP.
Our proposed approach exploits the underlying TSP
structure. Although many algorithms may be used
for the TSP-quality problem, we adopt genetic
algorithm for computational efficiency and
advantage. Compared to the existing approaches, our
approach provides a better understanding of the
nature of the Internet survey problem and seems to
offer improvement potential. However, the quality
model must be implemented and tested to verify our
claims.
REFERENCES
Anderberg, M.R., 1993. Cluster analysis for applications,
Academic Press, New York.
Cheng, C.H., Goh, C.H., and Lee-Post, A., 2006. Data
auditing by hierarchical clustering, Internatinal
Journal of Applied Management & Technology, Vol.4,
No.1, pp. 153-163.
Felligi, I.P. and Holt, D., 1976. A systematic approach to
automatic editing and imputation, Journal of American
Statistics Assocication, Vol. 71, pp. 17-35.
Freund, R.J. and Hartley, H.O., 1967. A procedure for
automatic data editing, J Journal of American Statistics
Assocication, Vol. 62, pp. 341-352.
Goldberg, D.E., 1989. Genetic Algorithms in Search,
Optimization and Machine Learning. Massachusetts:
Addison Wesley.
Hartigan, J.A., 1975. Clustering Algorithms, McGraw-Hill,
New York.
Haupt, R.L. and Haupt, S.E., 1998. Practical Genetic
Algorithms. New York: John Wiley & Sons.
Holland, J.H., 1975. Adaptation in Natural and Artificial
Systems. Michigan: Michigan Press.
Lee, R.C., Slagle, J.R., and Mong, C.T., 1978. Towards
automatic auditing of records, IEEE Transactions on
Software Engineering., Vol. SE-4, pp. 441-448.
Lenstra, J.K. and Kan Rinnooy, A.H.G., 1975. Some
Simple Applications of the Traveling Salesman
Problem, Operations Research Quarterly, Vol. 26, pp.
717-733.
Michalewicz, Z., 1999. Genetic Algorithms + Data
Structures = Evolution Programs. Third, Revised and
Extended Edition, Hong Kong: Springer.
Naus, J.I., Johnson, T.G., and Montalvo, R., 1972. A
probabilistic model for identifying errors and data
editing, Journal of American Statistics Assocication,
Vol. 67, pp. 943-950.
Slagle, J.R., Chang, C.L., and Heller, S.R., 1975. A
clustering and data-reorganizing algorithm, IEEE
Transactions on Systems, Man, and Cybernetics, Vol.
SMC-5, pp. 125-128.
Stanfel, L.E., 1983. Applications of clustering to information
system design, Information Processing & Management.,
Vol. 19, pp. 37-50.
Starkweather, T., McDaniel, S., Mathias, K., Whitley, D.,
and Whitley, C., 1991. A Comparison of Genetic
Sequencing Operators, Proceedings of the fourth
International Conference on. Genetic Algorithms and
their Applications, pp.69-76
Storer, W.F. and Eastman, C.M., 1990. Some Experiments in
the use of clustering for data validation, Information
Systems., Vol. 15, pp. 537-542.
Whitley, D., 1989. The Genitor Algorithm and Selection
Pressure: Why Rank-based Allocation of Reproductive
Trials Is Best, Proeedings of. the Third International
Conference on Genetic Algorithms, pp.116-121.
A TWO-STAGED APPROACH FOR ASSESSING FOR THE QUALITY OF INTERNET SURVEY DATA
83
