
SECURITY RISK ANALYSIS IN WEB APPLICATION DESIGN
Rattikorn Hewett, Phongphun Kijsanayothin
Department of Computer Science, Texas Tech University
Meinhard Peters
Department of Industrial Engineering Technology, The University of Johannesburg
Keywords:
Risk assessment, computer security, software design, web-based systems.
Abstract:
Web-based information systems play increasingly important roles in providing functions and business services
for many organizations. Because of their ubiquitous natures dealing with a huge and diverse population of
users, web applications must be tolerant to errors, adverse interactions and malicious attacks. The ability to
quickly estimate security risks early in the system development life cycle can be beneficial in making various
decisions. This is particularly crucial for large and complex web applications that are asset-critical and evolve
rapidly through long life cycles. This paper presents a systematic approach for the automated assessment of
security risks, at the design stage, of web-based information systems. The approach combines risk concepts
in reliability engineering with heuristics using characteristics of software and hardware deployment design to
estimate security risks of the system to be developed. It provides a simple early estimate of security risks that
can help locate high-risk software components. We discuss limitations of the approach and give an illustration
in an industrial engineering and business-to-business domain using a case study of a web-based material
requirements planning system for a manufacturing enterprise.
1 INTRODUCTION
The scope and complexity of web applications have
grown significantly from small-scale information dis-
semination to large-scale sophisticated systems that
drive services, collaboration and business on a global
scale. Unlike conventional software systems, web-
based systems grow and change rapidly. They also
tend to be living systems having long life cycles with
no specific releases and thus, require continuous de-
velopment and maintenance (Ginige and Murugesan,
2001). Designing web applications involves not only
technical but also social and political factors of the
system to be built. Poorly developed web applica-
tions that continue to expand could cause many se-
rious consequences. Because of their ubiquitous na-
tures that deal with a huge and diverse population of
users, web applications must be tolerant to errors, ad-
verse interactions and malicious attacks. It is desir-
able to have mechanism that can quickly estimate the
security risks of such systems at an early stage of their
life cycles.
Various techniques and guidelines to security risk
analysis are available (Landoll, 2006; Stoneburner
et al., 2002) and activities to increase security assur-
ance of software are integrated throughout the soft-
ware development life cycle (e.g., security require-
ments, code analysis, security and penetration test-
ing). However, most security risk assessments of soft-
ware systems are done at a system level after the sys-
tems have been implemented.
Software vulnerabilities can occur in codes (e.g.,
buffer overflow, SQL injection) and designs (e.g.,
internal controls that attackers can compromise).
They can even exist in components that are not in-
volved with security procedures. As many soft ware-
intensive infrastructure systems increas-ingly utilize
COTS (Commercial Off-The-Shelf) components for
rapid application development, ability to analyze se-
curity risks at a software component level becomes
essential.
As web applications are implemented on standard
platforms, they inherit similar security weaknesses
that are published and available publicly (Bugtrag,
28
Hewett R., Kijsanayothin P. and Peters M. (2007).
SECURITY RISK ANALYSIS IN WEB APPLICATION DESIGN.
In Proceedings of the Third International Conference on Web Information Systems and Technologies - Internet Technology, pages 28-35
DOI: 10.5220/0001266700280035
Copyright
c
SciTePress

2006). These known vulnerability databases are used
widely as parts of basic principles for guidelines, stan-
dards, and vulnerability scanning tools such as Nes-
sus (Nessus, 2006). Currently, like other informa-
tion systems, most web-based systems rely on stan-
dard checklists, firewall rules and scanners for system
security risk testing. One drawback of these tools is
their lack of ability to assess vulnerabilities specific
to custom web applications (Walt, 2002).
Most traditional risk analysis techniques are dif-
ficult to apply directly to modern software design, as
they do not necessarily address potential vulnerabili-
ties and threats at a component or environment level
(Verdon and McGraw, 2004). Particularly, web-based
information systems are designed on multi-tier archi-
tectures spanning over multiple boundaries of trust.
A vulnerability of a component depends on both its
platform (e.g., J2EE on Tomcat/Apache/Linux, C# on
a Windows .NET server) and environment (e.g., ex-
posed network such as LAN versus secure DMZ).
To adapt risk methodology to web application de-
sign, security risk analysis should consider risk fac-
tors from different design levels including software
components, hardware platforms and network envi-
ronments.
Risk analysis aims to provide some assessment of
risk to serve as a basis for decision-making to prevent,
mitigate, control and manage risks of loss. This paper
presents a systematic approach for automated security
risk assessment of a web application system from its
component-based designs. By combining risk con-
cepts in reliability engineering with heuristics using
characteristics of software design and hardware plat-
forms, the security risks of a proposed system can be
estimated. In contrast with rigorous analysis of pre-
cise security risks during the operational phase, our
approach provides a simple early estimate of security
risks that can help locate design components that are
at risk. Thus, mitigating strategies (e.g., allocating re-
sources for rigorous testing, or redesigning the high-
risk component) can follow.
Section 2 describes related work. Section 3 de-
fines relevant security terminologies and risk concepts
and describes the proposed approach. Section 4 il-
lustrates our approach to a web application in indus-
trial engineering. Conclusion and future work are dis-
cussed in Section 5.
2 RELATED WORK
Much research in web information systems is con-
cerned with techniques and methodologies for engi-
neering web-based systems effectively by adapting
principles from software engineering to web appli-
cation design and development (Barna et al., 2006;
Qiang et al., 2001; Ginige and Murugesan, 2001).
Risk methodologies have been employed to as-
sess safety and performance associated with soft-
ware systems in various application domains includ-
ing industrial engineering, business and space sci-
ence (Shahrokhi and Bernard, 2004; Cortellessa et al.,
2005; Yacoub et al., 1999). Risk methodology in-
cluding FMEA (Failure Mode and Effect Analysis)
has been applied to gain understanding about usabil-
ity of web information systems (Zhang et al., 2001).
Unlike our approach, none of these work addresses
risks in security contexts. Identifying likelihoods in
risk methodology in these web information systems
are mostly subjective rather than analytical and ob-
jective.
Our work is most similar to a methodology and
framework proposed by Yacoub et al. (Yacoub et al.,
1999). However, instead of assessing the reliability
of software components, we assess the security risks
associated with software. Thus, their risk models con-
tain different attributes than ours. Reliability risks are
estimated from the complexity of software compo-
nents whereas security risks are based on characteris-
tics of software design as well as hardware platforms
to be deployed.
3 SECURITY RISK ANALYSIS
In this section, we define basic risk analysis concepts
and relevant security elements in Section 3.1. Section
3.2 describes the proposed methodology.
3.1 Preliminaries
Risk is defined as a multiplication of the probability
of occurrence of an undesired event and its conse-
quences (ISO, 2002). Risk analysis is a process that
aims to assess, manage and communicate risk infor-
mation to assist decisionmaking. Risk assessment in-
volves identification of adverse situations (or hazards
or threats) and quantifying their risks by determining
all likelihoods of their causes and the severity of their
impacts. The risk measures obtained can assist in cost
benefit study for resource planning to prevent, elimi-
nate or mitigate these undesired situations. These are
activities of risk management. Many techniques for
risk assessment exist (e.g., FMEA, HAZOP (Hazard
and Operability), FTA (Fault Tree Analysis) (Haimes,
2004)), but they have been mainly applied to hard-
ware rather than software artifacts. Risks associated
with software (or software risks) are risks that account
SECURITY RISK ANALYSIS IN WEB APPLICATION DESIGN
29

for undesired consequences of software behaviour, in
the system in which the software is used.
Security and safety are two related perspectives
of value judgements of acceptable risks. Security is
concerned with the protection of ownerships of as-
sets and privacy, while safety is more concerned with
the protection of human lives and environments, fac-
tors that cannot be evaluatedeasily in monetary terms.
Examples also include some assets in web applica-
tions - e.g., trust and a company’s reputation. Unlike
safety, sources of security threats include malicious
(e.g., deliberate attack, code injection) as well as non-
malicious actions (e.g., natural disaster, human error,
software system failure) that may lead to a security
breach.
Security attacks, whether intentionally targeted or
not, can originate from internal and external threats
depending on the degree of exposure of assets and
how vulnerable the system is to attack. A system’s
vulnerability refers to its weakness (i.e., specific at-
tribute/environment) that makes a system more prone
to attack or makes an attack more likely to succeed.
Exploited vulnerabilities can compromise security.
In finance, risks are estimated in terms of expected
loss per year, ALE (Annualized Loss Expectancy),
which is a product of the annual rate of occurrence
and single loss expectancy. The former reflects prob-
ability, and the latter for consequences over a pe-
riod of time. In security risk analysis, risks are es-
timated from adapted ALE formulae. Basic proba-
bility factors are related to exposure degrees, vulner-
abilities and threats, whereas basic consequence fac-
tors are measured by asset values. Thus, for a given
threat/adverse action, its security risk can be roughly
estimated by:
Risk = threat × exposure× vulnerability× severity,
where threat actually measures the threat likelihood.
The first three contributes to probability measures,
whereas the last measures its consequence. In this
paper we omit threat, which can be easily integrated
into our analysis at a later stage of the design. While
the ALE concept works well in general financial and
security risks, it may not be applicable for cases like
terrorist attacks, which are rare or may never occur.
3.2 Methodology
Quantitative risk assessment methodologies, such as
the ALE-based approach, provide useful mechanisms
to facilitate risk ranking for decision-making in risk
management. However, they are often criticised for
producing results that are too general (statistic-like) to
be useful for specific decision-making, and producing
results that are not credible enough as they rely heav-
ily on subjective value assignments.
The authors’ proposed methodology given below
has two objectives: (1) to estimate security risks of
a web-based software system from its early design
configuration, and (2) to estimate probability mea-
sures more objectively. The latter is achievedby using
heuristics based on relevant design attributes (more
details later). Because web applications are typically
designed with multiple architectural layers and trust
boundaries, our risk methodology must incorporate
relevant attributes from multiple design levels (e.g.,
component, network and hardware platforms). Figure
1 shows basic steps in the methodology.
Inputs: Software design, hardware deployment design,
likelihood of each scenario. Let s
k
be the likeli-
hood of scenario k.
Outputs: Security risks of a system to be built and security
risks of each component.
1) Determine interaction rates in each scenario: For
each use case, for each scenario k, for any two com-
ponents i and j, compute I
ijk
= n
ijk
/N
ik
, where I
ijk
is
an interaction rate from i to j in k, n
ijk
is the number
of interactions from i to j in k, and N
ik
is the number
of all interactions out of i in k.
2) Determine transition rates in all scenarios: Con-
struct a dependency graph of components where com-
ponent transitions are based on interaction rates from
all scenarios. Let t
ij
be a transition rate from compo-
nents i to j. Then t
ij
=
∑
k
s
k
I
ijk
. Normalize t
ij
so that
a total sum of transition rates from each component is
one.
3) Estimate component vulnerability: By using hard-
ware deployment, determine V
i
, an estimated vulner-
ability ratio of component i. Note that a total sum
of vulnerability ratios over all system components is
one.
4) Combine likelihood estimates: Determine probabil-
ity of security breach of each component by identify-
ing all access paths to the component. For each path,
estimate the likelihood by using the transition rates
(t
ij
’s) and vulnerability ratios (V
i
’s) of components
along the path. Combine the likelihoods obtained for
each alternative path to the component.
5) Severity Analysis: Determine severity of each ad-
verse action in each component. Categorize the sever-
ity and select the worst case in each component.
6) Compute security risks: for each component and the
overall system using results obtained from 4) and 5).
Figure 1: Proposed risk methodology.
The methodology requires two inputs: a software
design and a hardware deployment design. We as-
sume that the software design is expressed in terms
of an extended activity or workflow diagram, where
the software components of the web applications and
use case actors are represented as well as activities in
use cases (Barna et al., 2006). The software design
includes all use cases, each of which may have one or
more scenarios.
WEBIST 2007 - International Conference on Web Information Systems and Technologies
30

The hardware deployment design provides infor-
mation about hardware platforms including host or
server, their attributes (e.g., services, operating envi-
ronments), and network attributes (e.g. IP addresses
for network configuration, and LAN, WAN or DMZ
for connection). Security scanning tools use this in-
formation to identify vulnerabilities of each host in
the system. The hardware deployment plan also indi-
cates software components designated to use, or run
on, corresponding hosts. Examples of a workflow di-
agram and a hardware deployment diagram are shown
in Figure 3 and 4, respectively.
As shown in Figure 1, the first two steps use soft-
ware design characteristics as heuristic measures of
probability factors of risk. Step 1) computes interac-
tion rates among software components for each sce-
nario based on the design workflow. For simplicity,
we assume that each outgoing interaction from the
same component occurs equally likely (when insights
about interaction likelihoods are available, appropri-
ate weights can be applied). Step 2) constructs a graph
whose nodes represent software components. Transi-
tion rates among components are computed by tak-
ing scenario likelihoods into account for combining
interaction rates from each scenario. In security risk
contexts, scenario likelihoods are heuristic measures
of probabilities of potential threats (e.g., when scenar-
ios involve adverse actions), whereas interaction rates
are heuristics that partially measure degrees of com-
ponent exposure.
Step 3) uses characteristics of hardware deploy-
ment design as a heuristic measure of an additional
probability factor of security risk. We first deter-
mine vulnerability sources of each host. This can be
done by a table lookup procedure on publicly avail-
able vulnerability databases for vulnerability sources
based on relevant host and network attributes (e.g.,
IP addresses, services). Examples of vulnerability
sources include Apache Chunked-Code software on
web servers, operating environments Windows XP
SP2 and JRE 1.4.2 for running JAVA programs on ap-
plication servers, and Oracle and TNS Listener soft-
ware for database servers. Such vulnerabilities and
their sources can be easily identified by scanning tools
when hardware platforms to be deployed are already
in operation.
Next step is to measure vulnerabilities of each
software component. Each component may require
one or more hosts. For example, a component that
runs on one application server may also need to query
data on another database server. From the deployment
design, we can determine all hosts required by each
component. Let H
i
be a set of hosts required by soft-
ware component i and v
h
be a number of vulnerabil-
ities of host h. For component i, a number of vul-
nerabilities, v
i
and its normalization to a vulnerability
ratio, V
i
are estimated as:
v
i
=
∑
h∈H
i
v
h
and V
i
= v
i
/
∑
i
v
i
.
Here vulnerability ratios of software components
are heuristic measures of likelihood factors of security
risks. The more vulnerable software component is,
the more likely that the system security can be com-
promised.
Step 4) combines all probability factors obtained
in Steps 2) and 3) to estimate the likelihood of each
component being attacked (or security breach). Here
we interpret this likelihood as a chance of a com-
ponent under investigation to be the first being at-
tacked in the system. Thus, all components and links
along the path to reach the component are secured
(unexposed to attack and unexploited vulnerability).
The likelihood of a node being secured is estimated
by subtracting its exposure degree, estimated by its
weaknesses (i.e., vulnerability ratio), from one.
Figure 2: Likelihoods of security breach in components.
We elaborate this step by a small example of a de-
pendency graph shown in Figure 2, where nodes S, A,
B, C and D represent components of a software de-
sign. A double-lined arrow indicates that S is an entry
point to software system execution. Each component
and transition is annotated with a corresponding vul-
nerability ratio (in bold) and a transition rate, respec-
tively. As shown in Figure 2, the likelihood of S to
breach security is determined by the vulnerability ra-
tio of S itself. The chance of A being attacked (via
S → A) is estimated by its chance to be reached with-
out attacks (i.e., S being secured and S transits to A)
and its exposure factor (weaknesses). The former is
estimated by the likelihoods of S being secured and S
transiting to A, whereas the latter is estimated by A’s
vulnerability ratio. Thus, the chance of A being at-
tacked is estimated by (1− 0.3) × 0.2× 0.1 = 0.014.
Similarly, the likelihood estimate of security breach
in B is 0.224. The chance of C being attacked is
estimated by the sum of the chances of C being at-
tacked via S → A → C (i.e., (1 − 0.3) × 0.2 × (1 −
0.1) × 1 × 0.1 = 0.0126) and via S → B → C (i.e.,
SECURITY RISK ANALYSIS IN WEB APPLICATION DESIGN
31

(1 − 0.3) × 0.8 × (1 − 0.4) × 0.1 × 0.1 = 0.00336).
This gives 0.01596.
In general, the estimated probability along an ac-
cess path is analogous to propagation of probabilis-
tic effects in Bayesian network by using Bayes Rule
(Pearl, 1997). The transition rate plays a similar role
to a conditional probability of a destination being at-
tacked given a source being reached. For simplicity,
we do not explicitly represent access privilege. We
assume that any activity in the same component can
be equally accessed. However, not every component
deployed by the same host can be accessed equally.
We also assume that network connections between
hosts do not have vulnerabilities. Such vulnerabilities
can be easily incorporated in our proposed approach.
Note that since all probability factors (transition rate,
vulnerability ratio) are no greater than one, the longer
the path to reach a component is, the harder it is to at-
tack (i.e., its chance of being attacked decreases). For
a path that contains cycles, we consider the maximum
likelihood that can be obtained. Thus, the heuristic
function we use for estimate likelihoods conforms to
intuition in security contexts.
In Figure 1, Step 5) estimates consequences of
each adverse action in each software component us-
ing approaches similar to HAZOP or FMEA. In this
paper we focus on probability estimation. Thus, we
apply a typical severity analysis technique, categorize
and quantify component consequences according to
security standards (ISO, 2002). By using the max-
imum severity obtained in each component, we can
compute an estimate of security risks of each compo-
nent of the system being design. For a risk estimate
of an overall system, we estimate the likelihood of
a system by multiplying the likelihood of a system
to safely terminate by a vulnerability ratio of over-
all system components, and the system severity. We
estimate the system severity by taking a majority of
severity categories of components in the overall sys-
tem. Section 4 illustrates our methodology in a case
study of web application design.
4 A CASE STUDY
This section presents an illustration in an industrial
engineering and business-to-business (B2B) domain
with a case study, adapted from (Qiang et al., 2001).
4.1 Web Application Design
A web-based material requirements planning (MRP)
system takes customer’s product order through the
B2B web front and performs material requirements
planning. The goal of the system is to respond quickly
and effectively to changing requirements to minimize
delay in production and product delivery. The system
automatically updates orders and predicts the daily
planned orders, which may be overwritten by a man-
ager. The daily planned orders are sent to a job shop
that simulates real-time scheduling and production.
At the same time, the system determines materials re-
quired for the daily planned orders and sends orders of
raw materials to appropriate suppliers. Job shop sim-
ulator reports on finished parts/products to the MRP
system, where the manager may adjust some initial
parameters (e.g., lead time, lot size) for scheduling
production plan to meet customer order requirements.
A supplier can view material order status and ac-
knowledge the receipt of the order.
The web application design consists of seven soft-
ware components: MRP, MPS (Master Production
Schedule), BOM (Bill of Material), JOB (Job shop
simulator), CI (Customer Interface), MI (Manager In-
terface), and SI (Supplier Interface). MRP validates
logins, records product orders and determines cus-
tomer’s billing. MPS schedules appropriate daily pro-
duction plan from a given product demand (e.g., from
customer order) and other input parameters. The de-
tails of MPS are beyond the scope of this paper. BOM
determines parts required for each product to be pro-
duced and sends order for raw materials to suppliers.
JOB is a job shop component that simulates real-time
scheduling and production in a manufacturing plant.
CI, MI and SI facilitate web interfaces for different
users. Customers and suppliers are required to login
via a web front, while a manager can do remote login
to MRP.
To focus our illustration on risk methodology, we
simplify a B2B process by assuming that all payment
between a customer and a manufacturer, or a man-
ufacturer and a supplier are off-line transactions. We
represent the design in an extended workflow diagram
as described in Section 3.2. To make it easy to under-
stand our analysis approach, we present the workflow
in three use cases, each of which has one scenario.
The three use cases are customer orders products,
manager adjusts demands/requirements, and supplier
acknowledges material order. We assume that the
likelihood of occurrence of each scenario is 0.4, 0.2,
and 0.4, respectively.
Figure 3 shows a workflow diagram of a process to
handle customer orders for products. We assume cus-
tomers have established business relationships with
the manufacturing enterprise and therefore MRP is re-
stricted for use with these customers only. Thus, cus-
tomers and suppliers are required to login via a web
front. The workflow starts at a dark circle and ends
WEBIST 2007 - International Conference on Web Information Systems and Technologies
32

Figure 3: Workflow diagram of a customer use case.
at a white circle. It represents both sequential (by di-
rected link) and concurrent (indicated by double bar)
activities among different components. For example,
after determining parts required for products produc-
tion, BOM sends results to job shop to simulate pro-
duction of product orders and concurrently it places
order of raw materials to appropriate suppliers. The
workflow diagram is extended to include software
components responsible for functions/executions of
these activities. The components are shown in oval
shapes on the right of the figure. The arrows between
components indicate the interactions among them.
Second part of the design is a hardware deploy-
ment plan. Figure 4 shows the design of hardware
platforms required. Like many web applications, the
MRP system has a three-tier architecture. The pre-
sentation layer requires a web server, W. The busi-
ness logic layer contains three application servers:
A1− A3. Finally, a data layer employs four database
servers: D1 − D4, each facilitates data retrieval from
different databases as summarized at the bottom of the
figure. The servers/hosts are connected via LAN with
a firewall between the web server,W and the LAN ac-
cess to the three application servers. The deployment
plan annotates each server with software components
that rely on its services as appeared in a square box
on top of each server. For example, as shown in Fig-
ure 4, a manager can login remotely to MRP via MI,
both of which run on application server A1. MRP and
MI allow him to review production status and adjust
product demands. Since MRP is also responsible for
login validation, it needs to retrieve password data.
Thus, unlike other application servers, A1 needs to be
connected with D1. Next section describes the analy-
sis for assessing security risks associated with each of
Figure 4: Hardware architecture and deployment plan.
these software components from a given design.
4.2 Estimating Security Risks
The first step for the proposed risk methodology is to
calculate interaction rates from each scenario of the
web application design. As shown in Figure 3, MRP
has one interaction to MPS but has a total of four in-
teractions from it (two from MRP to a terminal state,
one to CI and one to MPS). Thus, an interaction rate
from MRP to MPS is 1/4 as shown in table M
1
of
Figure 5. M
1
represents interaction rates among com-
ponents obtained from a “customer orders product”
scenario, where T is a terminal state in the workflow.
Similarly, we can obtain tables M
2
and M
3
represent-
ing interaction rates in the manager and supplier sce-
nario, respectively.
M
1
CI MRP MPS BOM JOB T
CI 0 3/4 0 0 0 1/4
MRP 1/4 0 1/4 0 0 1/2
MPS
0 0 0 1 0 0
BOM 0 0 0 0 1/2 1/2
JOB
0 1 0 0 0 0
M
2
MI MRP MPS BOM JOB T
MI 0 2/3 0 0 0 1/3
MRP
1/3 0 1/3 0 0 1/3
MPS 0 0 0 1 0 0
BOM
0 0 0 0 1/2 1/2
JOB 0 1 0 0 0 0
M
3
SI MRP BOM T
SI 0 1/2 1/2 0
MRP 1/2 0 0 1/2
BOM
0 0 0 1
Figure 5: Tables of interaction rates in each scenario.
Step 2) constructs a dependency graph of software
components. For each pair of components, we com-
pute a transition rate using the corresponding interac-
tion rates obtained from each scenario (M
1
, M
2
and
SECURITY RISK ANALYSIS IN WEB APPLICATION DESIGN
33
M
3
) and a given likelihood of each scenario, as de-
scribed in Figure 1.
In Step 3), determine vulnerabilities of hardware
platforms from a given deployment plan shown in
Figure 4 by applying a scanning tool (if the required
host and network configurations of the system are
already in operation), or (otherwise) a table lookup
procedure to public vulnerability databases. Table 1
shows vulnerability sources and their counts on our
application deployment plan. As described earlier, the
table lookup for vulnerability sources are based on
software and its environments required on each host
to provide their services.
Table 1: Vulnerabilities from hardware deployment plan.
Host Vulnerability Sources Count
W Apache-Chunk, PHP 4.2 2
A1 Jboss, JRE 1.4.2, Windows, Tomcat-3.2.1 4
A2 Jboss, JRE 1.4.2, Windows 3
A3 Telnetd 1
D1 Oracle, TNS Listener 2
D2 Oracle, TNS Listener 2
D3 Oracle, TNS Listener 2
D4 Oracle, TNS Listener 2
Table 2: Component demands and vulnerability ratios.
W A1 A2 A3 D1 D2 D3 D4 #Vuls V
i
CI 1 1 4 0.09
SI 1 1 1 6 0.14
MI 1 1 1 8 0.2
MRP 1 1 1 1 1 10 0.23
MPS 1 1 1 7 0.16
BOM 1 1 1 7 0.16
JOB 1 1 0.02
Next, to find a vulnerability ratio, V
i
of component
i, we determine host services required by the compo-
nent. For example, the customer interface, CI requires
the web server W for login and ordering products, and
also requires query retrievals of product information
from the database D2 for browsing. Similar results
can be obtained for other components as summarized
in Table 2. The second to last column shows the
number of vulnerabilities associated with each com-
ponent. This is estimated by summing a total number
of vulnerabilities in each of the hosts required in the
component. The last column shows vulnerability ra-
tios with a total ratio of one for overall system vulner-
ability.
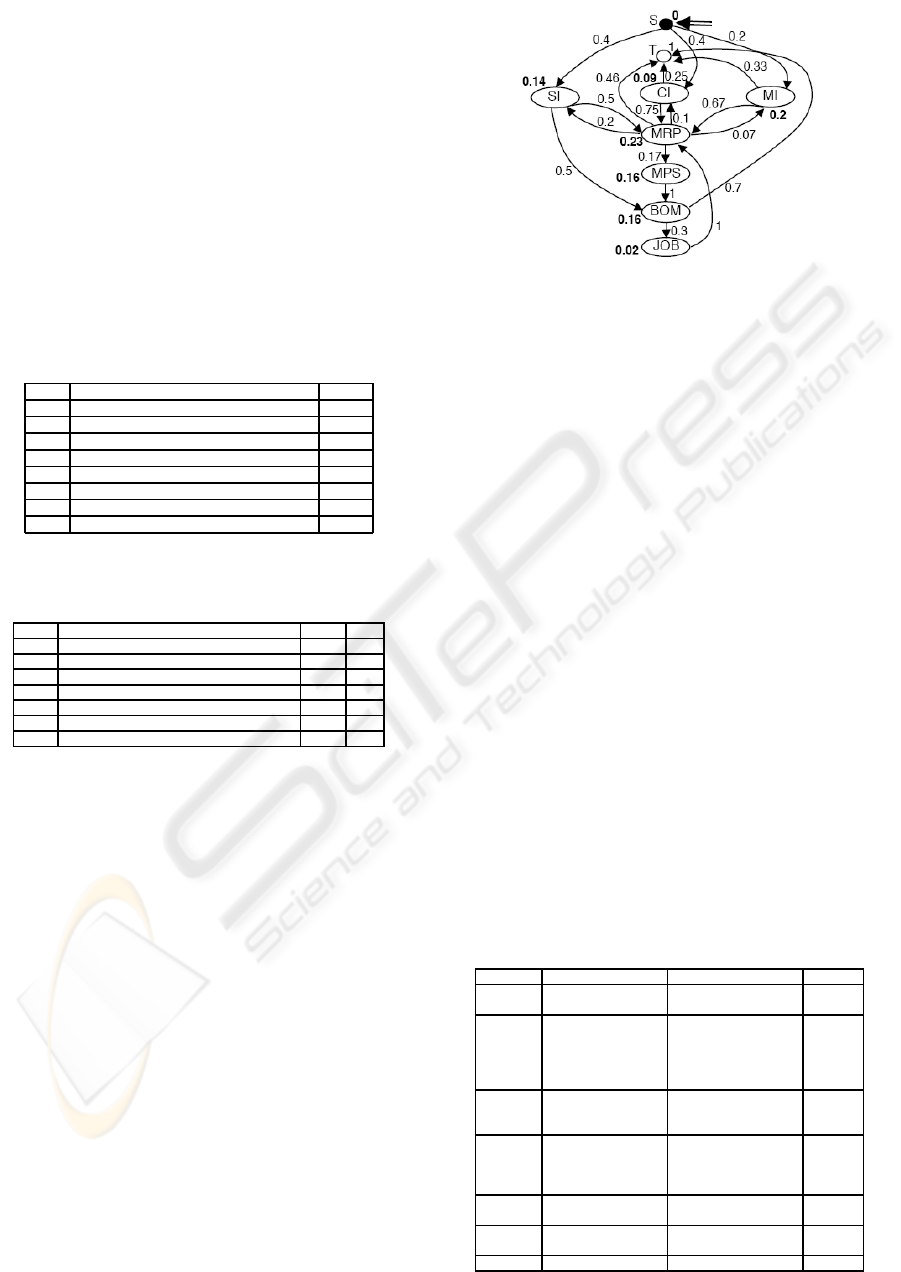
Figure 6 shows the resulting graph obtained from
Step 2) with annotated transition rates and vulnerabil-
ity ratios (in bold), heuristic estimates of vulnerability
of the design components. Here we assume that at the
starting point S (a solid circle), the system has no vul-
nerability, whereas the terminating point T (a white
circle) has a vulnerability ratio of the whole system
(i.e., one).
Figure 6: A dependency graph of software components.
Step 4 determines likelihoods of attacks to (or se-
curity breach in) each component using the approach
as described in the example of Figure 2. For exam-
ple, the chance of CI being attacked (via S → CI)
is 1 × 0.4 × 0.09 = 0.036. Note that the path to CI
from MRP (via S → CI → MRP → CI) is ignored
since it produces a lower likelihood and thus, not
the worst case as desired. The chance of MRP be-
ing attacked is computed as a sum of likelihoods of
MRP being reached from CI, MI, SI, and JOB, i.e.,
0.06+0.02+0.04+0.01= 0.14. A summary of com-
ponent security breach likelihoods is given in the first
row of Table 4. In Step 5), we estimate consequences
of adverse actions in each component by categorizing
consequences into five categories: CT (catastrophic:
0.95), CR (critical: 0.75), MG (marginal: 0.5), and
MN (minor: 0.25) (ISO, 2002). The estimated sever-
ity for each component is shown in Table 3. By select-
ing the maximum severity obtained in each compo-
nent to be the component severity, and applying stan-
dard quantification to it, we can obtain risk of each
component as shown in Table 4. Here MRP is the
most high-risk component with 34.31% risk, whereas
MI is the lowest with 2.64% risk. The risk of over-
all system is computed by multiplying the likelihood
Table 3: Severity analysis of the web application design.
SW units Malicious actions Consequences Severity
CI change product order order unverified MN
increase access level increase vulnerabilities CR
MRP change product order incorrect charge, plan MG
change demands over/under stock MG
change charges lose profits CT
access customer info lose financial info CT
access product info lose product info MG
MPS change schedule incorrect plans CR
access product info lose product info MG
access supplier info lose supplier info MG
BOM change parts incorrect product plan CR
increase access level increase vulnerabilities MG
access product info lose product info MG
access supplier info lose supplier info MG
JOB change finished time late delivery, lose cust. MG
access product info lose product info MG
MI change prod. status wrong update MN
increase access level increase vulnerabilities MN
SI increase access level increase vulnerabilities MG
WEBIST 2007 - International Conference on Web Information Systems and Technologies
34

Table 4: Risk analysis results.
CI SI MI MRP MPS BOM JOB T
Likelihoods 0.04 0.06 0.04 0.14 0.07 0.08 0.13 0.665
Severity 0.75 0.5 0.25 0.95 0.75 0.75 0.5 0.75
Risk 0.03 0.03 0.01 0.13 0.05 0.06 0.07 0.499
%Risk 7.13 7.39 2.64 34.31 14.51 16.77 17.25
of reaching the terminating point, T with its vulner-
ability and a severity of the overall system. Here we
use, CR, which is a severity category of a majority of
all components. The result in Table 4 shows that the
security risk of overall system is about 50%, which
can be used as a baseline to compare with alterna-
tives. These risks give relative measures for assist-
ing decisionmakings on security options from differ-
ent designs.
5 CONCLUDING REMARKS
This paper attempts to provide a general framework
for security risk analysis of web application software
design. We present a systematic methodology for
automated preliminary risk assessment. Our focus
here is not to estimate precise risk measures but to
provide a quick and early rough estimate of security
risks by means of heuristics based on characteristics
of software design and hardware platforms to help lo-
cate high-riskcomponents for further rigorous testing.
Our risk model is far from complete partly due to in-
herent limitations in the design phase. Although, we
illustrate our approach to web applications, it is gen-
eral to apply to other softwareintensive systems and to
extend the framework and the methodology to include
additional security elements in the model.
The approach has some limitations. Besides ob-
vious requirements on knowledge about system us-
age scenarios and component-based design, the ap-
proach is limited by insufficient data available in the
early phases of software life cycle to provide precise
estimation of the system security. However, the risk
analysis methodology suggested in this paper can be
used to estimate security risks at an early stage, and
in a systematic way. Finally, the approach does not
consider failure (to satisfy security criteria) depen-
dencies between components. Thus, risks of a com-
ponent connected to attacked components are deter-
mined in the same way as those that are not attacked.
We plan to extend this framework to address this is-
sue by providing mechanisms that take user roles, ac-
cess privilegesand vulnerability exploits into account.
Additional future work includes refinement of explicit
severity analysis and incorporationof attack scenarios
in the risk models.
REFERENCES
Barna, P., Frasincar, F., and Houben, G.-J. (2006). A
workflow-driven design of web information systems.
In ICWE ’06: Proceedings of the 6th international
conference on Web engineering, pages 321–328, New
York, NY, USA. ACM Press.
Bugtrag (2006). Retrieved October 11, 2006, from
http://www.securityfocus.com/archive/1.
Cortellessa, V., Appukkutty, K., Guedem, A. R., and Elnag-
gar, R. (2005). Model-based performance risk analy-
sis. IEEE Trans. Softw. Eng., 31(1):3–20.
Ginige, A. and Murugesan, S. (2001). Web engineering: an
introduction. Multimedia, IEEE, 8(1):14–18.
Haimes, Y. Y. (2004). Risk Modeling, Assessment, and
Management. John Wiley & Son, 2nd edition.
ISO (2002). Risk management vocabulary guidelines for
use in standards. ISO Copyright Office, Geneva.
Landoll, D. J., editor (2006). The Security Risk Assessment
Handbook. Auerbach Publications.
Nessus (2006). Nessus vulnerability scanner. Retrieved Oc-
tober 11, 2006, from http://www.nessus.org/.
Pearl, J. (1997). Graphical models for probabilistic and
causal reasoning. In The Computer Science and Engi-
neering Handbook, pages 697–714.
Qiang, L., Khong, T. C., San, W. Y., Jianguo, W., and
Choy, C. (2001). A web-based material requirements
planning integrated application. In EDOC ’01: Pro-
ceedings of the 5th IEEE International Conference on
Enterprise Distributed Object Computing, page 14,
Washington, DC, USA. IEEE Computer Society.
Shahrokhi, M. and Bernard, A. (2004). Risk assess-
ment/prevention in industrial design processes. In
2004 IEEE International Conference on Systems, Man
and Cybernetics, pages 2592–2598.
Stoneburner, G., Goguen, A., and Feringa, A. (2002). Risk
management guide for information technology sys-
tems. Technical Report 800-30, Computer Security
Division, Information Technology Laboratory, NIST.
Verdon, D. and McGraw, G. (2004). Risk analysis in soft-
ware design. IEEE Security and Privacy, 2(4):79–84.
Walt, C. v. d. (2002). Assessing internet security risk,
part four: Custom web applications. Retrieved from
http://www.securitydocs.com/library/729.
Yacoub, S. M., Cukic, B., and Ammar, H. H. (1999).
Scenario-based reliability analysis of component-
based software. In ISSRE ’99: Proceedings of the
10th International Symposium on Software Reliability
Engineering, page 22, Washington, DC, USA. IEEE
Computer Society.
Zhang, Y., Zhu, H., Greenwood, S., and Huo, Q. (2001).
Quality modelling for web-based information sys-
tems. In FTDCS ’01: Proceedings of the 8th IEEE
Workshop on Future Trends of Distributed Computing
Systems, page 41, Washington, DC, USA. IEEE Com-
puter Society.
SECURITY RISK ANALYSIS IN WEB APPLICATION DESIGN
35
