
ROBUSTNESS ANALYSIS USING FMEA AND BBN
Case Study for a Web-based Application
Ilaria Canova Calori, Tor Stålhane and Sven Ziemer
Department of Computer and Information Science, NTNU, Sem Sælands vei 7-9, NO-7491 Trondheim, Norway
Keywords: Robustness, Failure Modes and Effects Analysis (FMEA), Bayesian Belief Network (BBN), Jacobson’s
analysis.
Abstract: Time pressure and quality issues represent important challenges for those who develop web-based systems.
The ability to analyze a system’s quality and implement improvements early in the development life cycle is
of great practical important. For our study we have considered robustness as a critical quality issue. Our
objective is to propose a general framework for conducting robustness analysis of web-based systems at an
early stage of software development, providing a tool for evaluating failure impact severity and supporting
trade-off decisions during the development process. The framework makes use of Jacobson’s analysis
method to decompose a system in its functional components, Failure Modes and Effects Analysis to identify
all failure modes that characterize each component, and Bayesian Belief networks to deal with failure cause-
effect relationships and evaluate the uncertainty of their impact.
1 INTRODUCTION
Market pressures of web-based applications lead to
the demand for new features ever more rapidly. The
challenge is to meet those demands while increasing,
or at least not sacrificing, quality. For this reason,
web-based applications have to be developed
through a robust and well-understood process.
Software today is more complex than ever. In
order to understand complex things we need to break
them down into manageable pieces before modelling
them. In (Conallen, 2003) the author points out that
one of the key activities is to examine and prioritize
requirements according to perceived risk and
benefit. Addressing and targeting critical
components is therefore crucial. High quality
improvement early in the process results in fewer
defects to be found and repaired later in the process.
At an early stage of the development life cycle there
is still time to accommodate modifications and to
implement them in an inexpensive way.
Communication is also a fundamental part of the
process. Building software is often about decisions.
To help structure and communicate decisions,
artefacts documenting the work are created during
the development process. A software development
process has to provide, among other things, criteria
for monitoring and measuring the project’s products
and activities (Conallen, 2003). On the other hand,
we have to consider that web application
development is a rather informal practice and is
often carried out through an incremental process
(Ziemer and Stålhane, 2006).
In this paper we focus our attention on
robustness as described in (Zhou and Stålhane,
2004). We consider a system or component to be
robust if it is totally correct with a complete
specification and its behaviour is predictable for all
possible operational environments. In this paper a
framework for system robustness analysis that can
be employed at an early stage and throughout the
development life cycle is presented. The proposed
approach provides a method for design teams to
reason on system failure cause-effect relationships
and the uncertainty of their impact; it supports trade-
off decision and evaluation of remedial actions. This
framework combines FMEA with BBN; the first
method allows the identification of system failure
modes, while the second provides a tool to deal with
prior information and available expert experience.
This method is applicable to all kind of IT systems,
but this paper focuses on web-based system where a
robust development process and a robust final
product have top priority.
The rest of this paper is organized as follows: in
Section 2 we discuss related work, with Section 3
164
Canova Calori I., Stålhane T. and Ziemer S. (2007).
ROBUSTNESS ANALYSIS USING FMEA AND BBN - Case Study for a Web-based Application.
In Proceedings of the Third International Conference on Web Information Systems and Technologies - Internet Technology, pages 164-170
DOI: 10.5220/0001269701640170
Copyright
c
SciTePress

presenting the proposed framework and a short
introduction to the methods we are using. Section 4
illustrates the approach by applying it to a simple
web-based application example. In Section 5 we
conclude the paper and discuss future research
directions.
2 RELATED WORK
It is difficult to find works related to robustness
analysis applying BBN or other probabilistic models
during software development. BBNs have been
used, however, in reliability analysis; here we briefly
present some related works.
In (Yacoub et al., 1999) the authors introduced a
reliability analysis technique based on execution
scenarios to identify critical components and
interfaces. They constructed a probabilistic model
called “Component - Dependency Graph” which
incorporates components, their reliabilities, and
interaction probabilities. A sensitivity analysis is
carried out to investigate the relation between
application reliability and changes in components’
reliabilities. In our investigation we have also
focused on scenarios to deal with different kinds of
failure, and a sensitivity analysis allowed us to
analyze which factors contribute to the most critical
effects.
In (Singh et al., 2001) an approach to reliability
analysis of component-based systems fully
integrated with the UML is proposed. Use case
diagrams have been used to give a functional
description of the system, while sequence diagrams
are used to depict interactions within a use case. Use
case diagrams represent a powerful tool to
decompose systematically a system into its
components. Furthermore, a Bayesian reliability
prediction has been applied to derive a posterior
probability of each failure using available prior
probabilities and data from test failure.
In (Beaver et al., 2005) a model to capture the
evolution of the quality of a software product is
proposed. The final quality of the software being
developed is reliably predicted using a Bayesian
Network. The quality, in terms of product suitability,
was estimated by taking into account development
team skill, software process maturity and software
problem complexity. Our intent is to represent the
system through a lower level of abstraction than the
one proposed there.
As a starting point for our work we have used the
methodology proposed in (Lee, 2001). Lee
combined FMEA with BBNs to provide a language
for design teams developing mechatronic systems to
articulate physical system failure cause-effect
relationships, and to evaluate the uncertainty of their
impact. The author proposed to represent failure
scenarios as belief network chains and determine
end-effect failure probabilities by assuming
probabilistic dependency down and across the
failure causal chains, assigning conditional
probabilities between intermediate and final events
and states. He then employed these conditional
probabilities to propagate root cause probabilities
down the failure chain. Instead of applying the Risk
Priority Number (RPN) to rank failure severities,
Lee defined a severity standard to be applied across
all scenarios and extended the belief network
formalism by connecting a severity variable to each
failure event. In this way his method provides a level
of analytical granularity otherwise unavailable in
traditional FMEA spreadsheet formalism.
In (Zhou and Stålhane, 2004) a method to
conduct early robustness assessment for web-based
systems is proposed. Jacobson’s analysis method is
then used to systematically decompose a system and
FMEA is used to analyze the failure modes of each
subsystem, their causes, and effects.
Our approach is based on the initial concepts
developed in (Lee, 2001) adapted to software-based
system development. The approach used in (Zhou
and Stålhane, 2004) represents the first steps of our
framework. It allows us to carry out the FMEA,
identify the uncertain variables that are important for
the system robustness, and then model them using
BBN formalism as indicated by Lee.
3 ROBUSTNESS ANALYSIS
The robustness analysis framework we propose is a
five-step method that combines Jacobson’s analysis
method, FMEA, and BBN. What we are interested in
is the severity of a failure, which means that we need
to define a severity ranking in order to be able to
classify and compare the failures’ effects and decide
if a system is robust enough or if it is necessary to
take some precautions against certain events.
Step 1: A severity ranking is specified and
applied across all failure scenarios. An event is
defined to be not critical when no failure
occurs and invalid input is recognized and
adequately processed, the system prompts the user
without saving invalid inputs, or the invalid input is
changed to default values and saved in the system
without prompting the user. An event is considered
to be critical when a failure prevents further use
ROBUSTNESS ANALYSIS USING FMEA AND BBN - Case Study for a Web-based Application
165
of the system, such as abnormal behaviour of the
system, or when invalid input are not recognized and
thus saved in the database without prompting the
user.
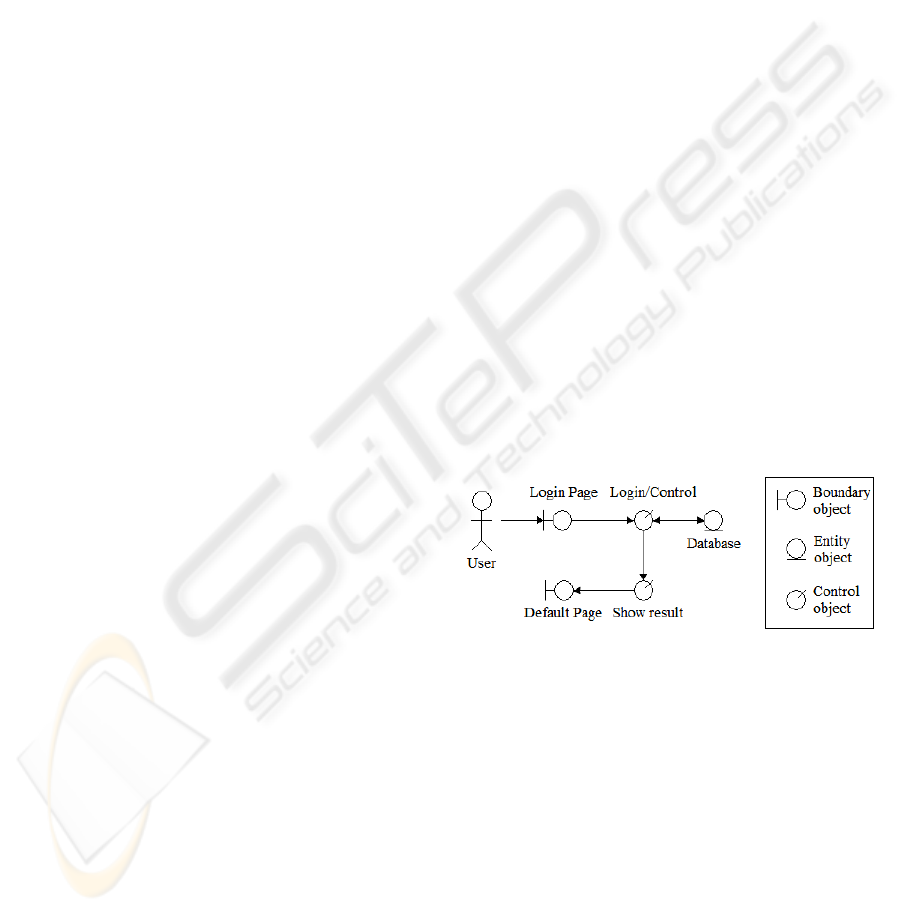
Step 2: Jacobson’s analysis method is used to
capture system behavioural aspects at an early stage
of the development life cycle when little information
about the system structure is available, and to
identify boundary objects, also known as interface
objects; entity objects, such as databases; and
control objects which capture application logic and
manage all interactions between boundary and entity
objects. See Figure 1. In our investigation we are
particularly interested in control objects since they
serve as natural placeholders for robustness
assessment using FMEA (Zhou and Stålhane, 2004).
Step 3: FMEA is carried out for each control
object. FMEA is a technique used to examine
potential failures in products and processes, and
identify their possible causes and effects. See Table
1. Failure events, causes, and effects represent the
uncertain variables to be used in our BBN model.
FMEA also helps us to select remedial actions that
reduce the consequences from a system failure.
Step 4: The BBN model of the system is created.
A BBN representation requires first a construction of
a BBN topology and elicitation of probabilities for
nodes and edges. The variables identified using
FMEA are connected with arcs to represent the
cause-effect relationship between the nodes. A
severity variable is added to the model to take into
account the failure impact on the system, see Figure
2. Prior and conditional probability tables as well as
severity utility tables are defined as discrete
probability tables. Making computations with BBNs
is easy when applying computerized tools, such as
MSBNx (Kadie et al., 2001).
Step 5: We can now evaluate our belief about a
specific node by entering evidence about the state of
a variable, and then use the rules for probability
calculation backward and forward along the edges
from the cause nodes to effect nodes to determine
the severity of failure impact on the system’s
robustness. Hence, we can identify critical
components in the system, and modify them or
implement the remedial actions selected during the
FMEA in order to reduce the effect of a failure and
to verify their effectiveness by running the
computations once again after modifications have
been implemented.
4 DAIM
We conduct our investigation on the DAIM system
(http://newdaim.idi.ntnu.no/), developed at our
university for archiving and submitting master’s
theses and to facilitate the administration of theses,
mainly by letting the students do most of the work
themselves.
In this paper we consider only one function of
the DAIM system, the log-in function. DAIM
distinguishes between several types of users: internal
(students and administrators) and external. The
internal users need to be logged on in order to use
the system, while the only part available to all users
is a search function to search the archive of theses.
4.1 Log-in Function
In this section we will illustrate the proposed method
by giving an example and applying the severity
classification defined in Section 3.
In the DAIM system each internal actor, such as
a student, has to be logged on before performing any
other tasks. Figure 1 shows the result of using
Jacobson’s analysis to represent the “Log-in” use
case. The user types in the username and password
in the “Login Page”. The “Login/Control” object
checks the username and password by interacting
with the “Database”, and the result is displayed on
the “Default Page” by the module “Show result”.
Figure 1: Jacobson analysis diagram of Log-in.
The application logic of this use case is captured
by “Login/Control” and “Show result” control
objects. The FMEA worksheet is shown in Table 1
where the names of the control objects are listed
together with all identified robustness-related failure
modes, possible causes, main effects on the system
and its subsystems, and possible ways to prevent, or
at least reduce, these effects.
The variables for the BBN are selected from the
FMEA worksheet, Table 1. Cause and failure event
variables can be identified in the “Possible cause”
and “Failure mode” columns respectively. The
variables identified in this use case, their symbol and
their states {State0, State1} are listed below.
WEBIST 2007 - International Conference on Web Information Systems and Technologies
166
Possible causes:
- User Input UI {Correct, Error};
- Database Data DD {Correct, Error};
- Login/Control LG {Correct, Error}.
Failure end-event (FEE):
- Response R {Correct, None}.
Severity, as defined in Section 3:
- Severity S {NotCritical, Critical}.
Once the variables have been identified, the
Bayesian model can be constructed. In order to do
this and efficiently deal with calculations and
topology modifications, we have used the Microsoft
Bayesian Network Editor and Toolkit (MSBNx)
(Kadie et al., 2001) which supports the creation,
manipulation, and evaluation of Bayesian
probability models.
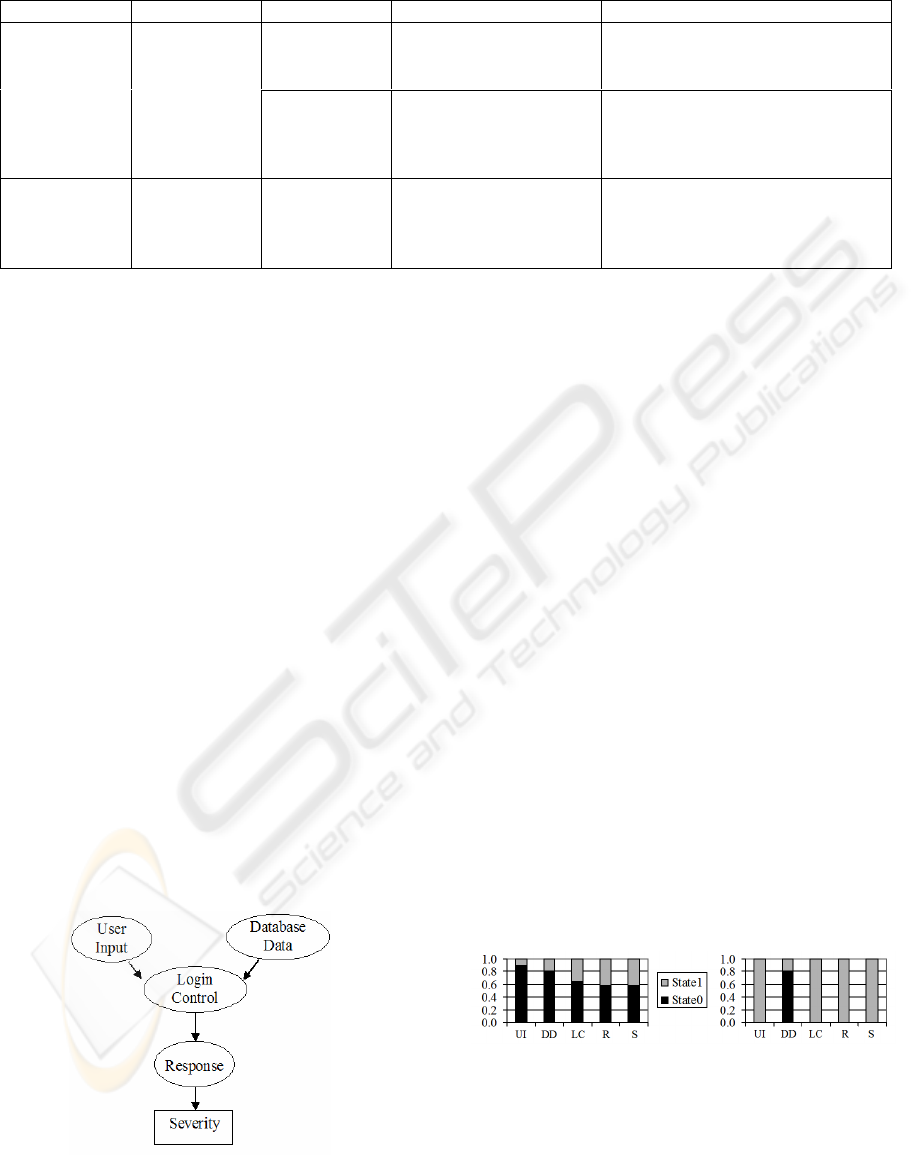
In the BBN representation, possible causes come
before the nodes they influence. In Figure 2, User
Input and Database Data are the variables that come
first; they represent the parent nodes of
Login/Control, which in turn influences the outcome
of the FEE Response node. The Severity node is
eventually specified as the child of the FEE; it is
represented with a rectangular shape since the
dependence between Response and Severity is due
to the severity ranking defined across all scenarios
and presented in Section 3.
Figure 2: BBN for Log-in function.
The prior and conditional probability tables as
well as the severity utility tables are defined as
discrete probability tables. The advantages of a
discrete form are that it becomes conceptually easier
to use for judgment to assign discrete values, and
that it makes the computation simpler.
The method we have used to define the
probability tables is the same as the one proposed in
(Gran, 2002). We have assessed two conditional
probabilities: P(good_measurements|good_quality)
and P(bad_measurements|bad_quality). The prior
probabilities that have been set for this scenario are
specified in the appendix. However, since the
objective of this work is to investigate the usefulness
of applying the BBN methodology to robustness
analysis, the tables have not been validated.
With MSBNx, the evaluation of the Bayesian
model, given the prior and conditional probabilities,
is straightforward. The results are shown on the left-
hand side of Figure 3. To evaluate the impact of an
observed event we entered evidence into the BBN in
the form of hypotheses, see the right-hand side of
Figure 3. For instance, when evidence of user input
UI = Error (grey) is entered into the BBN of the
Log-in function, the Critical severity S (grey)
jumps to a probability equals to 1, because the
system will not produce any response and probably
will prevent further use of the system.
Figure 3: Probabilities of the BBN model before and after
evidence is entered.
Table 1: FMEA of Log-in function.
Control object Failure mode Possible cause System effect Preventive actions
Login/ Control No response is
produced at all
Error user
input
Fail to respond to user’s
interaction. Prevent
further use of the system
Control users input and prevent
serious errors from entering the
object. Prompt the user appropriately
Database
contains
incorrect/
damaged data
User cannot log in with
correct username and
password. Users suspect
the quality of the system
Manage data in “Database” and
ensure its correctness. Interact with
“Show result” to give feedback to
the user
Show result No response is
produced at all
Error output of
“Login/
Control”
Fail to respond to user’s
interaction. Prevent
further use of the system
Control output from “Login/
Control”. Prevent serious errors
from entering the object. Prompt the
user appropriately
ROBUSTNESS ANALYSIS USING FMEA AND BBN - Case Study for a Web-based Application
167
4.2 Evaluating Preventive Actions
The severity of the Log-in failure scenario can be
reduced by implementing the preventive actions
proposed in the FMEA worksheet in Table 1. For the
Log-in function example, this might mean to prompt
the user in case of erroneous input and allow him to
enter a new username and password. In this way the
probability of getting a correct response can be
increased but the system and, consequently, our
model have to be modified.
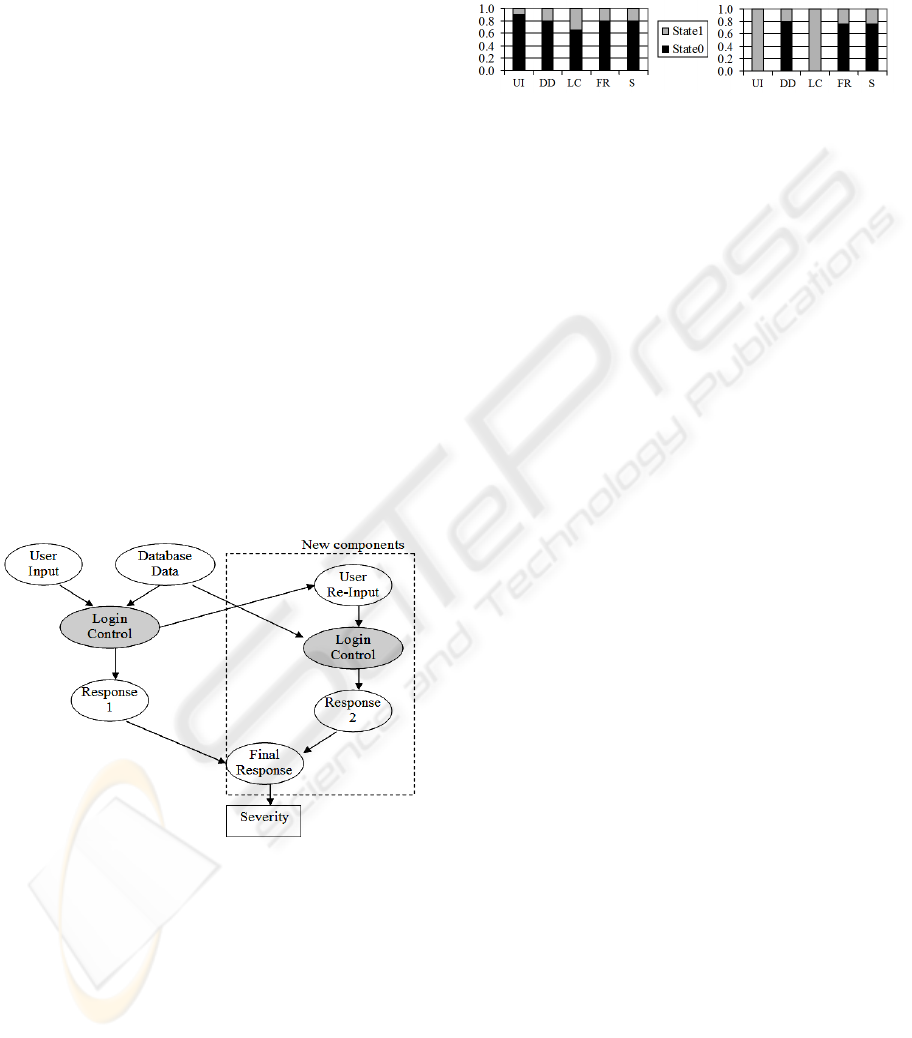
Figure 4 shows the new BBN. New components
are introduced: User Re-Input, a duplicate of
Login/Control, Response2 similar to Response, and
Final Response. A duplicate of Login/Control has
been included in order to keep the graph acyclic.
The Final Response (FR) variable results to be
correct if at least one of its parents, Response1 or
Response2, is correct. With these modifications the
user has the opportunity to re-enter the data. In
successive attempts, the probability of entering
correct data ought to increase. Thus, the probability
of entering correct data during the second attempt is
set to be higher than the probability of entering
correct data on the first attempt. The prior
probabilities that have been set for this scenario are
specified in the appendix.
Figure 4: BBN for the modified Log-in function.
Figure 5 shows, on the left-hand side, the
evaluation of probabilities in the modified BBN of
the Log-in function. The probability of a correct
final response FR (black) is increased compared to
the original response R probability in Figure 3. On
the right-hand side of Figure 5 we also show the
evaluation of the modified BBN for the Log-in
scenario when evidence of user input UI = Error is
entered. Even if the initial user input is erroneous
(grey), the possibility to re-enter a correct input with
a second attempt raises the possibility of getting a
correct final response FR (black) and hence also the
probability of a non-critical severity S (black) rises
to more then 0.7.
Figure 5: Probabilities of the modified BBN model before
and after evidence is entered.
In a similar way, the design team can consider
other function scenarios, analyze their failure modes
and their impact on the system, and decide whether
improvements are necessary or not in order to
achieve a certain robustness of the system that will
be released.
5 CONCLUSIONS AND FUTURE
WORK
In this paper we have presented the use of FMEA
combined with BBNs for robustness analysis.
Starting from the method described in (Zhou and
Stålhane, 2004), we have moved further, proposing a
framework that embeds a BBN model. In this way,
the proposed framework can provide a method for
design teams to articulate system failure cause-effect
relationships, and evaluate the uncertainty about
their impact. Furthermore, this approach can support
traditional design FMEA objectives – identification
of system failure modes – and provides improved
knowledge representation and inferring power
through BBNs application.
This framework uses well-known methods for
software development, but the application of BBN
and the collection of information needed can
sometimes be time-consuming. For this reason an
incremental approach, as pointed out in (Ziemer and
Stålhane, 2006), has to be considered in future
works. In this way the information available at an
early stage, usually expert judgments, can be further
refined throughout the development, taking into
account the experience gained in the process.
The proposed approach can also be used to
compare the severities and the probability of
occurrence of several failure scenarios. The most
critical failures can be detected and targeted for
prioritized remedial actions. Furthermore, the
influence of a preventive action on the system being
WEBIST 2007 - International Conference on Web Information Systems and Technologies
168
developed can be estimated. This can represent a
powerful tool for design trade-off decisions.
However, as has been highlighted in (Houmb et
al., 2005), the result of the analysis performed using
BBN is strongly dependent on the observation and
evidence entered, as well as the variables used and
relations between them. This means that both
different structure of the BBN topology and different
estimation sets used as input to the topology will
give different results.
Although the method presented is based on a real
application, this approach has not been applied to a
real assessment or development process. One task
could be to test this framework, mathematically
assess the robustness of a system and compare the
results with other methods. Another task will be to
apply the proposed approach for decision support
early in the development of a system, in order to
indicate where to concentrate the effort and thus
realise the specific objectives of the final product.
REFERENCES
Beaver, J. M., Schiavone, G. A. and Berrios, J. S., 2005.
Predicting Software Suitability Using a Bayesian
Belief Network. In IMCLA’05, 4th International
Conference on Machine Learning and Applications.
IEEE Computer Society Press.
Conallen, J., 2003. Building Web Applications with UML,
Addison-Wesley. Boston, 2
nd
edition.
Gran, B. A., 2002. Assessment of programmable systems
using Bayesian belief nets. Safety Science, 40, 797-
812.
Houmb, S. H., Georg, G., France, R., Bieman, J. M. and
Jürjens, J., 2005. Cost-Benefit Trade-Off Analysis
using BBN for Aspect-Oriented Risk-Driven
Development. In ICECCS’05, 10
th
International
Conference on Engineering of Complex Computer
Systems. IEEE Computer Society Press.
Kadie, C. M., Hovel, D. and Horvitz, E., 2001. MSBNx: A
Component-Centric Toolkit for Modeling and
Inference with Bayesian Networks. Microsoft
Research Technical Report MSR-TR-2001-67.
Lee, B. H., 2001. Using Bayes Belief Networks In
Industrial FMEA Modeling And Analysis.
Proceedings of Annual Reliability and Maintainability
Symposium 2001. IEEE.
Singh, H., Cortellessa, V., Cukic, B., Gunel, E. and
Bharadwaj, V., 2001. A Bayesian Approach to
Reliability Prediction and Assessment of Component
Based Systems. In ISSRE’01, 12th International
Symposium on Software Reliability Engineering. IEEE
Computer Society Press.
Yacoub, S. M., Cukic, B. and Ammar, H. H., 1999.
Scenario-Based Reliability Analysis of Component-
Based Software. In ISSRE’99, 10th International
Symposium on Software Reliability Engineering. IEEE
Computer Society Press.
Zhou, J. and Stålhane, T., 2004. A Framework for Early
Robustness Assessment. In IASTED’04, 8
th
International Conference on Software Engineering
and Applications. MIT Cambridge.
Ziemer, S. and Stålhane, T., 2006. Web Application
Development and Quality - Observations from
Interviews with Companies in Norway. In
Proceedings of Webist 2006. INSTICC Press.
APPENDIX
The prior probabilities that have been used for the
Log-in scenario are specified below. Noticed that
they have been set without any expert assessment
and they may thus not be accurate and/or correct.
The prior probabilities for user input UI and
database data DD of being Correct or Error are
P(UI) = (0.9,0.1) and P(DD) = (0.8,0.2) respectively.
The remaining probabilities are listed in Table 2,
Table 3, and Table 4.
For the modified Log-in scenario where
preventive actions are implemented, the following
prior probabilities have also been set. See Table 5.
The probabilities for the second Login/Control
LC2 are equal to those of previous Login/Control
LC, P(LC2|RI,DD)=P(LC|UI,DD), in Table 2.
Similarly the second response R2 given the second
Login/Control LC2 is equal to P(R2|LC2)=P(R|LC),
see Table 3. Severity probability P(S|FR) given the
Final Response FR is equal to P(S|R) in Table 4. The
remaining probabilities are listed in Table 6.
Table 2: The probabilities P(LC|UI,DD) of Login/Control
LC given user input UI and database data DD as parent
nodes.
Parent nodes LC=Correct LC=Error
DD=Correct 0.9 0.1
UI=Correct
DD=Error 0 1
DD=Correct 0 1
UI=Error
DD=Error 0 1
Table 3: The probabilities P(R|LC) of Response R given
Login/Control LC as parent node.
Parent node R=Correct R=None
LC=Correct 0.9 0.1
LC=Error 0 1
ROBUSTNESS ANALYSIS USING FMEA AND BBN - Case Study for a Web-based Application
169

Table 4: The probabilities P(S|R) of Severity S given
Response R as parent node.
Table 5: The probabilities P(LC2|R1) of user Re-input RI
given Login/Control LC2 as parent node.
Parent node LC2=Correct LC2=Error
RI=Correct 1 0
RI=Error 0.95 0.05
Table 6: The probabilities P(FR|R1,R2) of Final Response
FR given the two Responses R1 and R2 as parent nodes.
Parent nodes FR=Correct FR=None
R1=Correct R2=Correct 1 0
R1=Correct R2=Error 1 0
R1=Error R2=Correct 1 0
R1=Error R2=Error 0 1
Parent node S=NotCritical S=Critical
R=Correct 1 0
R=None 0 1
WEBIST 2007 - International Conference on Web Information Systems and Technologies
170
