
PLATFORM FOR ELABORATION OF SEARCH RESULTS
Ari Korhonen, Juha Litola and Jorma Tarhio
Department of Computer Science and Engineering, Helsinki University of Technology
P.O. Box 5400, FI-02015 HUT, Finland
Keywords:
Local search engine, clustering, visualization.
Abstract:
We introduce a system called VisElabor that is a platform for elaborating search results. It is a local meta search
engine utilizing general search engines. The system downloads a number of documents from the search results
and is dynamically able to cluster them and show them on multiple views. VisElabor visualizes relations of
documents based on clustering, and it coordinates the information among the views based on user actions in
order to better maintain the user context. In addition, VisElabor has been designed so that it is fairly easy to
integrate new visualizations and other elaborations into the system.
1 INTRODUCTION
The growth of the Internet has turned Internet search
engines into an essential part of the net infrastruc-
ture. Popularity has created competition and search
engines have evolved immensely. However, the gen-
eral user interface of search engines has stayed almost
untouched for a decade. Users enter some keywords
and get in return a linear list of links. Typically, all
the computation is done on the server side without
utilizing growing computing resources of user work-
stations.
On the other hand, even though the details of the
user interface of a single search engine slowly evolve,
there is still room for more sophisticated client side
tools. This is due to the fact that the search results
can be fine tuned if several search engines are used si-
multaneously. This principle is applied in meta search
engines. Our aim is to provide advanced client side
software for such search engines in order to enhance
the information retrieval process.
In this paper, we introduce a system called VisE-
labor, which is running on the client machine and is
able to dynamically cluster search results and to show
several views on them. The idea of VisElabor is to for-
ward a search request to some general search engine
and download around one hundred full documents
from the search results. The further actions are based
on these downloaded documents. The search process
is enhanced by showing the search results in multiple
views that are coordinated by the system. The user
can interact with any of the views. The correspond-
ing data in other views are updated accordingly, and
the changes are highlighted in order to maintain the
context. At any moment, the user may send a refined
search request. Thus VisElabor offers many ways to
explore the Web. VisElabor has been designed so
that it is fairly easy to integrate new visualizations
and elaborations into the system. So VisElabor can
serve as a platform for testing elaborations on search
results. VisElabor was implemented in Java, and it is
freely available under the GPL license
1
.
SnakeT (snaket.com) (Ferragina and Gulli, 2005)
is a well-known open source meta search engine.
There are, however, differences between SnakeT and
VisElabor. SnakeT is a large system with a sophis-
ticated clustering algorithm, whereas VisElabor is a
light system for playing with visualizations. In ad-
dition, VisElabor runs on the client side whereas
SnakeT is merely server side software.
In the next chapter, we are going to outline the
methods how the search results are visualized in gen-
eral. Chapter 3 outlines our approach to clustering.
The implementation of VisElabor is described in
1
http://www.cs.hut.fi/Research/SVG/VisElabor/
263
Korhonen A., Litola J. and Tarhio J. (2007).
PLATFORM FOR ELABORATION OF SEARCH RESULTS.
In Proceedings of the Third International Conference on Web Information Systems and Technologies - Web Interfaces and Applications, pages 263-269
DOI: 10.5220/0001283302630269
Copyright
c
SciTePress
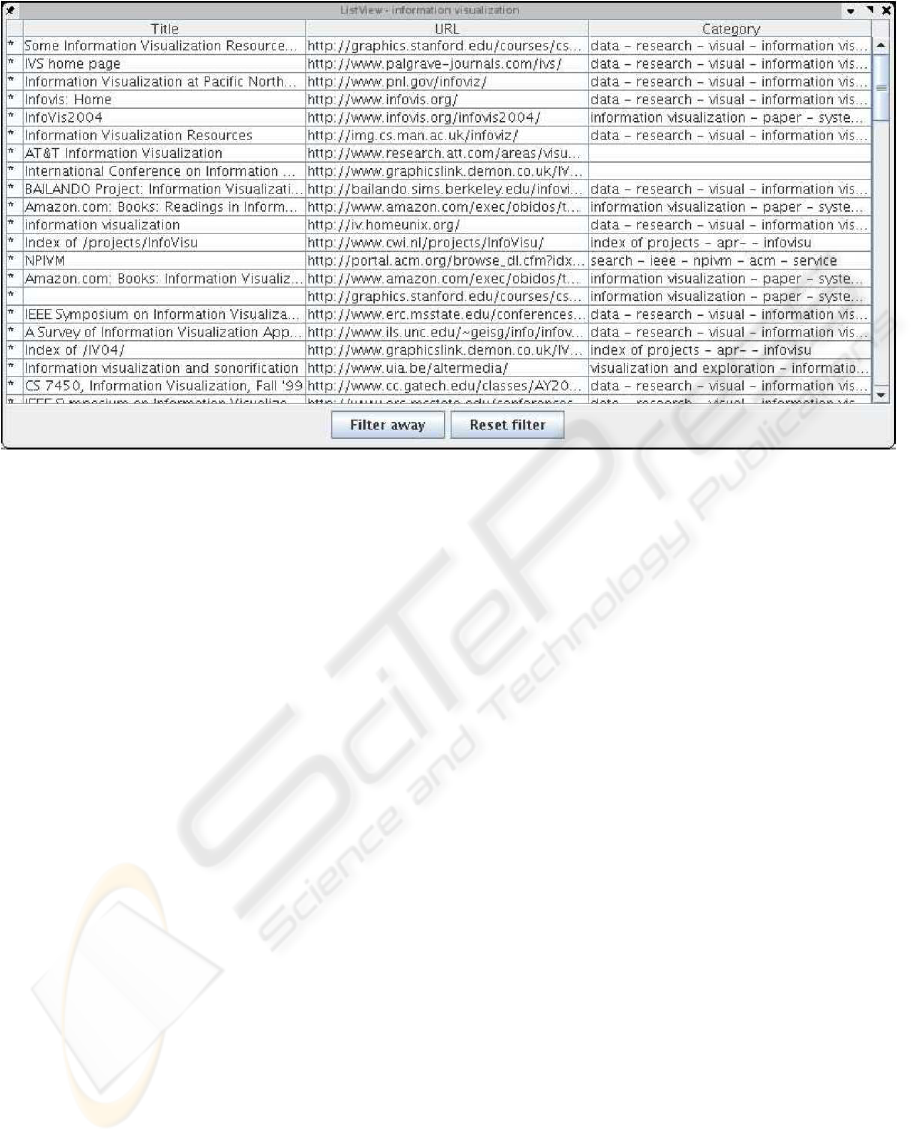
Figure 1: The List View. shows the title, URL, and category of each document matching the query. The list is sorted in order
of ranking given by the search engine applied. By double-clicking an item in the list, the corresponding document is opened
into the Full Text View. It is also highlighted in the Graph View. In addition, the buttons in the bottom of the window can
filter documents out of the search results. Asterisk (*) at the front of line denotes that the full text retrieval is completed. This
view is intended to be used in tandem with the Category View.
Chapter 4, and a use case example is given in Chap-
ter 5. Finally, the significance of the VisElabor is
discussed and ideas on further development are pre-
sented in Chapter 6.
2 VISUALIZATION OF SEARCH
RESULTS
Visualization promotes understanding of information.
We consider how visualization can enhance Internet
searches.
A typical Internet search has four phases.
1. Formulate the search conditions.
2. Launch the search.
3. Review of results.
4. Refine the search conditions.
The phases are closely connected with phases of
creative problem solving (Sutinen and Tarhio, 2001).
Like problem solving, Internet search is a cyclic pro-
cess, where phase 4 is followed by phase 2. There are
visualization techniques for each phase. In this paper
we concentrate on phase 3.
Most techniques visualize relations of a set of
documents usually based on clustering. Typically a
set is visualized as a graph (Mann, 1999) or as a
map (Kohonen et al., 2000), where representations
of related documents are connected by an edge or
are situated close to each other. Another type of
views is associated with relevance numbers. One
visualization of this kind is shown at Thumbshots
(ranking.thumbshots.com), which illustrates the dif-
ference in relevance in two searches on related top-
ics or with different search engines. There are also
techniques to visualize aspects of a single document.
Tilebars (Hearst, 1995) and relevance curves (Mann,
1999) show approximate locations of search key-
words within a document.
Typically there are only few alternatives to sort
textual lists that current search engines provide. The
Kartoo (kartoo.com) and the Mooter (mooter.com)
meta search engines are currently the only search
engines that offer visualization. The visualization
of Mooter is a simple star-like graph of unnested
clusters, whereas Kartoo shows the search results as
a more sophisticated map. Also VisElabor shows
search results as graph based on the TouchGraph
(TouchGraph, 2005) library. A few years ago, Alta
Vista (altavista.com) had a service showing the search
results as a concept map, but this service has been dis-
continued.
Exalead (www.exalead.com) shows thumbnail
WEBIST 2007 - International Conference on Web Information Systems and Technologies
264
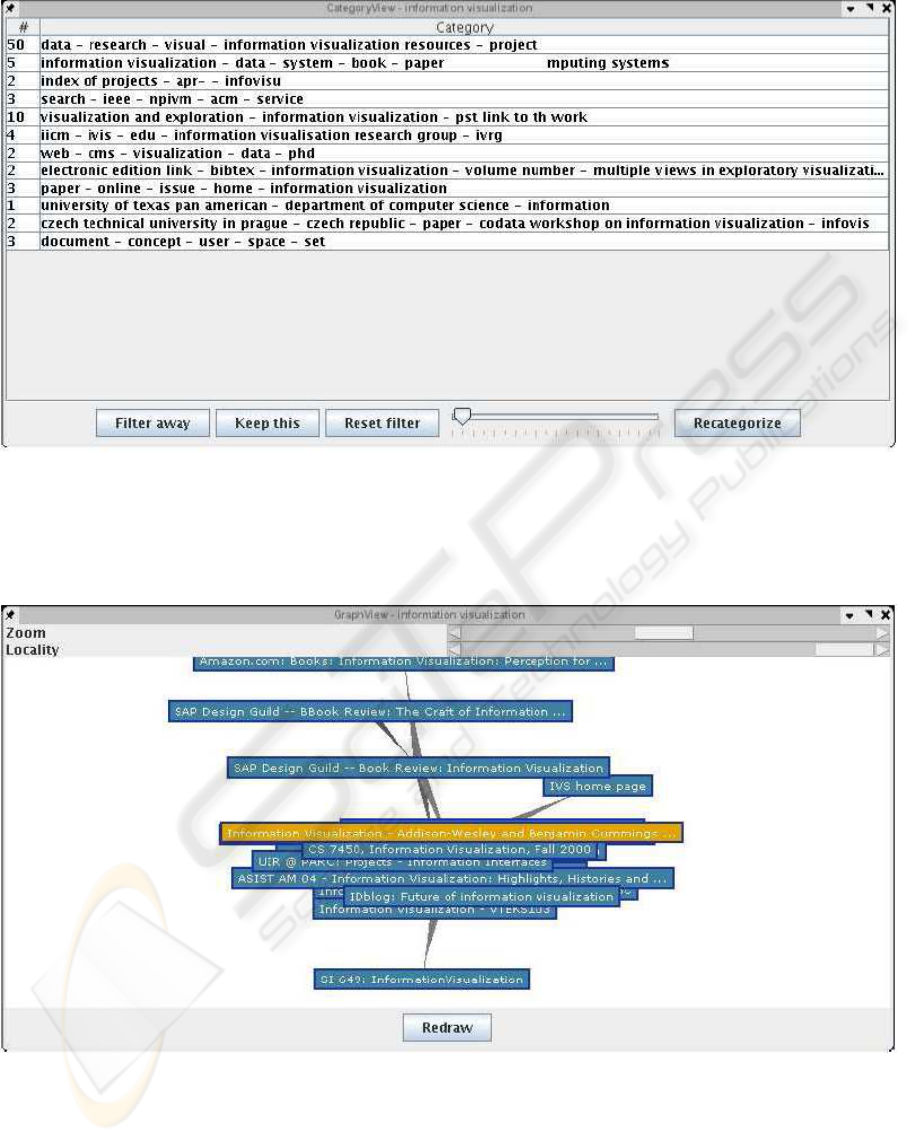
Figure 2: The Category view. shows the names of the categories and the number of documents within a category. The
threshold value described in the previous section to control the creation of new clusters can be changed with the slider bar
at the bottom of the window. The clustering adapts to these changes dynamically or the clustering can be restarted with the
Recategorize button. By double-clicking an item in the list, the corresponding documents within this category are shown in
the List View. In addition, the buttons in the bottom of the window can filter whole categories out of the search results.
Figure 3: The Graph View. represents the relationships among search results. Each node represents a single search result.
Similar nodes are connected with edges: the more alike two search results are the shorter and thicker the edge between them.
The size of the graph can be adjusted with the Locality slide bar, which sets the maximum path length from the selected node.
The view can be zoomed, and explored freely. Selected items are also highlighted in the List View. By double-clicking a
node, the corresponding result is opened in the Full Text View as well. In addition, the right mouse button allows to filter
single documents out of the view. The view was implemented by reusing the TouchGraph library (TouchGraph, 2005).
PLATFORM FOR ELABORATION OF SEARCH RESULTS
265
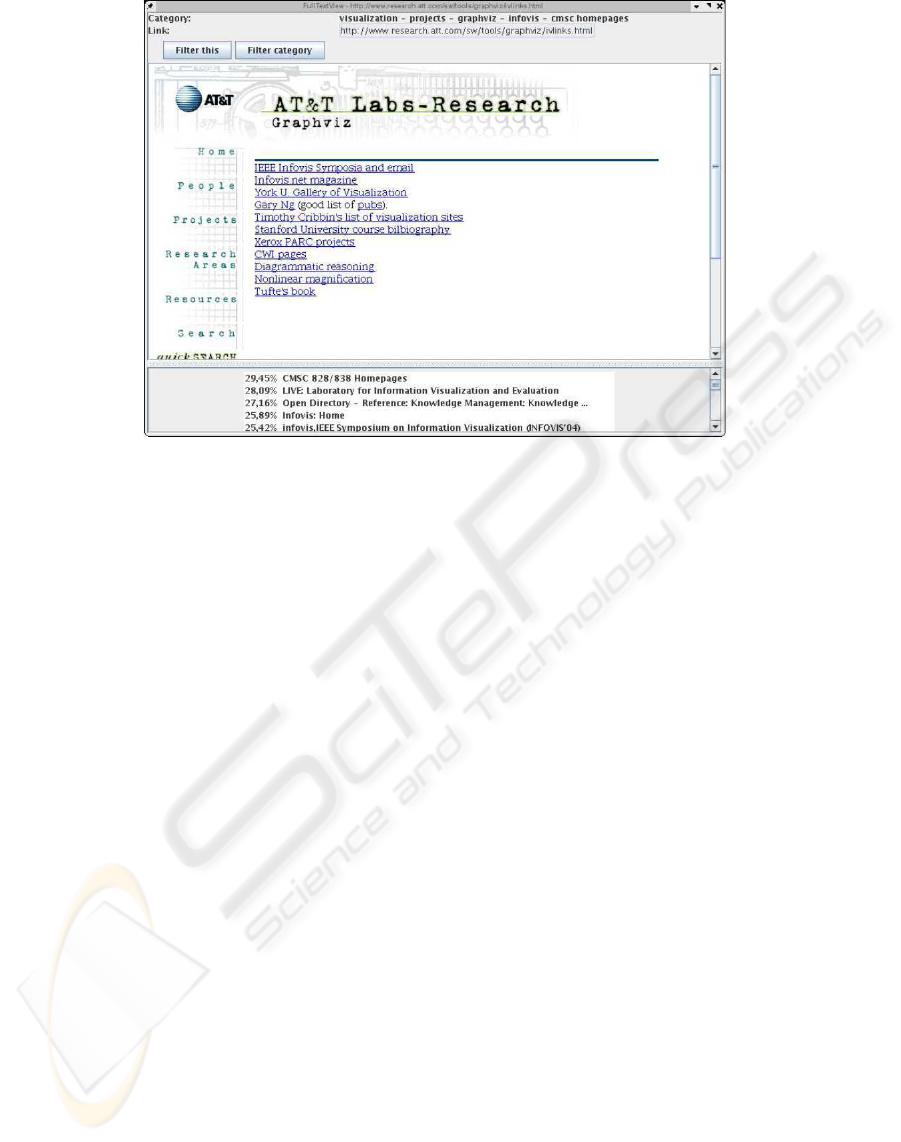
Figure 4: The Full Text View. shows the search results in a simple browser window. In the top of the window, there is an
address field. In addition, the current category is shown above that. A speciality is the list of similar documents in the bottom
of the window that is updated dynamically as new search results are clustered. By double-clicking a document in the list, it is
opened in the Full Text View as well as highlighted in the Graph View. Moreover, search results and categories can be filtered
out with buttons similar to that in the other views.
pictures of found pages. This feature, which used
to work also with MSN search (www.msn.com) helps
the user to quickly pick up the right page, especially
when he misses the right URL for a page seen earlier.
Clusty (clusty.com) provides categories and a quick
preview of a page. Google (google.com) provided a
service called Google Viewer which displayed search
results as a continuous slide show. This service has
been discontinued. Currently VisElabor does not have
any of these quick views, but it would be possible to
adopt some of them.
Google is able to give pages similar to the cur-
rent page. TouchGraph (TouchGraph, 2005) uses
this characteristic and shows the results as a dynamic
graph. The user can extend the graph by selecting an-
other node. TouchGraph is an applet that runs on the
user machine.
3 CLUSTERING
Clustering of search results is not per se associated
with visualization, but it is necessary in order to vi-
sualize categories. Algorithms that apply predefined
categories are complicated to implement and they
need training. For VisElabor we selected straight-
forward dynamic clustering, which was suitable for
our needs. Our algorithm uses the scalar product
based on word chains. This is a fairly common tech-
nique applied in many other clustering algorithms
(Klose et al., 2000). The closer to one the scalar prod-
uct is the more identical word chains two documents
have.
A session starts with submitting a query to a gen-
eral purpose search engine. Currently we use Google,
but it is easy to modify the system to use other engine
or any combination of them. The 100 first documents
of the result are then downloaded. The phases of the
algorithm are the following.
1. Download the full text of the selected documents.
Remove html tags and other parts of the docu-
ments that are not connected with the contents.
2. Divide each document to sentences according to
punctuation marks. From the sentences, form all
possible consecutive chains of at most five words.
Eliminate all chains ending or starting with a stop
word. Store the remaining chains into a chain vec-
tor of each document.
3. Eliminate those chains which appear only once in
the chain vector.
4. Compute the scalar product of the chain vector
with the vector of each other document.
5. Based on the scalar product, associate the docu-
ment with the cluster containing the closest doc-
WEBIST 2007 - International Conference on Web Information Systems and Technologies
266
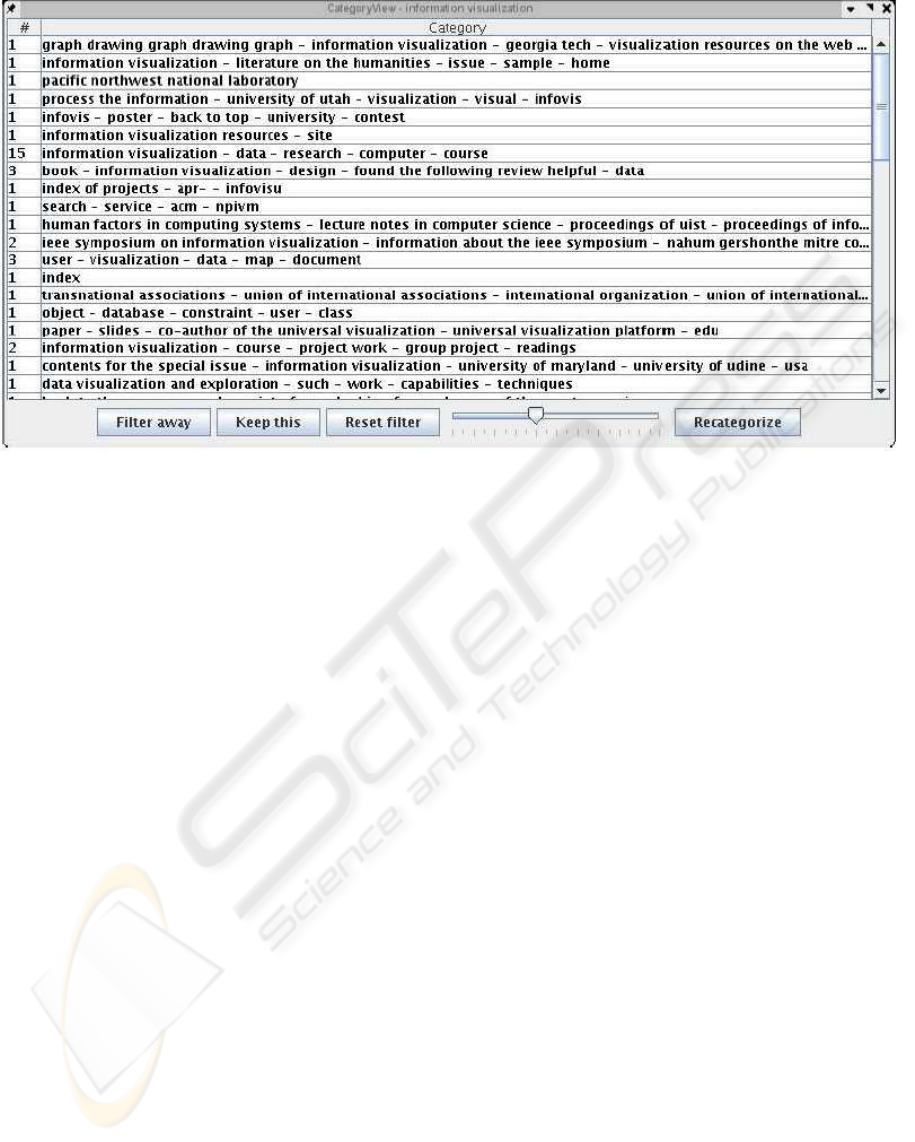
Figure 5: Category View with 40% threshold value.
ument to it. If there is no document closer than a
threshold value, form a new cluster for this docu-
ment.
6. Form the name of a category from the most com-
mon word chains of the category.
Each word chain has a fixed position in the chain vec-
tor, which is a vector of scores. The score is 1.5∗ w∗ c,
where w is the width of the chain and c is the count of
words. We implemented chain vectors as hash tables.
The user controls the creation of new clusters by
changing the threshold value. The name of a category
adapts dynamically to the changes in the category.
Straight-forwardness and easy interaction are the
strengths of our algorithm. It is fast enough for on-
line use, and it works iteratively. The produced clus-
ters or categories are not always relevant, or their
names may be misleading. The current solution pro-
duces clustering of one level. This is sufficient for one
hundred documents used in the tests. For larger sets
of documents, clustering should be hierarchical.
In our tests, the elimination of word chains appear-
ing once and allowing chains of up to five words were
essential features in improving the quality of cluster-
ing.
4 FOUR VIEWS
One way to improve the search process is to utilize
multiple views that can ease the search process (Bal-
donado, Woodruff, and Kuchinsky, 2000). Separate
views, however, need to be interconnected to each
other in such a way that the user can realize how the
information in one view relates to another. Several
techniques exist to achieve this, but the main principle
is that the user should be able to link the information
in all of the views to a single document. Typically this
linking is perceived by selecting a document within
one view, and the corresponding information is high-
lighted also in the rest of the views.
VisElabor displays the search results in four win-
dows and coordinates the information among the
views based on user actions. In Figures 1 to 4, there
are snapshots of a query and the resulting windows:
1. List View (Figure 1)—ordered list of hits based
on the search engine ranking
2. Category View (Figure 2)—ordered list of cate-
gories (clusters) based on cluster size
3. Graph View (Figure 3)—graphical overview of
the documents and their relations
4. Full Text View (Figure 4)—the selected document
in a browser window
5 USE CASE
In addition to the different views described above, the
prototype application has a separate main window in
PLATFORM FOR ELABORATION OF SEARCH RESULTS
267

which the query is entered (the figure of this is omit-
ted due to brevity). One can enter a new query, or
double click an old one to make the search again. As
soon as the query is entered and the search engine(s)
respond(s), the result lines and nodes start appearing
into the List View and Graph View, respectively. An
asterisk at the beginning of a result line indicates that
also the full text has been retrieved.
Meanwhile, the clustering algorithm creates new
categories that start to appear into the Category View.
In the early phase, the number of categories and their
names vary heavily while new full texts are retrieved.
If the task is to have an overview, some 5% thresh-
old would be the most feasible as in Figure 2. Thus,
fewer categories are created and it is easy to filter out
unnecessary results.
By double clicking a category, the List View
shows the corresponding results. Due to the low
threshold value, not all category names are related to
the results. In addition, some categories consist of
empty pages that can be filtered out. After this, the
threshold can be raised (e.g., to 40% as in Figure 5)
in order to focus on single documents. For example,
in order to pick up new expressions that better match
to the query. By lowering and raising the threshold,
it is quite feasible to refine the query and finally pick
up only those documents best matching to the certain
topic of interest.
The Graph View gives additional information
about the documents. Basically, it illustrates how the
documents are related to each other. In Figure 3, for
example, course home pages and text books seem to
have a strong relationship.
6 DISCUSSION
We have demonstrated a way to visualize search
results queried from standard Internet search en-
gines. The implemented system VisElabor dynami-
cally clusters search results and shows the informa-
tion in several views simultaneously. The idea is to
coordinate the information among the views based on
user actions in such a way that the refinement of the
query is easy and straightforward. The aim is to speed
up the cyclic search process by providing better ways
to cope with the large number of documents typically
found in a single query.
VisElabor is running on the client machine. It
sends the search request to a search engine and down-
loads the resulting documents to be clustered dynami-
cally. The results are shown in four separate windows.
The List View is fast to compile as it contains only the
search results retrieved from the search engine.
The Category View is based on the clustering of
the search results. Our clustering algorithm is dy-
namic, i.e. the user sees the evolving stage of cluster-
ing all the time, yet it is possible to interact with the
system at any moment. For example, the first cluster
is ready to be examined as soon as it appears on the
display. The threshold value for new clusters provides
the user with a possibility to work on different views
on the same data.
The Graph View requires that the system is able
to coordinate the information in multiple views and si-
multaneously regain contextual information in case of
real-time updates, i.e., while information constantly
flows in from the search engine. The user should be
able to follow the changes in order to maintain the
context. One way to solve this is to allow updates only
by request. The TouchGraph library we use was de-
signed to be applied in real-time applications. In ad-
dition, the movements of nodes were animated which
is necessary in order to retain the context. Yet, this
requires quite a powerful computer.
Finally, a flexible Full Text View requires a
browser. Fortunately, a simple browser window can
be achieved by utilizing standard libraries. How-
ever, in a real application, more sophisticated browser
would be required.
The most salient point here is the coordination
among the multiple views. Thus, the user can have
better overview of the search results, but he can still
maintain the context due to the automatic coordi-
nation. Even in a dynamic situation in which the
search results are constantly updated as they arrive,
and while the user itself interacts with the results (e.g.,
filters out results, or views a single document).
There are several options to apply VisElabor as
well as develop it further. First, even though our
examples emphasize the client side usage, the sys-
tem can easily be transformed into a server side ver-
sion that has a light browser front end. Second, ad-
ditional visualizations could be implemented so that
more users can find a visual interface that appeals
them. Third, VisElabor could be enhanced with adap-
tive personalized information in order to get more rel-
evant search results. This kind of user model consists
of preferences given directly by the user and of an
adaptive part which is updated after each search re-
quest. Maintaining the model locally without sending
personal information anywhere else is an obvious ad-
vantage. The additional information may be applied
to enhancing the search request or to favoring relevant
categories in clustering.
WEBIST 2007 - International Conference on Web Information Systems and Technologies
268

REFERENCES
M. Q. Wang Baldonado, A. Woodruff, and A. Kuchinsky:
Guidelines for using multiple views in information vi-
sualization. In: Proc. ACM AVI’00, 2000, 110–119.
P. Ferragina and A. Gulli: A Personalized Search En-
gine Based on WebSnippet Hierarchical Clustering.
In: Proc. 14th International World Wide Web Confer-
ence, 2005, 801–810.
M. A. Hearst: TileBars: Visualization of Term Distribution
Information in Full Text Information Access. In: Proc.
ACM CHI’95, 1995, 59–66.
A. Klose, A. Nurnberger, R. Kruse, G. Hartmann, and M.
Richards: Interactive Text Retrieval Based on Doc-
ument Similarities. Phys. Chem. Earth 25 (8), 2000,
649–654,
T. Kohonen, S. Kaski, K. Lagus, J. Saloj
¨
arvi, J. Honkela,
V. Paatero, and A. Saarela: Self Organization of a
Massive Document Collection. IEEE Transactions on
Neural Networks, Special Issue on Neural Networks
for Data Mining and Knowledge Discovery 11 (3),
2000, 574–585.
T. Mann: Visualization of WWW-Search Results. Database
and Expert Systems Applications, 1999. Proceedings.
Tenth International Workshop on, 1999, 264–268.
TouchGraph, 2005. http://www.touchgraph.com/
TGGoogleBrowser.html.
E. Sutinen, J. Tarhio: Teaching to identify problems in
a creative way. In: Proc. FIE ’01, 31st ASEE/IEEE
Frontiers in Education Conference, IEEE, 2001, p.
T1D813.
PLATFORM FOR ELABORATION OF SEARCH RESULTS
269
