
3D MONITORING OF DISTRIBUTED MULTIAGENT SYSTEMS
Sergio Ilarri, Juan L. Serrano, Eduardo Mena and Raquel Trillo
IIS Depart., Univ. of Zaragoza, Mar
´
ıa de Luna 3, 50018, Zaragoza, Spain
Keywords:
Monitoring and debugging, multiagent systems, distributed applications.
Abstract:
In the last years, multiagent systems have been proposed to solve a wide range of applications in distributed
contexts, as they provide many advantages, such as parallelism, robustness, and scalability. A key element for
the performance and reliability of the multiagent system is to design carefully the interaction and synchroniza-
tion among the agents. Particularly, debugging and monitoring multiagent systems is a challenging task due
to the number of agents involved and the complex communication patterns that they may exhibit.
In this paper, we present a 3D interactive monitoring framework that we have developed to observe how the
agents in a multiagent system communicate among themselves and other interesting events. It offers desirable
features, such as the possibility of analyzing communications and events in real-time and also off-line, or
filtering relevant events using queries. Besides, the framework can be easily customized and extended in order
to debug a variety of multiagent systems.
1 INTRODUCTION
Multiagent systems (Wooldridge, 2002) have been
proposed for building distributed applications in fields
such as information retrieval, network diagnosis, dis-
tributed vehicle monitoring, and web services. Thus,
the use of multiple cooperative agents offers some
important advantages, such as parallelism, robustness
and scalability.
However, debugging and monitoring distributed
systems composed of multiple cooperative agents
with a common goal is a challenging task, and
techniques different from those used in other dis-
tributed systems are required (Micalizio et al., 2004;
Poutakidis et al., 2002). Thus, agents in a multiagent
system behave autonomously and may communicate
frequently among themselves following complex and
dynamic cooperation patterns. Therefore, it is usually
very difficult to detect interesting events and potential
problems and their causes in the system’s execution
(e.g., an agent that cannot communicate data when it
is expected because it is busy or the network fails).
A straightforward solution is to request the agents to
keep a log of their actions and/or internal state (e.g.,
communications from/to other agents), so that later
the programmer can analyze the log files to try to de-
tect anomalies. Nevertheless, the scalability of this
solution is very poor, making it unmanageable even
with a moderate set of agents and interesting events.
So, it would be very convenient to have a graphical
monitoring framework that supports querying and in-
teracting in a 3D scenario (with two spatial dimen-
sions and one temporal dimension) in order to find
and visualize appropriately the relevant elements of
the agents’ interactions and actions occurring along
time.
In this paper, we present ADAM3D (Agent De-
bugging And Monitoring in 3D), a monitoring frame-
work developed to analyze how agents communicate
among themselves (which agent starts the commu-
nication, which one is the target agent, information
about what is communicated, etc.) and other interest-
ing events (e.g., agents performing a certain task that
we want to keep track of). The monitoring framework
offers many interesting and novel features which, as
a whole, distinguishes our work from others such
as (Deeter and Vuong, 2004; Chelberg et al., 2000;
Mostafa and Bahgat, 2005). For example, it offers
439
Ilarri S., L. Serrano J., Mena E. and Trillo R. (2007).
3D MONITORING OF DISTRIBUTED MULTIAGENT SYSTEMS.
In Proceedings of the Third International Conference on Web Information Systems and Technologies - Internet Technology, pages 439-442
DOI: 10.5220/0001287104390442
Copyright
c
SciTePress
3D visualization in real-time and query-based filter-
ing of relevant events. Besides, thanks to its modu-
lar and patterned design, the framework can be eas-
ily customized and extended with new functionalities
and graphical elements. Moreover, it is not bound to a
particular multiagent system; on the contrary, it sup-
ports the monitoring of arbitrary multiagent systems
with little or no modifications.
In the rest of the paper, firstly we describe how a
user can interact with ADAM3D in Section 2. Then,
in Section 3, we explain how the framework can be
used for both an off-line and on-line monitoring of
existing multi-agent systems. Finally, in Section 4,
we outline our conclusions and future work.
2 INTERACTING WITH THE
FRAMEWORK
In this section, we describe the main aspects of our
framework from a user’s point of view. We consider
the graphical representation, the interaction facilities
provided, and the possibility to use queries to filter
relevant events.
2.1 Graphical Representation
As opposed to other monitoring tools that show 2D
spatial scenarios, a three-dimensional representation
allows to incorporate the time dimension in the visu-
alization, which is very useful to analyze the situation
globally (e.g., to easily appreciate the duration of the
events or the time elapsed between two events), and
avoids the need of having to focus on just one time in-
stant. Moreover, the use of 3D makes it easier to view
how the agents communicate among themselves, and
it also enhances the user interaction (e.g., the scenario
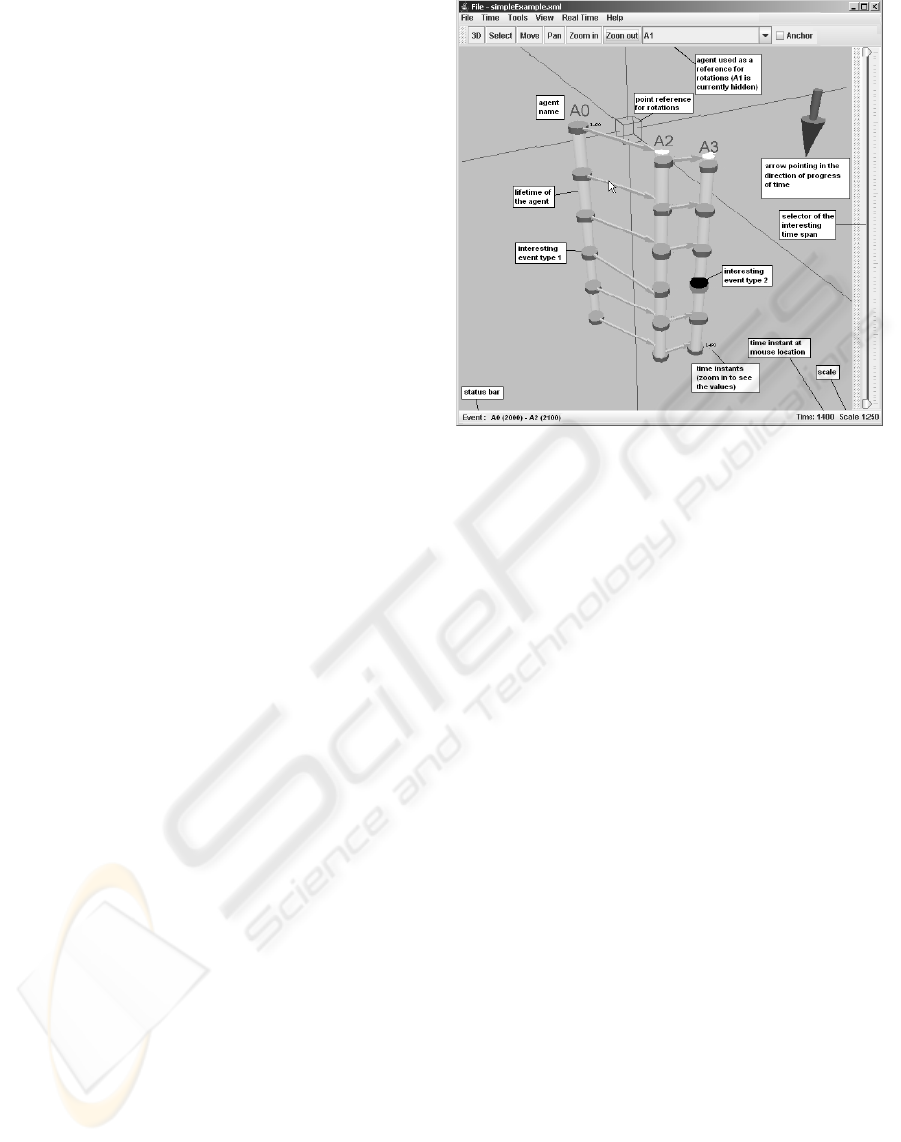
can be scaled to the user’s needs). In Figure 1, we
show a snapshot of ADAM3D for a simple scenario.
As we can see in the figure, agents and interesting
events are painted on a 3D scenario composed of two
spatial dimensions and one temporal dimension:
• The lifetimes of the different agents in the mul-
tiagent system are represented by using cylinders
which indicate the passing of time (time increases
in the direction pointed by the dark arrow on the
upper-right corner of Figure 1), and communica-
tions among agents are indicated by arrows that
go from the agent that originated the communica-
tion to the agent that receives it (the slope of the
arrow indicates the communication delay).
• Apart from agents and communications, different
interesting events (e.g., a certain action performed
Figure 1: Snapshot of ADAM3D.
by an agent) can be shown in the scenario. By
default, these events are indicated using circular
rings of different colors around the cylinder cor-
responding to the agent they refer to. For exam-
ple, the starting of communications by agents are
interesting events in Figure 1.
• A status bar shows information regarding both the
time instant and the event or agent pointed by the
mouse (see the bottom left of Figure 1). For exam-
ple, in the case of an agent, its name and lifetime
(time instants when the agent starts and finishes
its execution) are shown. If it is a communication
event, the time instants when the communication
starts and ends are shown, along with the name
of the origin and target agent and any other inter-
esting information relevant to the communication
(e.g., about the data communicated).
• The agents are automatically placed on the sce-
nario in appropriate locations to facilitate the vi-
sualization and user interaction. Several layout
strategies are available, that distribute the horizon-
tal and vertical space according to the number of
agents to represent. The strategies we have imple-
mented so far assume a hierarchical, tree-like co-
operation structure among the agents. This struc-
ture is inferred from the log events by taking into
account the flow of data communications.
2.2 Interaction Facilities
The user can interact with the scenario in many dif-
ferent ways, such as:
WEBIST 2007 - International Conference on Web Information Systems and Technologies
440

• Selecting the interesting time span. The user can
select an initial and end time instant in order to vi-
sualize only the events occurring within that time
interval. He/she can also jump to a specific time
instant. Finally, it is possible to select the most
appropriate time scale (i.e., time units/pixel).
• Moving and rotating the scenario. By moving the
scenario, the user can focus on the part of the sce-
nario that is interesting to him/her. Similarly, the
user can rotate the scenario around the axis of any
agent (cylinder) selected. In this way, the point of
view of the user can be easily changed in order to
focus attention on the relevant events from a better
perspective: from the top, one side, or any other
position.
• Scaling. Using this functionality, the user can
bring himself/herself closer to the scenario, in or-
der to look at the details (e.g., to distinguish be-
tween different communications that are difficult
to appreciate at the current representation scale).
Similarly, it also allows to view the scenario from
a further position, in order to get a quick overview
of the global situation.
• Automatic adjustment of the point of view. A user
can set any point of view by moving, rotating and
scaling, as explained before. Alternatively, it is
also possible to find an appropriate point of view
by default (i.e., one that allows to see all the ob-
jects with a scale that fits the screen), depending
on the objects represented in the scenario and their
distribution.
• Moving agents. The user can select any agent and
move it to other location in the scenario, for exam-
ple, in order to separate it from other elements that
make its visualization difficult. The arrows linked
to the agent are adjusted automatically according
to the new location of the agent.
• Hiding agents. By hiding the agents that are not
considered interesting, the visibility in the sce-
nario can be enhanced, allowing the user to focus
on the relevant elements. A hidden agent can be
shown if the user considers it interesting again in
the future, or it can also be removed permanently.
• Selecting sets of agents. The previous two op-
erations (moving and hiding agents) are usually
applied to individual agents. However, it is also
possible to select several agents and consider the
selected set as a unit from the point of view of a
subsequent operation, saving interaction time.
2.3 Filtering of Events Using Queries
Due to the huge number of events that may take place
in a multiagent system, a critical feature that a mon-
itoring framework should provide is the capability
to help the user to easily filter the relevant data and
find the source of problems (Poutakidis et al., 2002).
Therefore, in ADAM3D we support queries that al-
low to retrieve statistics and interesting events with-
out having to navigate through the 3D scenario (plain
SQL, predefined queries and query templates can be
used). With this purpose, we store the logged events
in an event database that can be queried using SQL.
We can distinguish two types of queries:
• Queries for visualization. In this case, we can
retrieve the agents and events that satisfy certain
conditions, and build a 3D scenario only with the
elements that satisfy them in order to analyze it.
• Information queries. These are queries that re-
trieve values obtained by applying aggregate func-
tions (e.g., max -maximum-, avg -average-, min
-minimum-, etc.) on the events.
Combining the expressive power and flexibility of
queries with a 3D visualization is extremely interest-
ing. It helps the user to find anomalies, in the way
the multiagent system is performing, that otherwise
would be very difficult to detect by consulting indi-
vidual log files.
3 ON-LINE AND OFF-LINE
MONITORING
In our framework, any multiagent system can be mon-
itored (on-line and off-line) by just adding an event
logging capability to the agents (i.e., the agents must
log the events that we want to monitor), which should
be easy. The multiagent system could be executed
with different logging levels, depending on our mon-
itoring interests. We consider the following types of
events, but any other can be easily added: start (an
agent starts its execution), communication (communi-
cation of data), movement (a mobile agent (Ilarri et al.,
2006) travels to another computer), action (which can
be used to represent any interesting action that the
agents in the monitoring system may perform; e.g.,
in a certain multiagent system, we can consider an
action event that represents that the agent is query-
ing a database), and end (an agent finishes its execu-
tion). We propose an extensible XML format for the
event logs, as this facilitates the subsequent analysis
by providing a clear structure to the different events;
3D MONITORING OF DISTRIBUTED MULTIAGENT SYSTEMS
441

the labels used are defined in a DTD (Document Type
Definition) file.
For off-line monitoring, which takes place
once the interesting cooperative task has finished,
ADAM3D relies on agent message log files (files con-
taining the history of the interesting events). These
log files must follow the XML structure mentioned
previously
1
. The log files can be generated in dif-
ferent ways. For example, in order to minimize the
logging overload, the agents may record the interest-
ing events in internal variables and write them to a
file on the local disk periodically. Notice that if the
agents are mobile (Ilarri et al., 2006) (i.e., they move
between computers), several log files could be gener-
ated by the agents on different computers: those files
will be appended together for later analysis.
Besides an off-line analysis from log files, it is
also possible to visualize the events and interact with
the 3D scenario in real-time, allowing the on-line
analysis of running agent systems. With the real-
time monitoring capability, the different interesting
events are visualized by ADAM3D as they occur. For
this, ADAM3D launches a monitoring server that lis-
tens on the specified communication port on the local
computer. The agents in the multiagent system that
we want to monitor must be configured in order to
send their events to the monitoring server, instead of
using log files. As in the previous case, if we want
to monitor a multiagent system whose events do not
comply with the XML format required, an intermedi-
ate module can be easily inserted between the agents
and the monitoring server to perform the translation.
We consider that both the off-line and the on-line
monitoring capabilities are interesting. An off-line
monitoring minimizes the overhead imposed on the
multiagent system, as agents do not need to commu-
nicate the events to the monitoring server during their
execution; moreover, in situations of network over-
load, obtaining an accurate view of the system is only
possible by inspecting traces post mortem (Liedek-
erke and Avouris, 1995). We could also use the on-
line monitoring until some problem is observed, and
then analyze why it happened.
4 CONCLUSIONS
In this paper we have presented ADAM3D, a moni-
toring framework for multi-agent systems. Its main
1
Nevertheless, if event logs are already maintained by
the agents in the system that we want to monitor, we can
easily write a translator that converts these logs into the for-
mat required by ADAM3D: in this way, the original agent
system suffers no modifications.
features are:
• It provides 3D representations, which greatly en-
hances the visualization and user interaction.
• Queries can be used to filter the events and obtain
interesting information, which we consider a key
feature to aid in debugging multiagent systems.
• It supports a real-time visualization of the events
generated and also an off-line analysis.
As future work, we plan to analyze the conve-
nience of showing the locations of the different agents
interacting in a distributed system (by situating them
on a map of computers).
ACKNOWLEDGEMENTS
Supported by the CICYT project TIN2004-07999-
C02-02.
REFERENCES
Chelberg, D. M., Gillen, M., Zhou, Q., and Lakshmikumar,
A. (2000). 3D-VDBM: 3D visual debug monitor for
RoboCup. In IASTED International Conference on
Computer Graphics and Imaging (CGIM’00), pages
14–19.
Deeter, K. and Vuong, S. T. (2004). AgentViz: A visualiza-
tion system for mobile agents. In First International
Workshop Mobility Aware Technologies and Applica-
tions (MATA’04), pages 339–348.
Ilarri, S., Trillo, R., and Mena, E. (2006). SPRINGS:
A scalable platform for highly mobile agents in dis-
tributed computing environments. In 4th Interna-
tional WoWMoM 2006 workshop on Mobile Dis-
tributed Computing (MDC’06), pages 633–637. IEEE
Computer Society.
Liedekerke, M. V. and Avouris, N. (1995). Debugging
multi-agent systems. Information and Software Tech-
nology, 37(2):103–112.
Micalizio, R., Torasso, P., and Torta, G. (2004). On-line
monitoring and diagnosis of multi-agent systems: A
model based approach. In 16th Eureopean Conference
on Artificial Intelligence (ECAI’04), pages 848–852.
Mostafa, H. and Bahgat, R. (2005). The agent visualiza-
tion system: a graphical and textual representation
for multi-agent systems. Information Visualization,
4(2):83–94.
Poutakidis, D., Padgham, L., and Winikoff, M. (2002). De-
bugging multi-agent systems using design artifacts:
the case of interaction protocols. In First International
Joint Conference on Autonomous Agents and Multi-
Agent Systems (AAMAS’02), pages 960–967. ACM
Press.
Wooldridge, M. (2002). An Introduction To MultiAgent Sys-
tems. John Wiley and Sons.
WEBIST 2007 - International Conference on Web Information Systems and Technologies
442
