
A DATA-DRIVEN DESIGN FOR DERIVING USABILITY METRICS
Tamara Babaian, Wendy Lucas and Heikki Topi
CIS Department, Bentley College, Waltham , MA 02452, USA
Keywords:
Enterprise information systems, data modeling, user input logs, usability.
Abstract:
The complexity of Enterprise Information Systems can be overwhelming to users, yet they are an often over-
looked domain for usability research. To better understand the ways in which users interact with these systems,
we have designed an infrastructure for input logging that is built upon a data model relating system compo-
nents, user inputs, and tasks. This infrastructure is aware of user representations, task representations, and
the history of user interactions. The interface components themselves log user inputs, so that timing data and
action events are automatically aligned and are linked to specific tasks. The knowledge gained about user
interactions at varying levels of granularity, ranging from keystroke analysis to higher-level task performance,
is a valuable resource for both assessing and enhancing system usability.
1 INTRODUCTION
Enterprise systems link processes from across the or-
ganization under one umbrella. While one of the
defining characteristics of these systems is the large
and well-documented set of structured tasks that they
support, users can be overwhelmed by the variety of
available options and the multiple paths through the
system for completing processes composed of several
subtasks (Topi et al., 2005). Despite being employed
extensively for critical business functions, these sys-
tems often suffer from poor usability and can be very
difficult to learn. In this paper, we describe our ap-
proach to leveraging information that can be derived
from user input logs generated from interactions with
such a system. This research is motivated by the goal
of improving the design of user-system interactions
and, consequently, the usability of enterprise-wide in-
formation systems.
Most of the tasks in an enterprise system are im-
plemented as sequences of input forms. In the ex-
perimental system we have developed for studying
users’ interactions with enterprise systems, we explic-
itly represent the relationships between system tasks
and the interface pages that implement them. This
experimental system and the data collected from its
use is exploited for high-level reasoning about sys-
tem usage and usability. We show how this improved
understanding of system use can also lead to various
interface enhancements.
Our infrastructure enables automatic logging of
user interactions with the interface and makes the log
data available to the system. Input-aware components
are used to track input data and associate it with the
user who entered it. The model underlying this in-
frastructure represents and links users, tasks, interface
components, application domain data, and user input
logs. The input log data can be used for a variety
of purposes, including deriving user profiles, model-
ing tasks, assessing the usability of the system, and
supporting interface adaptation. Contributions of the
research presented here include:
• a model that relates user interface components,
user input, task structure and domain data, and
• an approach to automated analysis of system
use that can be applied to systems ranging from
single-user to enterprise-wide applications.
In the following sections, we describe how users
and tasks performed with a system are modeled in our
infrastructure and detail our component-enabled ap-
proach to user input logging. We then discuss how
user profiles and models of the relationships between
users and tasks can be formed from the input logs. We
154
Babaian T., Lucas W. and Topi H. (2007).
A DATA-DRIVEN DESIGN FOR DERIVING USABILITY METRICS.
In Proceedings of the Second International Conference on Software and Data Technologies - Volume ISDM/WsEHST/DC, pages 154-159
DOI: 10.5220/0001334701540159
Copyright
c
SciTePress

also show how the logged data can be used for deriv-
ing usability assessments and personalizing the user
experience.
2 RELATED WORK
User input logging for subsequent log analysis was
introduced a long time ago and has been used in mul-
tiple contexts. A known but infrequently used benefit
from the collected data is the usability measures that
can be derived from the logs without the need for any
special equipment or experiments. Ivory and Hearst
(Ivory and Hearst, 2001) present a review of a wide
variety of usability evaluation automation techniques
and discuss the challenges of these types of evalua-
tion as well as the characteristics of the surveyed ap-
proaches. As a step towards enabling applications to
automatically collect usage data, Olsen and Harversen
(Olsen and Halversen, 1988) present a User Interface
Management System that augments each user inter-
face component with the capability to log user input.
KALDI (Al-Qaimari and McRostie, 2006) is a graph-
ical toolkit for automatic recording and visualization
of the usage data. An implentation of the detailed
tracking of users’ interactions with a website via an
HTTP proxy that intercepts client-server communi-
cations and extends the client application with us-
age logging capabilities is presented in (Atterer et al.,
2006).
Usage data has been used almost exclusively for
extending the functionality of automated tutoring,
recommender, and adaptive hypermedia applications
(e.g. (Linton et al., 2000; Brusilovsky and Cooper,
2002)). Within these types of systems, the user-
system interaction data is used for tracking and as-
sessing the competency of the user with a topic or task
and adjusting the scope, content or presentation of the
material based on this assessment. Some of these sys-
tems employ a direct representation of the tasks and
their hierarchical decomposition (e.g. (Brusilovsky
and Cooper, 2002)) in order to relate the user model
to particular tasks and their components.
The approach presented in this paper takes advan-
tage of user logging for usability assessment and for
application enhancements in the domain of enterprise
systems. What distinguishes our research is the ex-
plicit representation of the task model as a composi-
tion of interface components within the system’s data
model. The presented model links users, tasks, inter-
face components and the application’s domain data,
enabling sophisticated reasoning about the history of
system usage on different levels: from focusing on a
single input mechanism, to discovering user roles as
a combination of frequently co-occurring tasks. An
important aspect for the domain of enterprise systems
is the ability afforded by this infrastructure to trace
back the content of the application’s domain data to
the particular set of users who entered it.
3 THE MODEL
Users of Enterprise Resource Planning (ERP) sys-
tems and other enterprise systems enter text into text
fields, select items from menus and list structures,
mark check boxes, and click on links. In order to
capture such inputs to a system, we have defined an
experimental infrastructure in which all components
that accept user input are based on a common archi-
tecture that implements logging of that input. The
logged data is accessible to the system and provides a
full history of the users’ interactions.
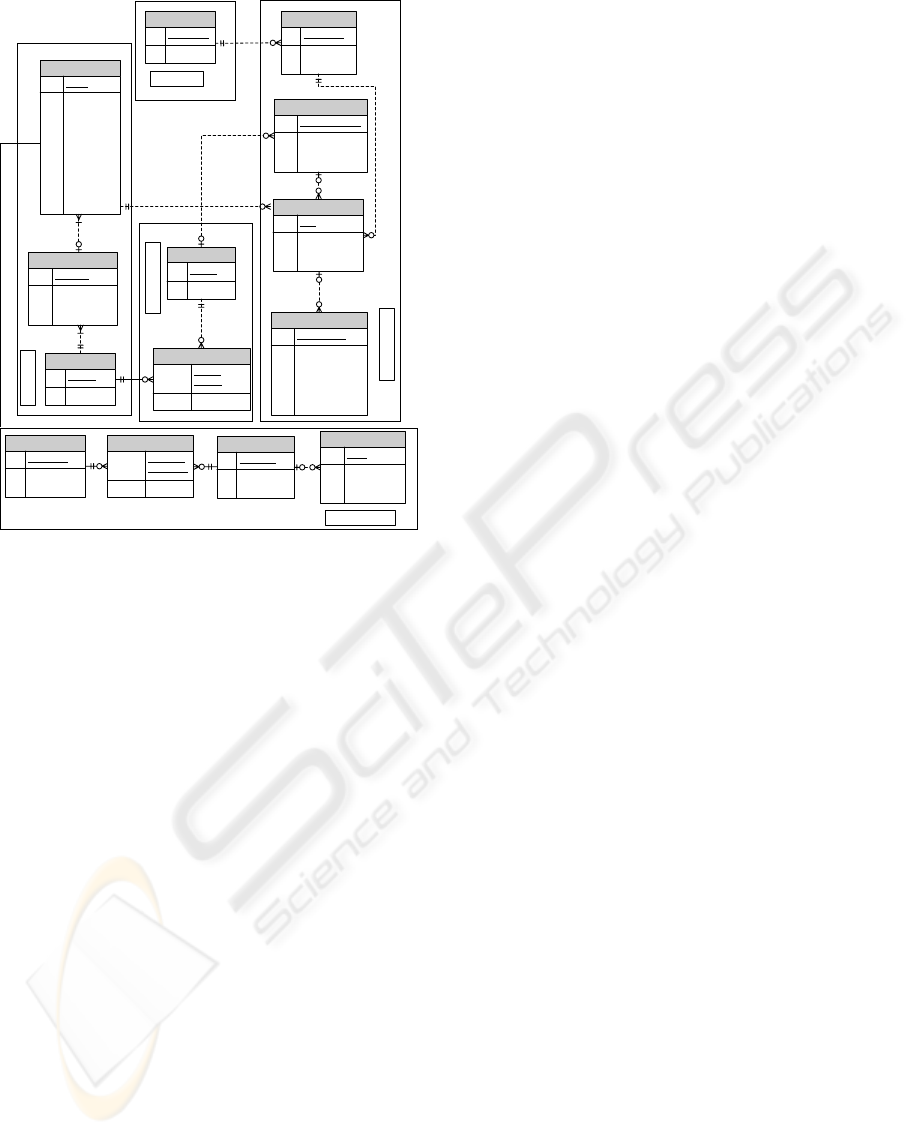
Figure 1 illustrates the relationships between the
users, the data they enter, the input controls be-
ing used and their groupings into task-related pages,
the tasks being performed with those pages, and the
domain-specific process related to those tasks. We
have developed a prototype that uses this model in
the implementation of a Purchase Requisition Process
from an ERP system. The major components in the
model are defined as follows. Domain data is the
part of the model that stores the business data. User
represents the user information. UI Concept includes
entities representing the user interface components,
their grouping on interface pages, and their relation-
ship to the domain data. The Task Concept compo-
nent represents tasks as named collections of interface
pages. The Tracking component contains the entities
that record the interaction history: which tasks and in-
put controls were enacted, when, and what data was
entered.
User, Task and UI Concepts form the static com-
ponents of the model, i.e., they represent the data that
does not change during system use. The Domain and
Tracking modules are dynamic.
3.1 Domain, User, Task and Ui Concept
The Domain data portion of the model represents
the business data, such as the description of materi-
als, vendors, purchase requisitions and other relevant
entities. This is the standard part of any information
system that stores and manipulates data in support of
business operations.
Multiple users are represented in the User entity.
The UI Concept module defines the composition
of the interface and its connection to the domain data.
The most basic entity of this module is the InputCon-
trol, which provides a specification for a user-input
A DATA-DRIVEN DESIGN FOR DERIVING USABILITY METRICS
155
Entryfield
PK efID
instanceNbr
FK1 SessionID
FK2 TaskInstanceID
Group
PK GroupID
repeat_number
display
FK1 PageID
InputControl
PK IC_ID
ItemName
Columns
ValueType
Size
SQL
SelectorField
Description
TargetTable
TargetField
DefaultValue
FK1 GroupID
PurchaseRequisition
PK PRID
PRDesc
DeliveryDate
FK1 VendorID
User
PK UserName
FullName
UserSession
PK SessionID
SessionStart
SessionEnd
UserEntry
PK UserEntryID
BeforeData
Keystrokes
BeginTimeStamp
EndTimeStamp
AfterData
FK2 efID
Page
PK PageID
Description
TaskPage
PK,FK1 TaskID
PK,FK3 PageID
SequenceNbr
TaskInstance
PK TaskInstanceID
startTime
endTime
FK1 TaskID
Task
PK TaskID
TaskName
Vendor
PK VendorID
VendorName
VendorDesc
VendorMaterial
PK,FK1 VendorID
PK,FK2 MaterialID
Material
PK MaterialID
MaterialName
MaterrialDesc
User
Tracking
Task Concept
UI Concept
Domain Model
Figure 1: Components of the data model.
component. It contains attributes that define the for-
mat of the input control (ItemName, Columns, Value-
Type, Size, e.g.) and the way by which it is connected
to (a) the domain data and (b) the task in which it is
used.
To establish a relationship with the domain data,
InputControl table entries specify where the data that
is displayed by or entered into the component is stored
in the Domain model. For example, the SQL attribute
specifies the SQL code for retrieving the set of possi-
ble values for this input control, while the TargetTable
and TargetField attributes specify where the values
from the instances of this InputControl will be saved.
Data values that are not retrieved from or stored in the
Domain data, such as calendar dates, are handled as
special cases.
To describe the higher level composition of the in-
terface, InputControls form collections at two levels:
Groups and Pages (i.e., distinct interface screens). In-
putControls are linked to Tasks through the Groups
and Pages collections.
A Task Concept lists the tasks implemented by
the system and describes their composition in the
form of a numbered sequence of interface pages.
Each page can potentially be associated with multi-
ple tasks; therefore, the entity TaskPage is required to
identify the specific tasks associated with a page.
3.2 Tracking
The Tracking module contains the data that is dy-
namically collected each time the system is invoked.
It represents the history of the users’ interactions with
the system. Below we describe the entities of the
Tracking module and the way they are populated with
data when the system is being used.
When a user logs into the system, a new UserS-
ession record is created. It records the identity of the
user as well as the start time of the session in the Ses-
sionStart attribute. The end time of the session will be
captured upon the log off in the SessionEnd attribute.
After the user declares his intention to work on
a particular task by selecting it from a menu, the sys-
tem creates a new record in the TaskInstance table that
references the selected task’s record in the Task table.
Each TaskInstance is associated with the correspond-
ing UserSession that links it to the user.
The system simultaneously determines the first
TaskPage of the task’s interface and renders the con-
tent of the page based on the specification of groups
of input controls, which it obtains from the associ-
ated records in the UI component. When a widget
described in the InputControl associated with the cur-
rent page is created and added to the displayed inter-
face, the system creates a record of the new instance
of that InputControl in the EntryField table. This dis-
tinguishes the multiple instances of the same Input-
Control that can be created in the course of a single
session.
Each input component created from an InputCon-
trol specification has the capability of logging user
keystroke and mouse button press data directed to it.
This data is periodically saved in the UserEntry ta-
ble. A record in the UserEntry table specifies the time
when the input component gained the focus of user in-
put in the BeginTimeStamp attribute, the keystrokes
(or mouse events) that were made (Keystrokes at-
tribute) until the time when the widget lost focus
(EndTimeStamp), and the content of the widget upon
gaining and losing focus (BeforeData, AfterData).
The redundancy in replicating the content of the field
is deliberate and supports more efficient reasoning:
instead of trying to deduce the content upon the end
of the recorded interaction, we save it explicitly in the
AfterData field.
To summarize, the Tracking module records user
input in the form of key strokes and mouse presses in
the UserEntry table, which is connected through the
EntryField to specific TaskInstances and InputCon-
trols. UserEntry is also related to a particular User
through EntryField and UserSession.
ICSOFT 2007 - International Conference on Software and Data Technologies
156

4 USING LOG DATA
A well-known challenge in utilizing the data collected
via logging information at the keystroke level is the
problem of aggregating it in order to relate that data
to higher level tasks (Ivory and Hearst, 2001). The
meta-model presented above allows the grouping of
specific data entry events along a variety of dimen-
sions, including users, tasks, and various interface
components. These groupings are possible because
of the richness of the model, which links individual
data entry records to interface pages, thereby provid-
ing a description of the context of each record. Fur-
thermore, the provided description of the composition
of individual tasks from user interface components al-
lows one to derive and analyze usage patterns related
to tasks. Such analysis can be extended to logged data
from a group of users, providing even more informa-
tion about the way the system is utilized. The results
from this analysis can be applied to assessing the us-
ability of the system and improving its design.
4.1 Usability Metrics
The ISO (ISO, 1998) defines usability as the effective-
ness, efficiency, and satisfaction with which specified
users achieve specified goals using a particular inter-
face. Effectiveness refers to the accuracy and com-
pleteness with which the users achieve their goals.
Efficiency refers to resources expended in relation to
the accuracy and completeness of goals achieved, and
satisfaction denotes the comfort and acceptability of
the system to its users and other people affected by its
use.
In the domain of enterprise systems, individual
tasks represent a part of a larger business process. For
example, a purchase requisition is part of the larger
ordering process. A business process may span across
multiple human participants and extend over multiple
days. The individual tasks performed as part of a pro-
cess are connected, in that the completion of one may
be a prerequisite for the completion of another. There-
fore, it is often useful to analyze usage data over not
just one task, but over a sequence of tasks.
Once a sequence of tasks has been identified, the
database structure allows us to retrieve information
regarding the entire sequence of interest (based on
StartTime and EndTime attributes from TaskInstance)
and its individual components. The time between the
component tasks can also be estimated. This allows
for the detection of users suffering from navigation
problems, as indicated by a large amount of time spent
moving from one user interface component to another.
A detailed analysis of the rows in the UserEntry
table can help identify which input components are
particularly prone to erroneous data entries, correc-
tions, extra keystrokes, and other similar user actions
that indicate confusion or difficulty in understanding
the requirements of a particular element of a task. An
analysis at the keystroke level can also reveal ineffi-
cient methods for entering data.
4.2 Enhancements for Imporoving
Usability
The log data provides information related to the user’s
familiarity and competency with the system at several
levels of detail. At the lowest level, it is possible to
observe how many times a person has interacted with
a particular input field. At a higher level, the log data
can reveal how many times a user has worked on a
particular task or on a sequence of tasks. The number
of times measure is an approximation for familiarity.
Furthermore, a more competent user is expected to
make fewer changes to an entry field and to complete
a task in a shorter period of time. This information
can be derived by relating data regarding user entries
to particular entry fields as well as to task instances
and task sequences.
Such information can then be used to dynami-
cally personalize the system to more effectively meet
the needs of the user. For example, users who typ-
ically have difficulties with particular tasks could be
directed to more detailed help instructions, while ex-
perienced users could be provided with shortcuts and
tips commensurate with their abilities.
The knowledge gained by analyzing an individ-
ual user’s behavior can be even more valuable if aug-
mented with knowledge of all users of the system. For
example, by considering the sequences of tasks per-
formed by a group of users, we can identify the roles
of those users and determine the types of difficulties
they are encountering. This will provide additional in-
formation on those parts of the interface that require
attention and how the system can be enhanced to ben-
efit users in particular roles.
As with the information on individual users, data
from groups of users can be dynamically derived from
the user logs. Components can then be designed to
provide more (or less) assistance based on the amount
of time users typically spend interacting with them.
Sequences of tasks can be grouped in the interface
based on paths typically followed by one user or by
groups of users. Tasks that are found to be difficult for
many users can have more assistance options offered
with them in the short term and be redesigned in the
longer term.
A DATA-DRIVEN DESIGN FOR DERIVING USABILITY METRICS
157
4.3 Illustrative Examples
To validate our approach to automated input logging
and analysis of log data, we have developed a pro-
totype system that uses the model from Figure 1 to
store domain, task, interface and user input tracking
data. Four people who had never used this prototype
were asked to work on a typical ERP task of creating
a purchase requisition. The users were given a man-
ual describing the functions of the system. The data
for four purchase requisitions of relatively similar size
was also provided in textual form.
Based on the log data obtained from this experi-
ment, we can automatically derive a variety of useful
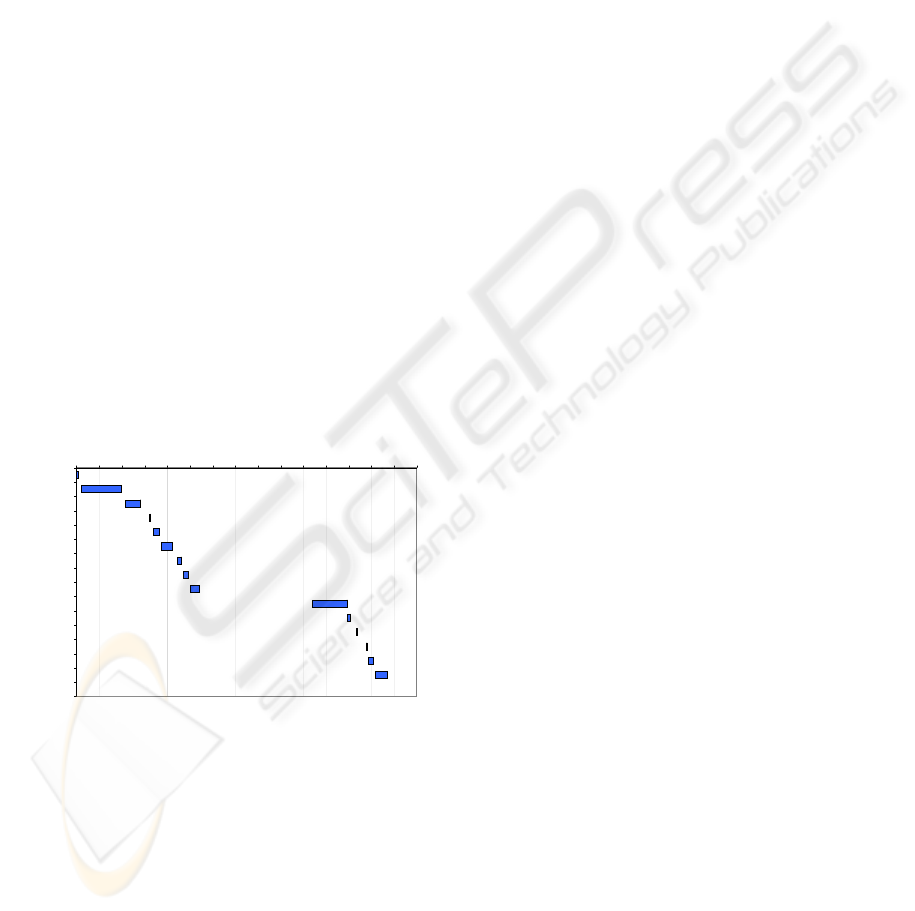
views and usage measurements. For example, Figure
2 depicts the timeline that shows the sequence of sub-
task instances as performed by one of the users. For
demonstration purposes, the figure is limited to about
70% of the actual subtask sequence. The subtasks
are listed on the left-hand side in chronological order.
Horizontal bars depict the timing and duration of user
interactions with a particular task interface via mouse
clicks and keystrokes. Horizontal gaps between the
bars represent the transition time between consecutive
subtasks. This visualization was created with MS Ex-
cel charting tools using data derived by aggregating
and querying the tables in the UI, Task, and Tracking
modules of the data model (Fig. 1).
0 100 200 300 400 500 600 700 800 900 1000 1100 1200 1300 1400 1500
Select Task
PReq. Defaults
PReq. Line items
Select Task
PReq. Defaults
PReq. Line items
Select Task
PReq. Defaults
PReq. Line items
Add Material
Add Vendor
Add Material
Select Task
PReq. Defaults
PReq. Line items
. . .
Time (sec)
Figure 2: Chronological history of tasks performed by one
of the users.
The data in the graph shows the user’s interactions
in creating four purchase requisitions, each beginning
with a PReq. Defaults subtask. The user’s first inter-
action with each subtask involved in the purchase req-
uisition task tends to take longer than subsequent in-
teractions with the same subtasks. The transition time
between subtasks also follows this pattern, with that
time gradually decreasing as the user gains more ex-
perience with the interface. The transition to a newly
encountered requirement involving a new set of sub-
tasks takes a significant amount of time, as evidenced
by the large gap in the middle of the chart where the
user moves from PReq. Line Items to Add Material.
The availability of more detailed usage data al-
lows us to zoom in on this transition episode to fur-
ther investigate what occurred during that time pe-
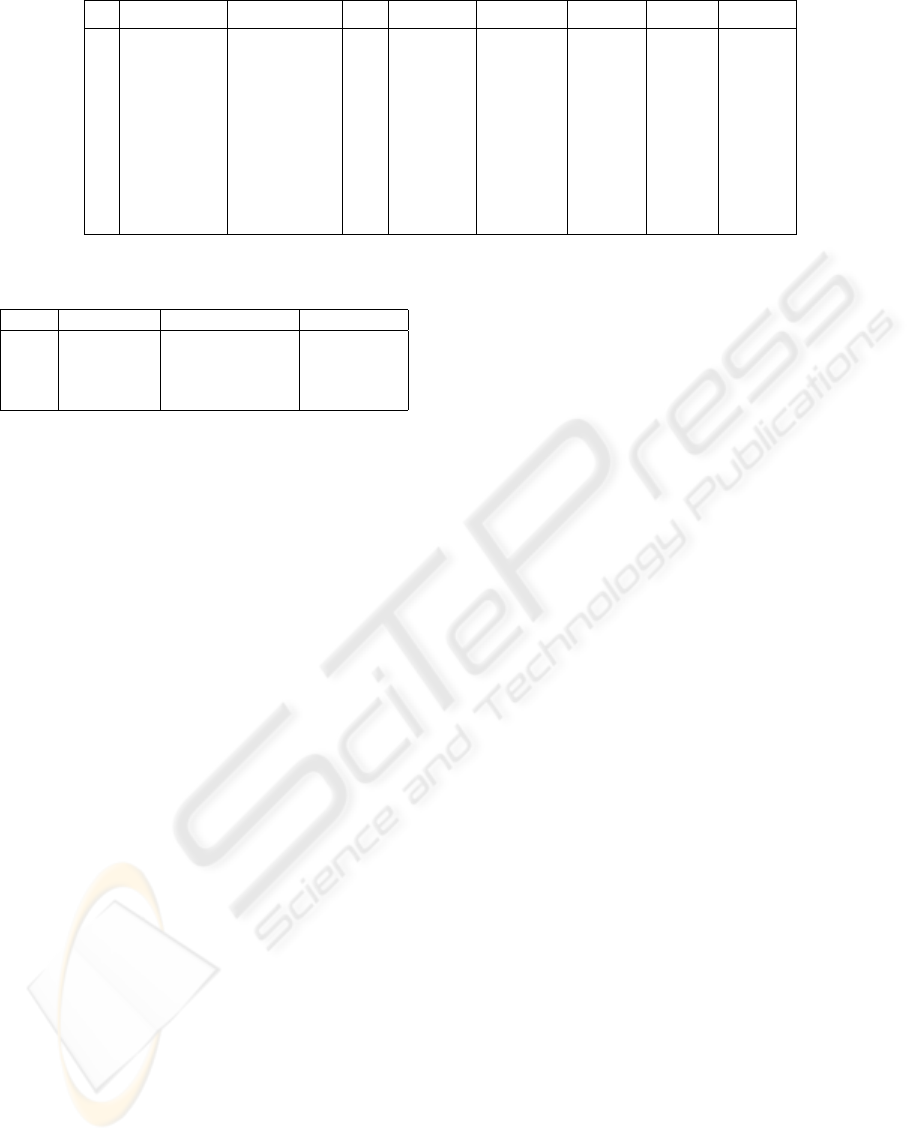
riod. Figure 3 presents the details of the interaction
around the time of this transition. The table shows the
name of the subtask (TaskName column), the name
of the input field to which user input was directed
(ItemName column), and the field’s id (efID column).
The entries in the Keystrokes column designate the
sequence of keystrokes or mouse press and release
events. Each hpressi event for an input field triggers
the display of a list of possible values from which the
user can select an entry for the field. A hreleasei item
corresponds to the closing of this list of values. For
each row in the table in Figure 3, BeginTime and End-
Time designate the beginning and ending timestamps
for keyboard or mouse invocations. The content of
the field upon the end of an interaction is shown in
the AfterData column.
The data in this table allows us to reconstruct the
likely sequence of events: As the user was specify-
ing a value for the Vendor field of PReq. Line Items
task interface, she invoked the display of possible val-
ues and selected a value of 3, as evidenced by en-
tries in the second and third row containing hpressi
and hreleasei events, respectively. The user subse-
quently tried to add a new vendor (Office Max) by ac-
cessing the Add Material and then the Add Vendor
task interfaces. The data indicates some confusion on
the part of the user: before proceeding to the specifi-
cation of the New Vendor Name in the Add Vendor
task interface as prescribed by the user manual, she
tried to enter the information regarding the new ven-
dor through the Vendors field of the Add Material
interface, as captured by row number 4 of the table.
Since the Vendors input field is not designed for en-
tering new values, the data was invalidated by the sys-
tem and erased from the content of the Vendors field
with efID 116. That is why the next row in table in
Figure 3 (row number 5) shows an empty string in
the AfterData column following a press of the mouse
button.
Figure 4 is a simple illustration of the ability to
aggregate data from multiple users, as afforded by
our approach. It presents the breakdown of the total
time spent by each of the four users on keyboard en-
try within the interface pages implementing the pur-
chase requisition task versus the time spent in selec-
tion of possible values and transitions from one inter-
face component to another. It is interesting to note
that usr3, who spent the least amount of time on key-
board input, was the only one to not complete the task
successfully. Even from this small set of values, one
ICSOFT 2007 - International Conference on Software and Data Technologies
158
# TaskName ItemName efID Keystrokes ElapsedTime BeginTime EndTime Afterdata
. . .
1 PReq. Line items Delivery Date 86 hreleasei 0 527 527
2 PReq. Line items Vendor 88 hpressi 0 540 540 3
3 PReq. Line items Vendor 88 hreleasei 0 542 542 3
4 Add Material Vendors 116 Office Max 21 1041 1062 Office Max
5 Add Material Vendors 116 hpressi 0 1120 1120
6 Add Material Vendors 116 hreleasei 0 1124 1124
7 Add Material Vendors 116 hpressi 0 1131 1131
8 Add Material Vendors 116 hreleasei 0 1137 1137 9
9 Add Material Vendors 116 hBKihBKi10 6 1137 1143 10
10 Add Material Vendors 116 office max 25 1173 1157 office max
11 Add Vendor New Vendor Name 121 office max 12 1195 1207 office max
12 Add Material Vendors 116 hpressi 0 1233 1233
13 Add Material Vendors 116 hreleasei 0 1239 1239
. . .
Figure 3: Details of chronological history. All time values are specified in seconds.
User Total Time DataEntry Time Difference
usr1 2216 221 (10%) 1995 (90%)
usr2 1561 45 (3%) 1516 (97%)
usr3 1415 101 (7%) 1314 (93%)
usr4 1815 136(7%) 1679 (93%)
Figure 4: Statistics of time spent on keyboard data entry
compared to the rest of the activities involved in completing
the entire task by each of the four users.
can see how useful estimates of the percentage of time
spent on keyboard input can be derived. In a similar
fashion, we can obtain measures estimating the transi-
tion times between tasks or between individual input
fields within a given task interface.
While the examples presented here are based on a
very small dataset, they illustrate the types of infor-
mation that can be gleaned from user input logs that
are linked via components to tasks.
5 CONCLUSIONS
We have described an infrastructure that supports the
tracking of user input data via input-aware compo-
nents and the automatic association of that data with
the user who entered it, the task that required it, and
the changes to the domain data resulting from it. The
declarative manner in which we define the interface
supports logging of user input and the subsequent at-
tribution of that data to specific interface pages. This
results in the automatic collection of usability-related
data that highlights the difficulties users face in work-
ing with this type of system, the types of problems
most commonly encountered, how users address their
own user entry errors, and the most commonly fol-
lowed navigational paths.
The next stage in this research is to conduct ex-
perimental studies using our prototype. The resulting
user logs will be evaluated using the metrics described
in this paper. Such assessments can then be applied to
addressing shortcomings in the design, personalizing
the interface, and providing better support to the user.
For enterprise systems in particular, which require
substantial investments in user training, an additional
benefit is the ability to focus training on those areas
identified by the automated usability assessments as
being most problematic for users.
REFERENCES
ISO 9241-11 (1998). Ergonomic requirements for office
work with visual display terminals (VDTs) – part 11:
Guidance on usability.
Al-Qaimari, G. and McRostie, D. (2006). Evaluating user
performance using KALDI: A computer-aided usabil-
ity engineering tool. In Proceedings of the IASTED
Conf. on Software Engineering, pages 242–251.
Atterer, R., Wnuk, M., and Schmidt, A. (2006). Knowing
the user’s every move: user activity tracking for web-
site usability evaluation and implicit interaction. In
WWW, pages 203–212.
Brusilovsky, P. and Cooper, D. W. (2002). Domain, task,
and user models for an adaptive hypermedia perfor-
mance support system. In IUI ’02: Proceedings of the
7th international conference on Intelligent user inter-
faces, pages 23–30, New York, NY, USA. ACM Press.
Ivory, M. Y. and Hearst, M. A. (2001). The state of the art
in automating usability evaluation of user interfaces.
ACM Comput. Surv., 33(4):470–516.
Linton, F., Joy, D., Schaefer, H.-P., and Charron, A. (2000).
Owl: A recommender system for organization-wide
learning. Educational Technology & Society, 3(1).
Olsen, D. R. and Halversen, B. W. (1988). Interface usage
measurements in a user interface management system.
In UIST ’88: Proceedings of the 1st annual ACM SIG-
GRAPH symposium on User Interface Software, pages
102–108, New York, NY, USA. ACM Press.
Topi, H., Lucas, W., and Babaian, T. (2005). Identifying
usability issues with an ERP implementation. In Pro-
ceedings of the International Conference on Enter-
prise Information Systems (ICEIS-2005), pages 128–
133.
A DATA-DRIVEN DESIGN FOR DERIVING USABILITY METRICS
159
