
AN EFFICIENT ALGORITHM TO COMPUTE MAX/MIN VALUES
IN SLIDING WINDOW FOR DATA STREAMS
Ying Sha and Jianlong Tan
The Software Division, Institute of Computing Technology, Chinese Academy of Sciences, Beijing, China
Keywords:
Max/Min, Sliding Window, Data Streams.
Abstract:
With the development of Internet, more and more data-stream based applications emerged, where calculation
of aggregate functions plays an important role. Many studies were conducted on aggregation functions; how-
ever, an efficient algorithm to calculate Max/Min values remains an open problem. Here, we propose a novel,
exact method to computer Max/Min values for the numerical input data. Employing an incrementally calcu-
lating strategy on sliding windows, this algorithm gains a high efficiency. We analyze the algorithm and prove
the time-complexity and space-complexity in worst cases. Experimental results confirm its high performance
on a testing dataset.
1 INTRODUCTION
With the development of Internet, more and more
data-stream based applications emerged, such as fi-
nancial applications (Cortes et al., 2000),telephone
monitoring applications(Gilbert et al., 2001),etc.
Generally speaking, a data stream is a sequence of
data elements that enter into a data-stream processing
system in order.(Dani and Getta, 2005; Guha et al.,
2001; Henzinger et al., 1998); in other words, the ar-
rival of input data is instant, continuous, and dynamic.
For the limit of both memory space and time of re-
sponse, only a small part of the input data sequence
can be stored when a query is being processed. Here,
we use sliding window to denote the latest n data ele-
ments.
Aggregate functions, the functions that compute
out a single value from a group of values, are impor-
tant to a data-stream system since query should be re-
sponded in real time. The common functions include
COUNT, SUM, AVG, Max, and Min(Dobra et al.,
2002). An aggregate function calculation method is
exact if it always returns the exact value for a given
query; otherwise, it is an approximate one. This pa-
per focused on developing an efficient exact calcula-
tion method to calculate Max/Min value in a sliding
window of data streams. In this paper, we only con-
sider the situation that the window fits in memory.
The basic idea of the method in this paper is to
simulate the data sequence in sliding window as a
broken curve, and only the data elements between
crests(troughs) of the broken curve is stored as his-
torical data. Thus the new Max value can be calcu-
lated by comparing the value of the latest data el-
ement with the historical data, avoiding saving and
scanning the whole previous data. Theoretical analy-
sis shows that the time-complexity is O(N logM)and
the space-complexity is O(M) in worst case, where N
is the number of the input data elements and M is the
size of sliding window; and experimental results con-
firms the high performance of this method. In (Cor-
mode and S.Muthukrishnan, 2003)the authors prove
that finding the maximum in a sliding window of size
m, is impossible in space O(m). But this paper also
consider the situation that the window does not fit in
memory. It is more difficult.
The remainder of the paper is organized as fol-
lows. Section 2 describes the algorithm to comput-
ing Max/Min value; Section 3 analyzes the time-
complexity and space-complexity as well; Section 4
shows the experimental results; Section 5 concludes
the whole paper.
123
Sha Y. and Tan J. (2007).
AN EFFICIENT ALGORITHM TO COMPUTE MAX/MIN VALUES IN SLIDING WINDOW FOR DATA STREAMS.
In Proceedings of the Second International Conference on Software and Data Technologies - Volume ISDM/WsEHST/DC, pages 123-128
DOI: 10.5220/0001338101230128
Copyright
c
SciTePress

2 ALGORITHM TO COMPUTE
MAX/MIN VALUE BASED ON
SLIDING WINDOW
2.1 Basic Idea
Let X = x
1
, x
2
, . .. , x
n
denote the arriving data se-
quence, W denote the width of the sliding window.
We only consider the situation that the window fits
in memory. In a diagram showing sliding window, x-
axis represents time, and y-axis is the value of the data
element. A newly arriving data will be inserted into
the window from right, and step out of the window
from left when expire. Calculation of the Max/Min
value is executed when a new data element arrives or
an old data element steps out of the sliding window,
which are described in more details as follows:
Case 1.New data element arrives
We only need to store the current Max value of
the sliding window. Let Max
n−1
be the current Max
value of the sliding window before a new data ele-
ment x
n
arrive, the new current Max value Max
n
can
be calculated as follows:
Max
n
=
x
n
if x
n
>= Max
n−1
Max
n−1
if x
n
< Max
n−1
(1)
In the same way, we can get the new current Min value
Min
n
:
Min
n
=
x
n
if x
n
<= Min
n−1
Min
n−1
if x
n
> Min
n−1
(2)
We can save Max
n
and Min
n
as historical data.
Case 2. Old data element steps out
When old data element expires, some data ele-
ments should be saved as historical data. First we
need simulate the data sequence in the sliding win-
dow as a broken curve. Figure 1 illustrates the various
cases of removing old data element from the window.
case a: The data sequence in the sliding window
monotonically increases.
Max In order to get the Max value, we only need
to save one data element, the wave crest of the
broken curve, as the historical data.
Min In order to get the Min value, we need to
save all elements in the sliding window(The
data elements in blue).
Max/Min In order to get both Max value and Min
value, we need to save all elements in the slid-
ing window.
case b: The data sequence in the sliding window
monotonically decreases.
Max In order to get the Max value, we need to
save all elements in the sliding window(The
data elements in red).
Min In order to get the Min value, we only need
to save one data element, the wave trough of the
broken curve, as the historical data.
Max/Min In order to get both Max value and Min
value, we need to save all elements in the slid-
ing window.
case c: The data sequence in the sliding window con-
tains an increasing part followed by a decreasing
part. It includes three cases.
• case c1:
Max In order to get the Max value, we
need to save elements between the crest and
the newest data element in the sliding win-
dow(The data elements in red).
Min In order to get the Min value, we only
need to save one data element, the newest data
element(The data element B).
Max/Min In order to get both Max value and
Min value, we need to save elements between
the crest and the newest data element in the
sliding window(The data elements in red).
• case c2:
Max In order to get the Max value, we
need to save elements between the crest and
the newest data element in the sliding win-
dow(The data elements in red).
Min In order to get the Min value, we only
need to save one data element, the newest data
element(The data element B).
Max/Min In order to get both Max value and
Min value, we need to save elements between
the crest and the newest data element in the
sliding window(The data elements in red).
• case c3:
Max In order to get the Max value, we
need to save elements between the crest and
the newest data element in the sliding win-
dow(The data elements in red).
Min In order to get the Min value, we need
to save elements between the trough and
the newest data element in the sliding win-
dow(The data elements in blue).
Max/Min We need to save elements between
C and B for Max value( The data elements in
read), and elements between A and D for Min
value.
case d: The data sequence has multiple peaks and
troughs.
ICSOFT 2007 - International Conference on Software and Data Technologies
124
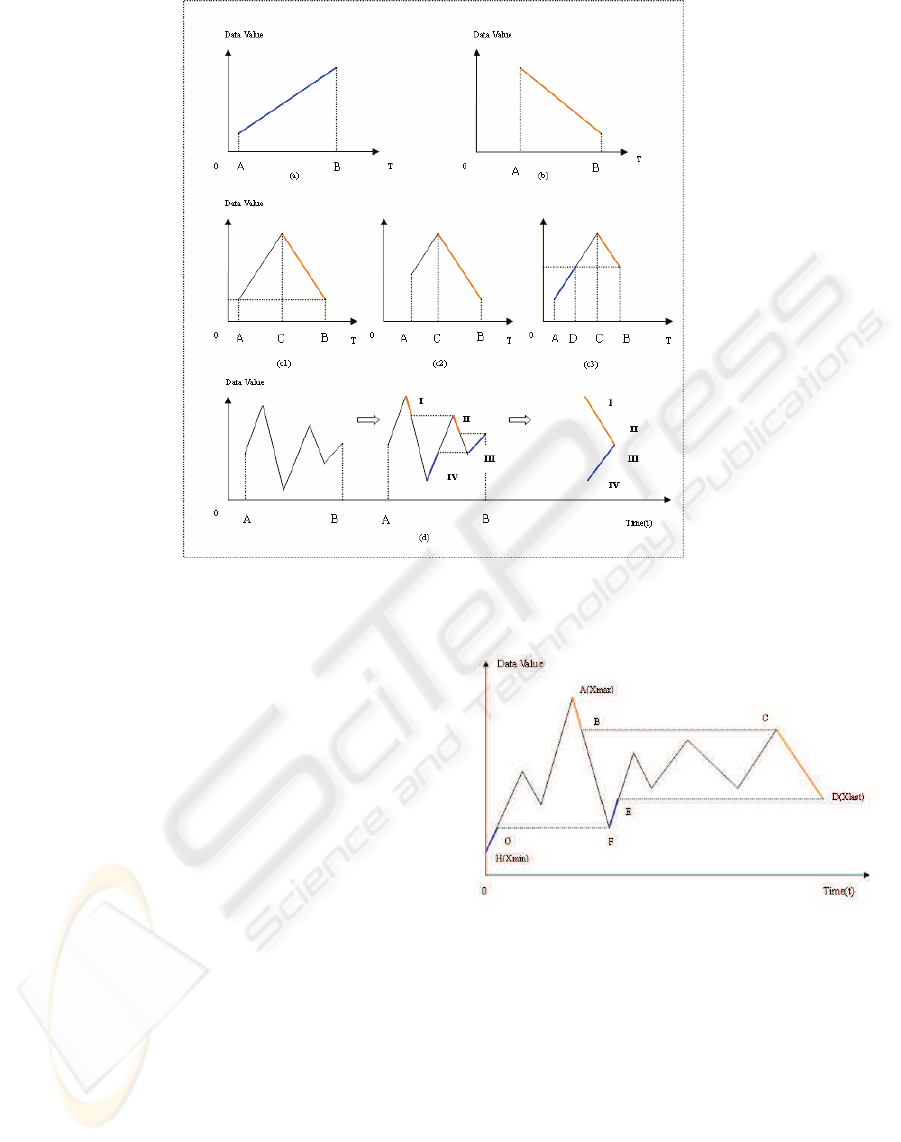
Figure 1: Analyze all kinds of broken curves simulated by data stream.
Max In order to get the Max value, we can trans-
form it into case c by compress operation, that
is, recursively remove the data elements be-
low the right crest. Thus only the decreasing
part(the data elements in red, I and II ) should
be saved as the historical data.
Min In order to get the Min value, we can also
use the compress operation. Thus only the in-
creasing part (the data elements in blue, III and
IV) should be saved as the historical data.
Max/Min Thus the historical data is a data se-
quence in order including two parts: 1. I and II
for Max value; 2. III and IV for Min value.
According to the discussion of case a,b,c and d, a
data sequence in the sliding window can be simulated
as a broken curve(Figure 2). We can ”compress” the
broken curve. The historical data for Max value are
the data elements whose value is between Max value
and the value of the newest data element, and these
data elements are in the ”downgrade”,”outboard” of
the broken curve. The historical data for Min value
are the data elements whose value is between Min
value and the value of the newest data element, and
these data elements are in the ”upgrade”,”outboard”
of the broken curve. For example, in Figure 2, the
historical data for Max value are AB part and CD
Figure 2: The broken curve simulated by data list:X =
x
1
, x
2
, . . . , x
k
, x
k+1
, . . . , x
n
.
part(the data elements in red); the historical data for
Min value are the data element D, EF part and GH part
(the data elements in blue and the the newest data el-
ement). When multiple maximum(minimum) values
exists, that is to say that there are some data elements
which have the same value, we only need to save the
newest data element.
AN EFFICIENT ALGORITHM TO COMPUTE MAX/MIN VALUES IN SLIDING WINDOW FOR DATA STREAMS
125

2.2 Algorithm Description
Let X = x
1
, x
2
, . . . , x
n
denote the data sequence, W is
the size of the sliding window, x
max
denote the current
Max value of the data sequence in the sliding window,
x
min
denote the current Min value of the data sequence
in the sliding window, x
last
denote the newest data el-
ement in the sliding window, X[history] denote the
historical data need to save. Using the idea of sec-
tion 2.1 get the historical data. X[history] includes
X[hist
max
] and X[hist
min
]. X[hist
max
] is used for get-
ting the Max value, X[hist
min
] is used for getting the
Min value. X[hist
max
] and X[hist
min
] are all in order.
X[hist
max
] is from x
max
to x
last
, X[hist
min
] is from x
last
to x
min
.
case 1: When new data element x
new
inserts into
the sliding window
Update Max value (the new current Max value:
x
′
max
):
x
′
max
=
x
new
if x
new
>= x
max
x
max
if x
new
< x
max
(3)
Update Min value (the new current Min value:
x
′
min
):
x
′
min
=
x
min
if x
new
> x
min
x
new
if x
new
<= x
min
(4)
Update historical data X
′
[hist
max
]:
X
′
[hist
max
] =
X[hist
max
] + x
new
ifx
new
< x
last
X[hist
max
] − x
last
+ x
new
ifx
new
= x
last
H[hist
max
](x
max
, x
new
) + x
new
if x
new
> x
last
(5)
Update historical data X
′
[hist
min
]:
X
′
[hist
min
] =
X[hist
min
](x
new
, x
min
) + x
new
if x
new
< x
last
X[hist
min
] − x
last
+ x
new
if x
new
= x
last
H[hist
min
] + x
new
if x
new
> x
last
(6)
case 2: When old data element x
old
expires,
Update Max value(the new current Max value:
x
′
max
):
x
′
max
=
max{x
i
|x
i
6= x
max
, x
i
∈ X[hist
max
]} if x
old
= x
max
x
max
if x
old
6= x
max
(7)
Update Min value(the new current Min value:
x
′
min
):
x
′
min
=
min{x
i
|x
i
6= x
min
, x
i
∈ X[hist
min
]} if x
old
= x
min
x
min
if x
old
6= x
min
(8)
Update historical dataX
′
[hist
max
]:
X
′
[hist
max
] =
X[hist
max
] − {x
max
} if x
old
= x
max
X[hist
max
] if x
old
6= x
max
(9)
Update historical dataX
′
[hist
min
]:
X
′
[hist
min
] =
X[hist
min
] − {x
min
} if x
old
= x
min
X[hist
min
] if x
old
6= x
min
(10)
2.3 The Implementation of Algorithm
From the above sections, we know that the historical
data includes X[hist
max
] and X[hist
min
]. X[hist
max
] is
used for getting the Max value, X[hist
min
] is used for
getting the Min value. X[hist
max
] and X[hist
min
] are all
in order. We use a array max[] to represent X[hist
max
]
which is from the Max value to x
last
in monotonic
decrease order, a array min[] to represent X[hist
min
]
which is from the Min value to x
last
in monotonic in-
crease order. We use LastValue to represent x
last
. So
MaxValue=max[0], MinValue=min[0].
The details of the algorithm of computing
MAX/MIN function as follows:
Case 1: insert new data element into the sliding
window
void InsertData(const void *pData) {
if(*pData >= MaxValue)
//MaxValue is the current Max value
MaxValue = *pData;
else {
if(*pData <= MinValue)
// MinValue is the current Min value
MinValue = *pData; }
//Update the historical data
if(*pData < LastValue){
max[].append(*pData); // Update max[]
min[].insert(*pData); // Update min[]
/* insert *pData into the array min[]
which is in order. */
min[].delete(*pData,LastValue);
/* delete all data elements which
are large than the *pData. */ }
else {
if(*pData > LastValue){
max[].insert(*pData); // Updat max[]
/* insert *pData into the array max[]
which is in order. */
max[].delete(*pData,LastValue);
/* delete all data elements
which are less than the *pData. */
min.append(*pData); // Update min[]}
else {
max[LastValue]=*pData;
ICSOFT 2007 - International Conference on Software and Data Technologies
126
min[LastValue]=*pData;
/* replace the last element of max/min array
with the new data element. */
} } }
Case 2: delete old data element from the sliding
window
void DeleteData(const void *pData) {
if(*pData == MaxValue){
max[].delete(0);
/* delete the first element of the array. */
MaxValue=max[0]; // Update the Max value }
else {
if(*pData == MinValue) {
min[].delete(0);
//delete the first element of the array.
MinValue=min[0];//Update the Min value.
}}}
3 SPACE AND TIME
COMPLEXITY
The time complexity of computing Max/Min function
is mainly determined by looking up process. When a
new data element which inserts into the sliding win-
dow is less than the current Max value or large than
the current Min value, this algorithm need to find the
proper position for this data element.
Suppose the length of data sequence is N. The size
of the sliding window is M. When a data element x
k
inserts into the sliding window, x
k
is less than the cur-
rent Max value or large than the current Min value.
There are K data elements in Memory block, then the
time complexity of finding the proper position of x
k
is O(logK). So the time complexity of computing
Max/Min function is O(N logM) in worst case. It is
easy to know that the space complexity of comput-
ing Max/Min function is O(M) in worst case, because
we only consider the situation that the window fits in
memory.
4 EXPERIMENTAL STUDY
In this section, we present the results of an extensive
experimental study of our methods of Max/Min func-
tions using the random data as input data elements.
The type of input data element is double.
Let TotalCount denote the total number of data el-
ements inserts into the sliding window. These data
elements insert into the sliding window and step out
of the sliding window. Let MaxStoreCount denote the
Table 1: sliding window size=100, input data=50000.
No AvgStoPer MaxStoCount
1 10.37 32
2 10.38 32
3 10.43 32
4 10.38 32
5 10.43 32
6 10.35 30
7 10.35 30
8 10.50 32
9 10.35 32
10 10.50 32
11 10.50 32
12 10.30 32
13 10.30 32
14 10.30 32
15 10.30 32
16 10.30 32
17 10.35 32
18 10.34 32
19 10.36 32
20 10.35 32
max number of data elements need to save. Let Avg-
StorePercent denote the average percent of the num-
ber of data elements need to save according to the size
of the sliding window.
In this experiment, let TotalCount be
500000, the size of sliding window is
100,200,500,1000,5000,10000,50000,1000-00,then
record MaxStoreCount(the max number of data
elements need to save) and AvgStorePercent(the
average storage percent). In order to improve the
correction of the experiment, we do 20 times ex-
periments on the same size of sliding window, then
compute the average value of MaxStoreCount and
AvgStorePercent.
Table 1 shows the results of total 20 times ex-
periments (TotalCount=500000, the size of slide win-
dow=100).Table 2 gives the average results of differ-
ent size of sliding windows. We take 20 times exper-
iments for each size of sliding windows, then get the
average value of these experiments.
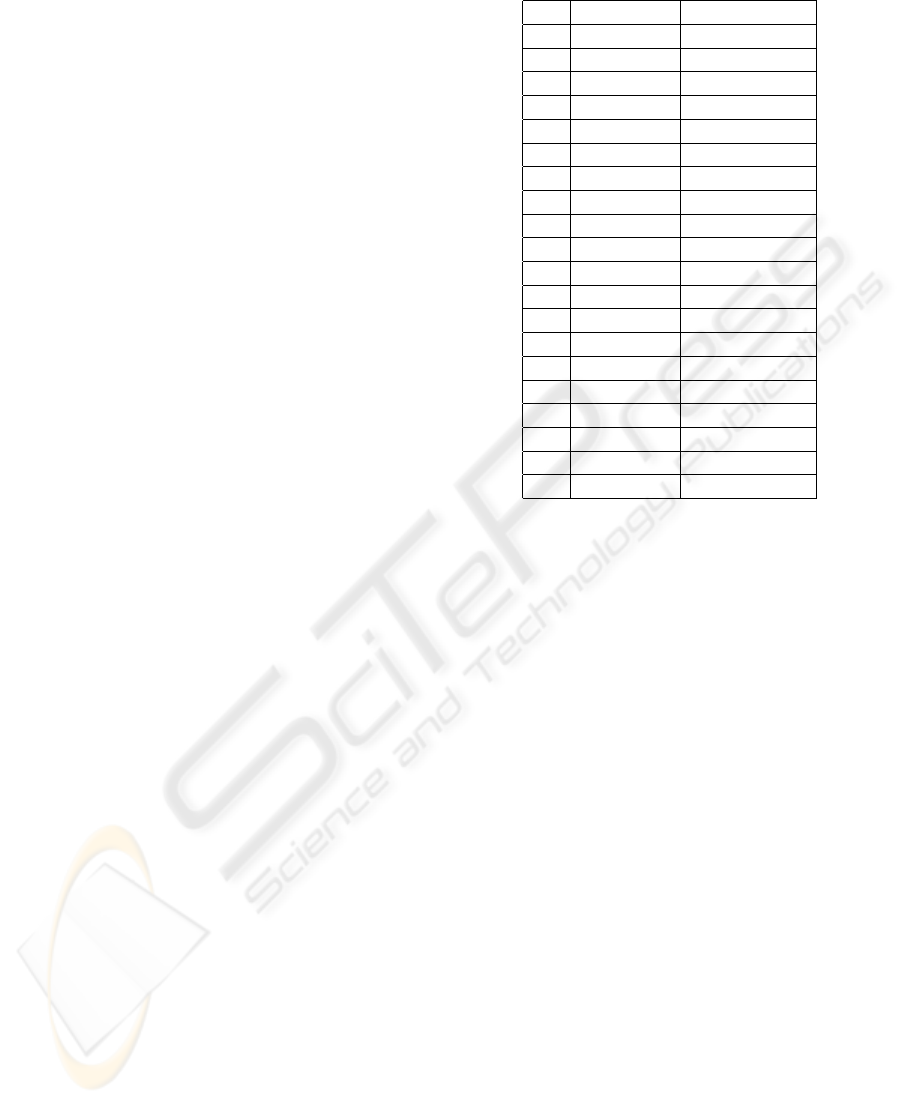
From Table 2, we can get that MaxStoreCount in-
creases as the size of sliding window increases. How-
ever, the increase of MaxStoreCount is very slowly.
We can get that AvgStorePercent decreases as the size
of sliding window increases. Figure 3 and Figure 4
show the same result. Therefore, this method has bet-
ter performance for larger size of sliding window.
In summary, the experimental results and perfor-
mance study show that the data elements need to save
AN EFFICIENT ALGORITHM TO COMPUTE MAX/MIN VALUES IN SLIDING WINDOW FOR DATA STREAMS
127
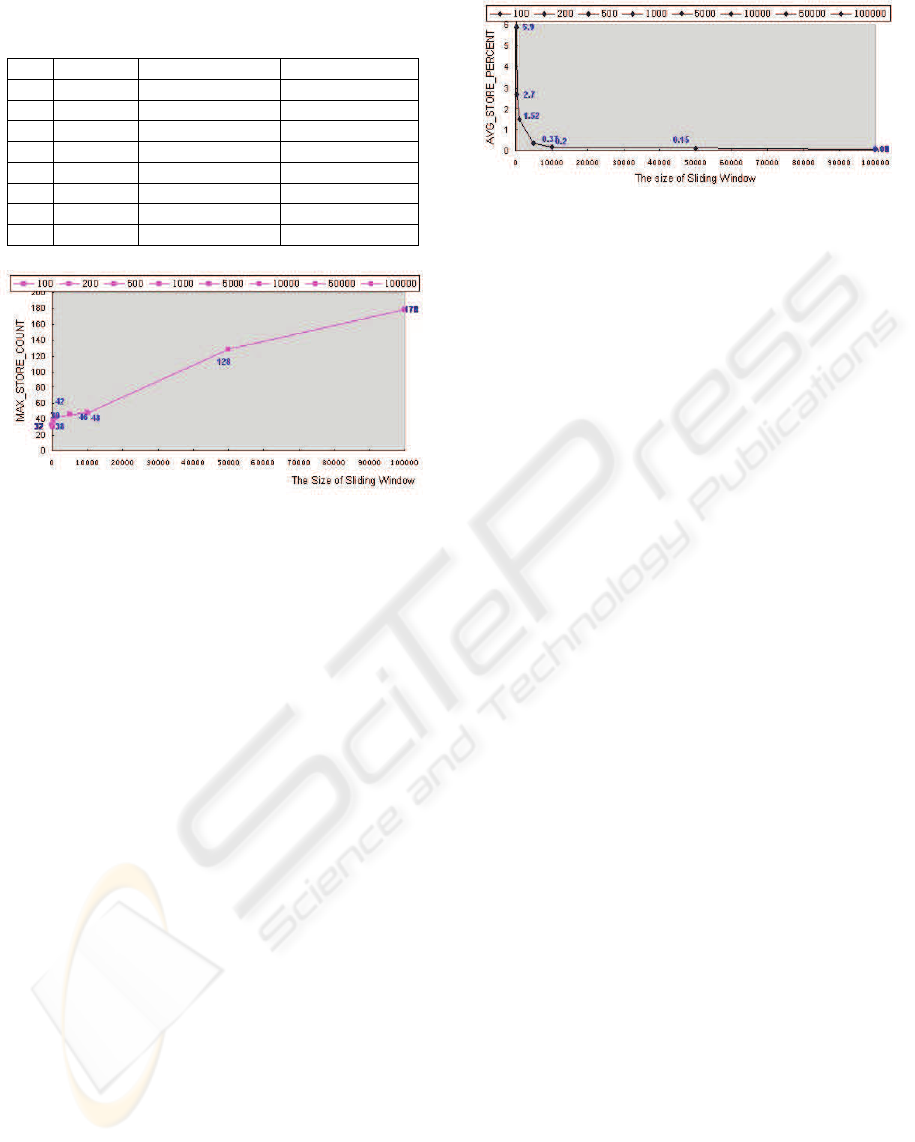
Table 2: Average Results of different sizes of sliding win-
dows(20times).
No WinSize AvgStorePer(%) MaxStoreCount
1 100 10.37 32
2 200 5.90 30
3 500 2.70 38
4 1000 1.52 42
5 5000 0.37 46
6 10000 0.20 48
7 50000 0.15 128
8 100000 0.08 178
Figure 3: MaxStoreCount of different size of sliding win-
dow.
is rather small compare with the size of sliding win-
dow. The average store percent of the data elements
decreases as the size of sliding window increases. So
this method can largely reduce the number of histori-
cal data elements need to be saved.
5 CONCLUSION
This paper proposed a new exact aggregation method
using as little as possible stored historical data for the
Max/Min function for the numerical input data. This
method is an inclemently calculatingly method based
on sliding windows of data stream. The time com-
plexity of this algorithm is O(N logM)and the space-
complexity is O(M)in worst cases(N is the length of
the data sequence, M is the size of the sliding win-
dow). And experimental results confirm its high effi-
ciency.
Ongoing work is comparing this algorithm with
other methods and using several different data distri-
butions. We plan to build a larger test dataset and
thoroughly test this approach. An interesting problem
is whether we can analysis the theoretical average cost
for some given distribution.
Figure 4: AvgStorePercent of different size of sliding win-
dow.
REFERENCES
Cormode, G. and S.Muthukrishnan (2003). What’s hot and
what’s not: Tracking most frequent items dynami-
cally. ACM Principles of Database Systems(PDOS),
pages 296–306.
Cortes, C., Fisher, K., Pregibon, D., Rogers, A., and Smith,
F. (2000). Hancock: A language for extracting signa-
tures from data streams. Proc. Sixth Int’l Conf. Knowl-
edge Discovery and Data Mining, pages 9–17.
Dani, A. and Getta, J. (2005). Conceptual modeling of
computations on data streams. Conferences in Re-
search and Practice in Information Technology Series,
107:43–47.
Dobra, A., Gehrke, J., Garofalakis, M., and Rastogi, R.
(2002). Processing complex aggregate queries over
data streams. pages 61–72.
Gilbert, A., Kotidis, Y., Muthukrishnan, S., and Strauss, M.
(2001). Surfing wavelets on streams: One-pass sum-
maries for approximate aggregate queries. Proc. 27th
Int’l Conf. Very Large Data Bases, pages 79–88.
Guha, S., Koudas, N., and Shim, K. (2001). Data-streams
and histograms. Annual ACM Symposium on Theory
of Computing, pages 471–475.
Henzinger, M. R., Raghavan, P., and Rajagopalan, S.
(1998). Computing on data streams. Technical re-
port TR 1998-011, Compaq Systems Research Center,
Palo Alto, CA,.
ICSOFT 2007 - International Conference on Software and Data Technologies
128
