
IT-BASED PURPOSE-DRIVEN KNOWLEDGE VISUALIZATION
Wladimir Bodrow and Vladimir Magalashvili
Department of Business Informatics, University of Applied Sciences Berlin, Treskowallee 8, 10318 Berlin, Germany
Keywords: Knowledge visualization, knowledge transfer, knowledge management.
Abstract: Knowledge visualization is currently under investigation from different points of view especially because of
its importance for Artificial Intelligence, Knowledge Management, Business Intelligence etc. The concepts
and technology of knowledge visualization in the presented research are considered from a purpose
perspective which focuses on the interdependencies between different knowledge elements. This way the
influence of these elements on each other in every particular situation can be visualized. This is crucial e.g.
for decision making.
1 KNOWLEDGE TRANSFER AS
THE ESSENTIAL ACTIVITY IN
KNOWLEDGE MANAGEMENT
PROCESSES
Looking back onto more than ten years of
knowledge management history we detected that
there is still no universal definition of knowledge
management. Some valuable attempts to define
knowledge management were made by Probst
(Probst et al., 1997), Davenport and Prusak
(Davenport/Prusak, 1998), Nonaka and Takeuchi
(Nonaka/Takeuchi, 1995), Maier (Maier, 2004) etc.
Most of today’s accepted definitions describe
knowledge management as creation,
communication, and application of knowledge. The
main goal of knowledge management is therefore to
improve these processes. Outgoing from different
perspectives and different aims correspondently the
descriptions of the activities in the knowledge
management process vary significantly. But almost
all of them (Bodrow/Fuchs-Kittowski, 2004, Maier,
2004) emphasize knowledge transfer - which is also
called sharing, diffusion, exchange, dissemination,
or distribution, together with knowledge application
as one of the most important activities in the
knowledge management process. Below we will use
the term transfer synonymously for sharing and
exchanging of knowledge as well as for diffusion,
dissemination and distribution of knowledge,
knowing that sharing and exchange refer to bi-
directional processes in opposition to dissemination,
diffusion and distribution which represent the uni-
directional (knowledge) flow. In respect to the
presented research this difference is useless
therefore only the transfer term will be applied.
The efficient transfer of knowledge has proven to
be a difficult task. In this context the adequate
visualization of knowledge can significantly
improve its transfer. Therefore in the following
analysis we will concentrate on this particular aspect
of the knowledge transfer.
2 WHY KNOWLEDGE
VISUALIZATION?
A well-known saying, that a picture is worth 1000
words, leads us to the suggestion that the
visualization of knowledge can increase the
effectiveness of its representation, understanding
and consequently of knowledge transfer.
Visualization can be considered as a way of
internalization (Nonaka/Takeuchi, 1995) of
knowledge (transformation from explicit to tacit
knowledge). But what exactly do we mean by
knowledge visualization? How does it differ from
visualization of information or data? Knowledge
visualization as opposed to information visualization
is a rather new field within knowledge management
research. It has received more attention recently due
to the business’s interests. There are already some
attempts to define knowledge visualization. Two
examples of such definitions are presented below.
194
Bodrow W. and Magalashvili V. (2007).
IT-BASED PURPOSE-DRIVEN KNOWLEDGE VISUALIZATION.
In Proceedings of the Second International Conference on Software and Data Technologies - PL/DPS/KE/WsMUSE, pages 194-197
DOI: 10.5220/0001339001940197
Copyright
c
SciTePress

3 KNOWLEDGE
VISUALIZATION TODAY
Following Drosdol (Drosdol/Frank, 2005)
knowledge visualization refers to “the result of
transformation from information to knowledge,
representation of connections and links, designing
the space between information elements,
development of meaning, creating meaningful
structures fitting the contents, helping to generate
new knowledge which can be used by people, staff,
leaders, decision-makers”.
Burkhard (Burkhard/Maier, 2004, Burkhard,
2005, Eppler/Burkhard, 2004) defines knowledge
visualization as “the use of visual representations to
improve the transfer and creation of knowledge
between at least two persons”. Moreover he
describes the difference between knowledge and
information visualization. The latter is not trivially
derivable from the presented definition. Information
visualization also uses “visual representations to
improve the transfer of knowledge”, even if its
primary goal is to retrieve the information.
According to Burkhard’s definition it can be
considered as knowledge visualization. The recipient
(depending on their capabilities) can obtain or
perhaps create new knowledge only by getting the
visual information. There are many Software-tools
that visualize a huge amount of data and
information. Experience gathered in this field is very
helpful i.e. for development of decision support
systems. Obviously the presented definition is too
general to be accepted as a definition for knowledge
visualization.
Our approach compared to other definitions is
not knowledge element-driven, but purpose-driven.
It is based on an appropriate application of the
different interrelations between the knowledge
elements according to the selected purpose. We
consider the knowledge element oriented approach
as very similar to information or data visualization
where the different declared attributes of the
particular object can be visualized using graphics
and other media. Alternatively we follow the idea,
that the most important aspect in visualizing
knowledge (especially!) is the multi-valence of
explanations for the interdependencies between
knowledge elements.
4 HOW DO WE
DEFINE KNOWLEDGE
VISUALIZATION?
How can we define knowledge visualization from a
knowledge management perspective (not from a
view of cognitive psychology, pedagogy or graphic
design)? Our aim is not to define a visualizing
technique (like sketch, diagram, image etc.), but a
general proper way for the representation of
knowledge using visualization techniques.
If somebody tries to illustrate a solution of a
complex (for example business) problem, they do
not only visualize single elements of a transferred
concept based on its attributes, but also the
connections and/or interdependencies of these
elements. However it is usually not enough for the
recipient to understand the logic of the concept (and
to accept the proposed solution). What the recipient
needs is an explanation of those dependencies in
respect to the task or problem to be solved. Why are
the selected elements connected to each other in the
considered case or in general? How do these visual
dependencies help understand the knowledge to be
transferred? Why does the knowledge have to be
visualized based on a selected concept (motivation)?
How is this visualization going to be helpful for the
solution investigated and for other applications?
Which role do the skills and preferences of both
partners play in the particular knowledge transfer
and its visualization?
From our point of view knowledge visualization
has to answer these questions to be classified as
such. Without explaining the meaning and purpose
of the connections between the different visual
elements, the visualization loses its value. It reduces
to something like data or information visualization –
visual representation of abstract data. (Card et al.,
1999, Chen, 1999, Chen/Geroimenko, 2003). For
instance according Card “information visualization
is the use of computer-supported, interactive, visual
representation of abstract data to amplify cognition”
(Card et al., 1999).
Summarizing the features and perspectives
mentioned above the following definition of
knowledge visualization can be derived:
Definition:
Knowledge visualization is a set of graphical entities
used to transfer knowledge from an expert to a
person (or group of persons), which clarifies its
complexity and explains the meaning and the
purpose of the relevant interdependencies.
IT-BASED PURPOSE-DRIVEN KNOWLEDGE VISUALIZATION
195
Firstly, according to the definition above the sender
of knowledge can be both: human or artefact,
whereas the recipient from today’s perspective can
be a single person or a group of persons.
Secondly, the visualization should represent a task
or problem to be solved (e.g. business workflow
process, structure of a business unit with its
responsibilities etc.). This way it provides the
answer for the question why the knowledge has to be
transferred.
In this research we only consider the dependencies
of the first order in the visualized structure (see
Figure 1). That means we only analyze the
connections (uni- or bidirectional) between different
but single elements and not between groups of
elements or indirect relations (n-way dependencies).
The connections can be considered from two
perspectives:
Why this connection? – What is the purpose of this
connection? Why does this connection have to be
used? Which problems can be solved based on it?
Which particular dependency or influence is used in
this connection? – It should explain the connection
between two selected knowledge elements.
Accordingly the dependency can be interpreted as a
specialization for the more general or strategic
formulated purpose of the single connection between
two knowledge elements.
Figure 1: First order and second order dependencies
between elements.
According to the previous discussion we can define
knowledge visualization formally as
KnowVis = F (E, D, P) where
F is a certain function of
E – a set of knowledge elements (
different visual
features as tables, charts, nodes of trees, circles etc.
)
D – a set of dependencies/influences between
knowledge elements
P – a purpose(s) of interdependencies.
From another perspective each dependency can be
defined as
D = f (e1, e2, s12, s21, p12, p21)
Where e1, e2 are two knowledge elements from E
p12, p21 represent the corresponding purposes s12,
s21 are the strengths of the influence of e1 on e2 and
vice versa.
One should only concentrate on the most
important dependencies between knowledge
elements in order to avoid extreme complexity in the
visualized structure. Therefore it sounds reasonably
that the connections have such attributes as the
“strength” of interdependency.
Our concept has something in common with the
idea of Novak’s concept maps (Novak/Gowin,
1984). Novak defines concept maps as tools for
organizing and representing knowledge. They
include concepts (enclosed in circles or boxes), and
relationships between concepts or propositions.
These relations are indicated by a connecting line
and a linking word (often a verb).
But the key difference from Novak’s to our
concept is that each relation in knowledge
visualization is provided by the explanation of its
purpose. How does this explanation support the
whole idea of knowledge transfer?
The choice of visualization technique certainly
depends on the type of knowledge transferred and on
the recipient’s capabilities.
As just mentioned, knowledge visualization
should clarify the purpose of the connections
between visual entities. This does not mean that the
recipient receives only one “right application”. The
given explanations will contain a description of how
the sender would apply this knowledge. Those
application suggestions will help the recipient to
utilize the best practice by creating his own
analogies and associations during his individual
decision making. The way in which the obtained
knowledge can be applied depends on the
effectiveness of the visualization (choice of visual
self-describing features, clear dependencies, etc.)
and the intellectual (abstract thinking, logical
conclusions, experience, etc.) capabilities of the
recipient.
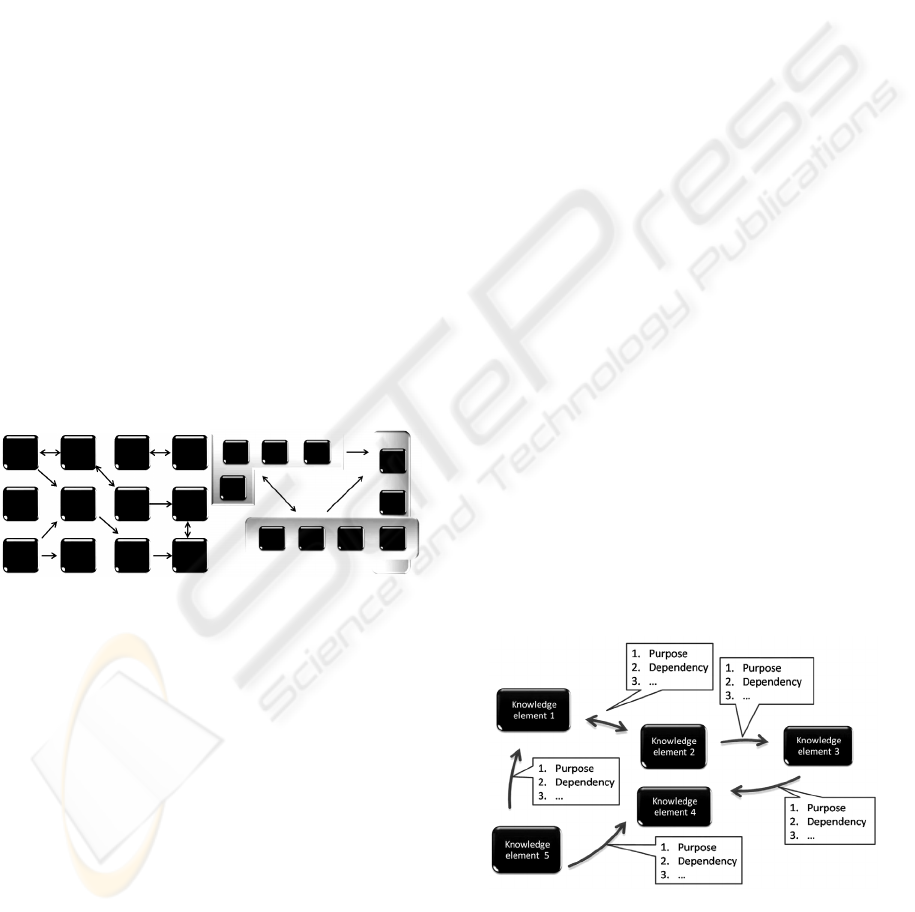
Figure 2: The purpose-driven knowledge visualization
metaphor.
An example for purpose-driven knowledge
visualizations is presented in Figure 2. The
ICSOFT 2007 - International Conference on Software and Data Technologies
196

explanations menus for all connections as shown
above can overload the graphic. Therefore they
should rather be implemented as context sensitive
menu-boxes appearing after a mouse click on the
connection to be clarified.
Which advantages can be expected from such
visualizations?
Firstly, it is easier for the recipient to understand
the knowledge transferred from the sender.
Secondly, this explanation of the dependencies
and purposes of the relations will simplify the
process of logical and analogical reasoning by the
recipient.
5 IMPLEMENTATION
The concept described in this report is currently in
realization. The implemented prototype is being
investigated in the context of various applications
where the knowledge transfer plays an essential role
(e.g. different knowledge management systems, e-
Learning tools etc.) Its important features are listed
below:
Editor for knowledge elements and n-
dimensional connections between them.
Flexible edition of the facets/attributes of these
connections to define the interdependencies
between elements.
Context sensitive visualization of
interdependencies within the particular case
analyses.
Activation of the context sensitive pull-down
menu with different interdependencies between
selected knowledge elements
Possibilities for generalization as well as for
specialization of the solution based on the same
concept.
6 CONCLUSIONS
The approach of knowledge visualization described
in this paper provides a new basis for knowledge
transfer. In contrast to other definitions, in this
research knowledge visualization is investigated
from the purpose perspective. Following presented
purpose-driven approach it is important to extend the
usual map of relations between different knowledge
elements with explanation of their
interdependencies. The implementation of this
approach allows context sensitive visualizations of
these interdependencies in respect to the purposes of
knowledge transfer or tasks under investigation. The
clarification of the purposes integrated into the
visualization of interdependencies between
knowledge elements significantly improves the
recipient’s understanding and acceptance of the
knowledge transferred.
REFERENCES
Bodrow, W., Fuchs-Kittowski K., 2004.
Wissensmanagement in der Wissenschaft. In Fuchs-
Kittowski, K., Umstätter, W., Wagner-Döbler, R.,
(Eds.) Wissenschaftsforschung Jahrbuch 2004. Berlin.
Burkhard, R., 2005. Towards a Framework and a Model
for Knowledge Visualization: Synergies between
Information and Knowledge Visualization. In Tergan
S., Keller T. (Eds.), 2005. Knowledge and Information
Visualization: Searching for Synergies, Springer
Berlin Heidelberg.
Burkhard, R., Meier, M., 2004. Tube map: Evaluation of a
visual metaphor for interfuncional communication of
complex project. Paper presented at the I-KNOW ’04,
Austria, Springer New York.
Chen, C., 1999. Information Visualization and Virtual
Environments. Springer London.
Chen, C., Geroimenko, V. 2003. Visualizing the Semantic
Web: XML-Based Internet and Information
Visualization. Springer London, Berlin, Heidelberg
Card, S.K., Mackinlay J.D., Scheiderman, B., 1999.
Readings in Information Visualization; Using Vision
to Think, Morgan Kaufmann San Francisco.
Davenport, T.H., Prusak, L., 1998. Working Knowledge,
Harward Business School Press Cambridge.
Drosdol, J., Frank, H.-J., 2005. Information and
Knowledge Visualization in Development and Use of
a Management Information System (MIS) for Daimler
Chrysler. In: Tergan S., Keller T. (Eds.), 2005.
Knowledge and Information Visualization: Searching
for Synergies, Springer Berlin Heidelberg.
Eppler, M., Burkhard, R., 2004. Knowledge Visualization
– Towards a New Discipline and its Fields of
Application. Working Paper of NetAcademy on
Knowledge Media, St.Gallen.
Maier, R., 2004. Knowledge Management Systems:
Information and Communication Technologies for
Knowledge Management. Springer. Berlin Heidelberg
New York.
Nonaka, I., Takeuchi, H., 1995. The Knowledge Creating
Company, New York Oxford
Novak, J. D., Gowin, D.B., 1984. Learning How to Learn.
New York Cambridge.
Probst, G. Raub, S., Romhardt, K., 1997. Wissen
managen, Wie Unternehmen ihre wertvollste
Ressource optimal nutzen. Gabler Wiesbaden.
Tergan S., Keller T. (Eds.), 2005. Knowledge and
Information Visualization: Searching for Synergies.
Springer Berlin Heidelberg.
IT-BASED PURPOSE-DRIVEN KNOWLEDGE VISUALIZATION
197
