
THE DEBUGGABLE INTERPRETER DESIGN PATTERN
Jan Vran
´
y
Department of Computer Science
Faculty of Electrical Engineering
Technical University in Prague, Czech
Alexandre Bergel
Software Architecture Group
Hasso Plattner Institut, University of Potsdam
&
LERO & Distributed Systems Group
Trinity College Dublin, Ireland
Keywords:
Program interpretation, debugger, design pattern, programming environment.
Abstract:
The use of Interpreter and Visitor design patterns has been widely adopted to implement programming lan-
guage interpreters due to their expressive and simple design. However, no general approach to conceive a
debugger is commonly adopted.
This paper presents the debuggable interpreter design pattern as a general approach to extend a language
interpreter with debugging facilities such as step-over and step-into. Moreover, it enables multiple debuggers
coexisting and extends the Interpreter and Visitor design patterns with a few hooks and a debugging service.
SmallJS, an interpreter for Javascript-like language, serves as an illustration.
1 INTRODUCTION
A design pattern is a general repeatable solution to a
commonly occurring problem in software design. It is
a description or template for how to solve a problem
that can be used in many different situations. Design
patterns gained popularity after Gamma, Helm, John-
son, and Vlissides compiled and classified what were
recognised as common patterns (Gamma et al., 1993;
Gamma et al., 1995).
The interpreter and visitor design patterns are
usually described in terms of interpreting grammars.
Given a language, they define a representation for its
grammar along with an interpreter sentences in the
language (Gamma et al., 1995). Whereas the abil-
ity of the visitor and interpreter patterns to define
programming language interpreters is widely recog-
nised (Cheong and Jarzabek, 1999; Acebal et al.,
2002; Lorenz, 1997), no approaches to facilitate the
realisation of a debugger are currently available, to
our knowledge.
The Debuggable Interpreter Design Pattern de-
scribes a programming language interpreter that of-
fers debugging facilities. It augments the Interpreter
pattern (Gamma et al., 1995) with some hooks in the
“visiting” methods and employs a debugging service
to model operations (i.e., step-in, step-over, etc...).
The contributions of this paper are the follow-
ing: (i) description of the debuggable interpreter pat-
tern, and (ii) illustration with SmallJS, a subset of
Javascript.
Section 2 illustrates the challenges in implement-
ing a debugger. Section 3 presents the debuggable
interpreter pattern and its illustration with SmallJS,
a minimal procedural language. Section 4 discusses
several points and shows some properties of the pat-
tern. Section 5 provides a brief overview of related
work. Finally, Section 6 concludes by summarising
the presented work.
22
Vraný J. and Bergel A. (2007).
THE DEBUGGABLE INTERPRETER DESIGN PATTERN.
In Proceedings of the Second International Conference on Software and Data Technologies - PL/DPS/KE/WsMUSE, pages 22-29
DOI: 10.5220/0001343500220029
Copyright
c
SciTePress
2 INTERPRETING AND
DEBUGGING LANGUAGES
2.1 The Smalljs Interpreter
SmallJS is a JavaScript-subset interpreter written in
ST/X, a dynamically-typed object-oriented program-
ming language
1
. SmallJS contains the usual language
constructions to define variables and functions. As an
illustration, the following code describes the factorial
function:
function fact(i) {
if ( i > 0 ) {
return i * fact(i - 1);
} else {
return 1;
};
}
var a;
a = 6;
fact(a);
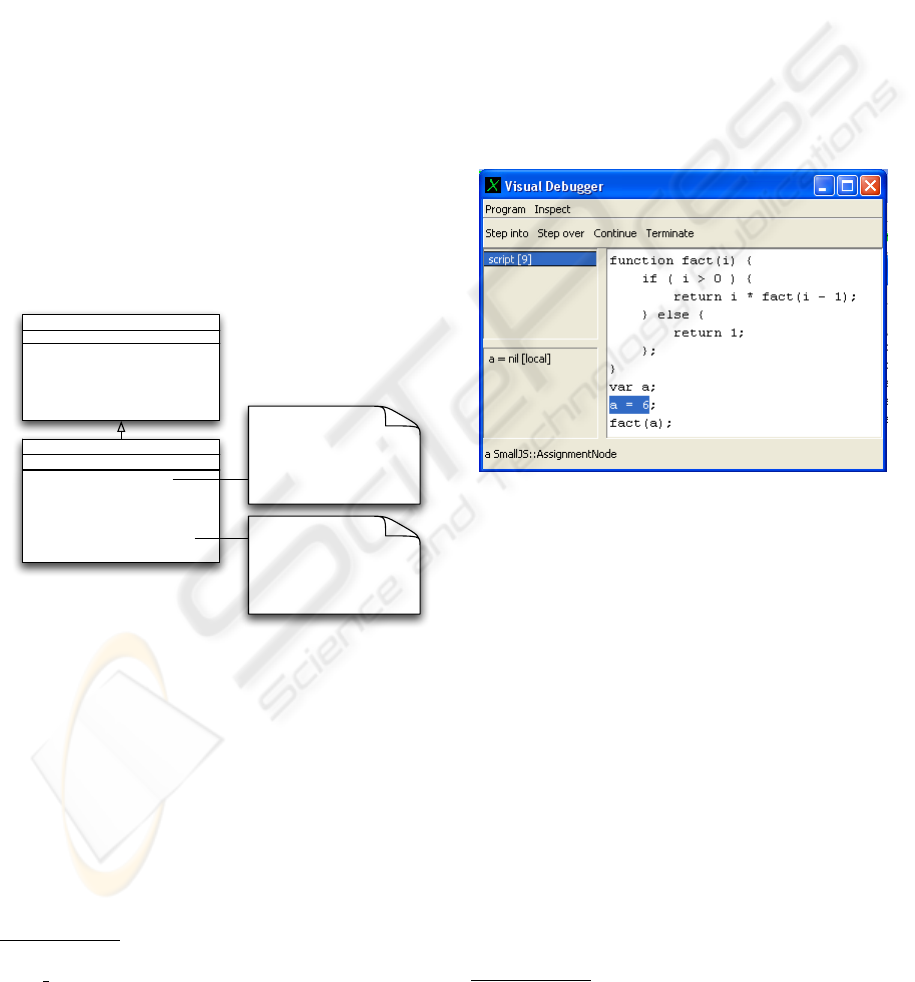
Visitor
visitAssignmentNode(Node)
visitFunctionCallNode(Node)
visitFunctionNode(Node)
visitMultiplicationNode(Node)
...
Interpreter
context
visitAdditionNode: node
visitFunctionCallNode: node
visitFunctionNode: node
visitMultiplicationNode: node
visitAssignmentNode: node
...
| left right |
left := node leftOperand
acceptVisitor: self.
right := node rightOperand
acceptVisitor: self.
^ left + right
| value |
value := node value
acceptVisitor: self
^ context
at: node variable
put: value
Figure 1: The SmallJS interpreter.
Figure 1 provides an excerpt of a visitor-based in-
terpreter for SmallJS and presents the body of the vis-
itAdditionNode: aNode and visitAssignmentNode: aN-
ode methods
2
. An addition is realized by running the
visitor on the left operand, then on the right operand,
and to finally return the sum of these two values. An
assignment is realized by running the visitor on the
value of the assignment, and then storing the value in
the context of the interpreter.
1
www.exept.de/exept/english/Smalltalk/-
frame uebersicht.html
2
We adopted the ST/X syntax in UML diagrams to
present a homogeneous notation.
The interpretation of the SmallJS programming
language is realized through a direct application of the
Interpreter and Visitor design patterns (Gamma et al.,
1995).
2.2 Realizing a Debugger
A debugger is a tool that is used to test and debug
programs. Typically, debuggers offer sophisticated
functionalities such as running a program step by step,
stopping (pausing the program to examine the current
state) at some kind of event by means of a break-
point, and tracking the values of defined variables.
The interpreter maintains several registers such as the
program counter (instruction pointer) and the stack
pointer.
Figure 2: A graphical user interface of a debugger.
Figure 2 shows a debugging session involving the
piece of code given above.
Advanced debugging environments (e.g., ST/X,
VisualWorks
3
, Dolphin Smalltalk
4
) enable several de-
buggers and interpreters for the same program code
to coexist. Operations such as opening a new debug-
ger from a debugger, debugging two different pieces
of the same program, or debugging a multi-threaded
program may be performed.
Whereas the state of instruction-based interpreters
is contained in a set of registers, recursive function
invocations define the state of a visitor-based inter-
preter. The state of the interpreter is determined by
the set of function activation records which are con-
tained in the method call stacks. Local context visual-
isation is achieved by sophisticated reflective features,
such as stack reification, which might result in a lack
3
www.cincomsmalltalk.com
4
www.object-arts.com
THE DEBUGGABLE INTERPRETER DESIGN PATTERN
23
of performances or raise technical issues difficult to
address.
A visitor-based interpreter allows for breakpoints
to be set and offers a mechanism to perform de-
bugging operations such as step by step instruction
execution.
3 THE DEBUGGABLE
INTERPRETER PATTERN
This section describes a general approach to realize
and implement a debugger for a visitor-based inter-
preter. It augments the visitor interpreter with a set of
hooks inserted in the visit* methods. As part of the
Interpreter design pattern, the dynamic information
needed for a program interpretation is stored in a con-
text. Debugging operations such as step-into, step-by,
and continue are offered by a debugging service.
3.1 Debugging Operations
Before describing the Debuggable Interpreter design
pattern, it is important to outline the different oper-
ations we will use as debuggers traditionally come
with their own set of definitions.
Setting breakpoints. A breakpoint is a signal that
tells the debugger to temporarily suspend the execu-
tion of a program. A breakpoint is associated with a
node in the abstract syntax tree. The same program
may contains several breakpoints.
When the interpretation of an abstract syntax tree
(AST) reaches a breakpoint, an interactive session
begins during which the operations described below
may be invoked. The state of the debugger is mod-
elled by a context and a reference to a particular node
in the AST, which we call the current node.
Breakpoints are set by a user through an interface.
For example, right clicking on the interface presented
in Figure 2 displays a menu which offers a ’set
breakpoint’ entry.
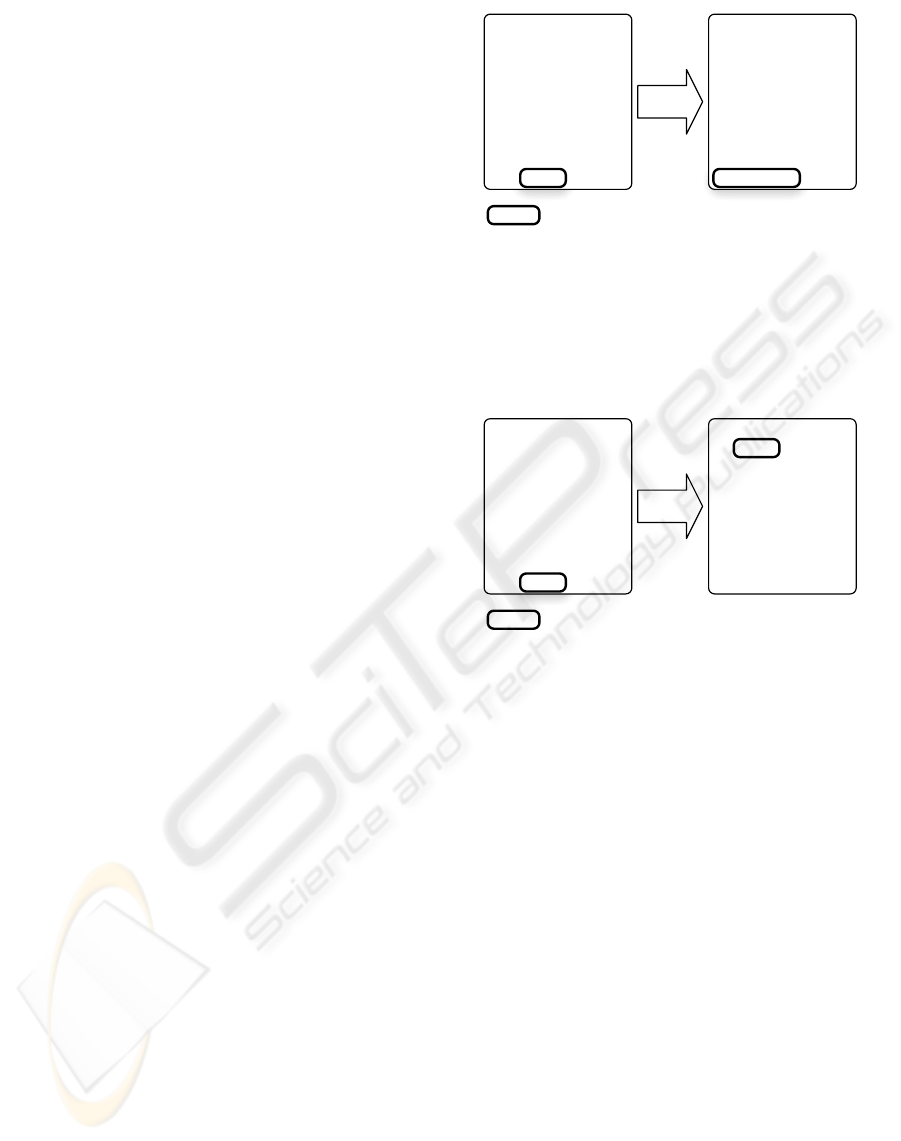
Step-over. A step-over operation consists of moving
to the following node in the AST after having inter-
preted the current node. The current node is then po-
sitioned on this new node.
Figure 3 illustrates a step-over operation. The
current node is fact(a). By performing a step-over
operation, the current node is then print(fact(a)).
Step-into. A step-into operation consists of moving
to the next node in the AST according to the appli-
function fact(i) {
if ( i > 0 ) {
return i * fact(i - 1);
} else {
return 1;
};
}
var a;
a = 6;
print(fact(a));
Node being interpreted
function fact(i) {
if ( i > 0 ) {
return i * fact(i - 1);
} else {
return 1;
};
}
var a;
a = 6;
print(fact(a));
Step-over
Figure 3: A step-over operation does not go into recursion.
cation control flow. This operation differs from step-
over by entering recursion.
function fact(i) {
if ( i > 0 ) {
return i * fact(i - 1);
} else {
return 1;
};
}
var a;
a = 6;
print(fact(a));
Node being interpreted
function fact(i) {
if ( i > 0 ) {
return i * fact(i - 1);
} else {
return 1;
};
}
var a;
a = 6;
print(fact(a));
Step-into
Figure 4: A step-into operation goes into recursion.
A step-into operation is illustrated in Figure 4. In
this situation, the interpreter halts at the first node in
the recursion which is i > 0.
Continue. The execution of an application may be
resumed by continuing it.
Terminate. The program execution might be prema-
turely ended with the terminate operation. As a con-
sequence, no subsequent nodes are evaluated and al-
located resources such as context stack and the inter-
preter are freed.
3.2 Hooks in the Visitor
The flow of a program interpretation stems from the
invocation order of the visiting methods. Suspending
and resuming the interpretation flow and capturing re-
cursion are the basis for the debugging operations.
For the remainder of this paper, the interpreter
class is called Interpreter. As described in Figure 1,
it implements the visiting methods.
Hooks need to be inserted in the Interpreter class
ICSOFT 2007 - International Conference on Software and Data Technologies
24

to enable step-over and step-in operations. These
hooks inform a debugger service as to which part of
code is being executed. As explained in Section 3.5,
a service is a placeholder for debugging operations.
The method Interpreter.onTracepoint: aNode enables
interpretation of an AST to be driven by a service:
Interpreter. onTracepoint: aNode {
debuggerService onTracepoint: aNode
}
Both methods have to be invoked when visiting
nodes. A visit: method maintains the current node
reference in a context:
Interpreter.visit: aNode {
| value previousNode |
”A reference of the current node is
temporarily stored”
previousNode := context currentNode.
”The node is set as current”
context currentNode: aNode.
”Visit the node”
value := aNode acceptVisitor: self.
”The previous node is restored”
context currentNode: previousNode.
ˆvalue
}
First, visit: aNode gets a reference of the previous
node from the current activation context. This refer-
ence is used to set the current node back when visit:
aNode has completed. Then the interpreter notifies
the new current node to the context. This new current
node is the node being traversed. The interpreter runs
over this node using a double dispatch.
The reference of the current node acts as an in-
struction pointer. It clearly identifies the current exe-
cution location.
However, instead of directly performing a double
dispatch, the visit: aNode has to be used. For example,
in the method visitAdditionNode: aNode the recursion
is obtained from invoking visit: aNode:
Interpreter.visitAdditionNode: aNode {
| left right |
left := self visit: aNode left.
right := self visit: aNode right.
self onTracepoint: aNode.
ˆleft+right
}
Each visit* method must perform a call to onTrace-
point: aNode after traversing all branches and before
synthesising the result.
Compared with the code shown in Figure 1, this
new version of visitAdditionNode: aNode makes the
interpreter aware of breakpoints. When a breakpoint
is reached, the execution of the interpreter is sus-
pended. Subsequent subsections illustrate how break-
points and debugging modes are modelled.
3.3 Context Definition
Associations between variables and values are stored
within a context object (Gamma et al., 1995). The
debuggable interpreter pattern augments this context
with dynamic information related to the parent con-
text and the current node under execution. Each func-
tion invocation creates a new context.
The class InterpreterContext contains three vari-
ables: sender which refers to the parent context, cur-
rentNode for the node in the abstract syntax tree,
and returnReached indicating if return node has been
reached or not. The interpreter should not evalu-
ate subsequent nodes when a return node has been
reached. Typically, this occurs when a return state-
ment is interpreter. The method visitReturnNode: aN-
ode is therefore defined as follows:
Interpreter.visitReturnNode: aNode {
| value |
value := self visit: expression.
self onTracepoint: aNode.
self returnReached: true.
context returnReached: true.
ˆvalue
}
3.4 Separate Control Flow
An interpreter has to be embedded in a thread. This is
necessary for several reasons:
• Multiple execution of the same program enables
a debugger to launch another debugger. Although
not essential, this feature leads to a better comfort
when debugging.
• If the executed program fails, it should not impact
the enclosing application environment. The inter-
preter cannot run in the same control flow as the
programming environment. The program under
execution and the debugger cannot be executed in
the same thread.
The Interpreter class defines a variable process
and an evaluate: aNode method to trigger an execu-
tion:
Interpreter.evaluate: aNode {
| value semaphore |
semaphore := Semaphore new: 0.
context := Context new.
process := ([value := self visit: aNode] newProcess)
addExitAction: [semaphore signal];
resume.
THE DEBUGGABLE INTERPRETER DESIGN PATTERN
25
semaphore wait.
ˆvalue
}
The evaluate: aNode method creates a semaphore.
This is necessary to block the execution of the inter-
preter. A new context is created, followed by the cre-
ation of a new thread (called process in the ST/X ter-
minology) that is intended to execute the code value
:= self visit: aNode. Independently, regardless of
whether an exception is raised or not, once com-
pleted, the exit action is triggered which releases the
semaphore.
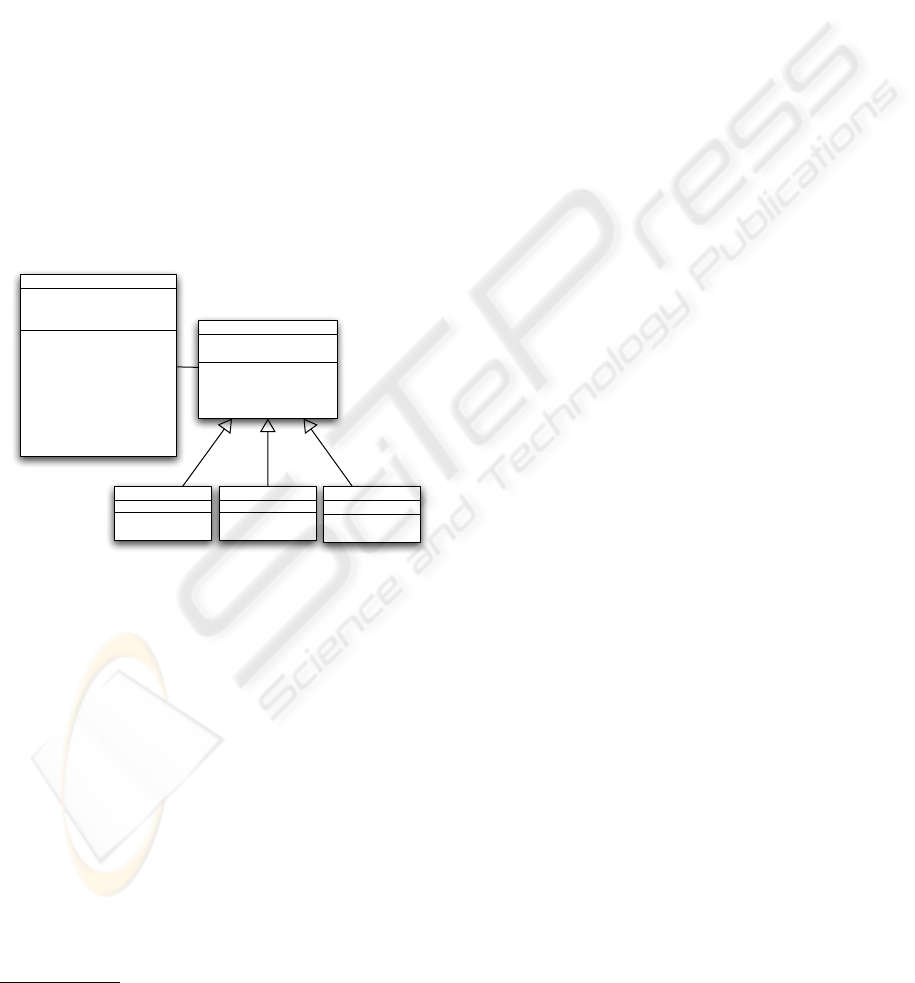
3.5 Debugging Service
In addition to keep a reference to a context, an in-
terpreter must also refer to a debugger service. This
service implements the debugging operations such as
step-into, step-over and continue. Figure 5 provides
an overview.
mode:
onTracepoint:
stepInto
stepOver
terminate
runInterpreter
continue
addBreakpointOn:
tracepointReachedFor:
interpreter
breakpoints
mode
DebuggerService
onTracepoint:
continue
stepInto
stepOver
debuggerService
mode
DebuggerMode
1
1
continue
onTracepoint:
ContinueMode
stepInto
onTracepoint:
StepIntoMode
stepOver
onTracepoint:
context
StepOverMode
Figure 5: Debugger services definitions.
The control flow of an application is halted when
it reaches a breakpoint, which identifies a location in
the program
5
. With the debuggable interpreter pat-
tern, a breakpoint is identified as a node in the abstract
syntax tree.
When a breakpoint is reached, the interpreter en-
ters an interaction mode, which allow the user to per-
form further operations. The mode in which the ser-
vice is set reflects the operation that is currently per-
formed. Each mode represents a debugging operation.
To keep this paper concise, we consider only 3 modes:
continue, step-into, and step-over.
A service maintains a list of breakpoints, accessi-
ble by the modes. A breakpoint is added to a service
5
Note that advanced definitions of breakpoints such as
conditional are outside the scope of this paper.
by the user through a user interface.
The methods continue, stepInto, and stepOver de-
fined on DebuggerService are delegated to the current
mode:
DebuggerService.continue {
mode continue }
DebuggerService.stepInto {
mode stepInto }
DebuggerService. stepOver {
mode stepOver }
The tracepointReachedFor : and run methods are
used to steer the process associated with an inter-
preter. tracepointReachedFor: is invoked by the mode
when a breakpoint is reached. This method simply
suspends the process associated with the interpreter:
DebuggerService.tracepointReachedFor: aNode {
interpreter process suspend
}
”Should be instead”
DebuggerService.runInterpreter { interpreter run }
Interpreter.run { process resume }
Setting breakpoints. A debugger service maintains
a list of nodes that represent breakpoints in the pro-
gram.
DebuggerService.addBreakpointOn: aNode {
breakpoints ifNil: [
breakpoints := OrderedCollection new ].
breakpoints add: aNode.
}
The method addBreakpointOn: is invoked by
the debugger user interface. The aNode parameter
corresponds to the node in the abstract syntax tree
that should halt the program interpretation.
Continue mode. The continue mode is the initial
mode of the debugger service. When the debugger
service is in the continue mode the program is exe-
cuted until a breakpoint is reached. When that occurs,
the interpreter thread is suspended and a debugger is
opened. The service can either switch to a step-into or
step-over mode, or a continue mode. The two meth-
ods that define this mode are:
ContinueMode.onTracePoint: aNode {
(debuggerService isBreakpoint: aNode) ifTrue: [
debuggerService tracepointReachedFor: aNode
].
}
ContinueMode.continue {
debuggerService runInterpreter
}
ICSOFT 2007 - International Conference on Software and Data Technologies
26
Step-into mode. When the debugger service is in the
step-into mode the program interpretation is stopped
(and a debugger is opened) when onTracepoint: is in-
voked.
StepIntoMode.onTracePoint: aNode {
debuggerService tracepointReachedFor: aNode
}
StepIntoMode.stepInto {
debuggerService runInterpreter
}
Step-over mode. When the debugger service is in the
step-over mode stepping does not follow recursions
and method calls. The StepOverMode has a context
variable. This variable captures the state of the cur-
rent interpretation and is initialised when the debug-
ger service switches to this mode.
The two methods that define this mode are:
StepOverMode.onTracePoint: aNode {
((context = debuggerService context) ifTrue: [
debuggerService tracepointReachedFor: aNode]
}
StepOverMode.stepOver {
debuggerService runInterpreter
}
If the current context and the current node match
the ones referenced by the step-mode, then the debug-
ger switches for a step-into mode, so that the execu-
tion will be halted on the node that follows the one
that was stepped over.
4 DISCUSSION
Coexisting debuggers. Since multiple interpreters
can interpret the same program, several debuggers
may be active at the same time. Although this feature
does not figure as a priority for the Java debugger
6
, it
greatly enhances the debugging activity.
Breakpoints. The debuggable interpreter pattern
emits a breakpoint signal when the control flow
reaches a particular node in the abstract syntax tree.
Note that this definition of breakpoint might slightly
diverge from a widely known debugger such as Gdb
7
where a breakpoint signal may be triggered when the
control flow reaches a particular line of the source
code.
6
java.sun.com/j2se/1.4.2/docs/jguide/jpda/-
jarchitecture.html.
7
sourceware.org/gdb/
New operations. New debugging operations can
easily be added by subclassing DebuggerMode and
adding the corresponding methods in DebuggerSer-
vice. For example, a mode that holds a condition
to enable the interpretation can be implemented
in a class ConditionalInterpretationMode in which
the method onTracePoint: aNode checks for the
conditional expression.
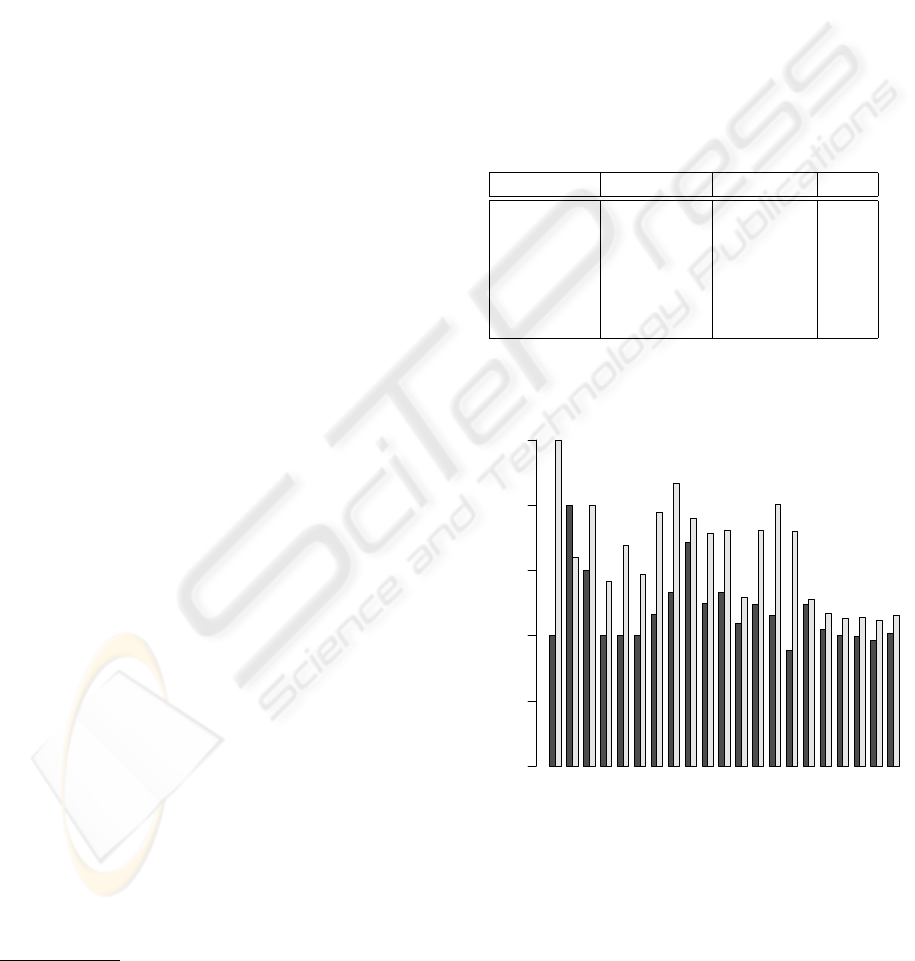
Speed and memory overhead. A natural question
to be raised is the cost in terms of speed and mem-
ory consumption. The table below shows the time
in millisecond taken to execute the factorial function
with the debuggable interpreter design pattern (DIDP)
and the classical visitor pattern (VDP). These figures
are obtained while disabling the just-in-time compiler
(JIT).
Iteration DIDP (ms) VDP (ms) ratio
fac(100) 5.0 2.0 2.50
fac(200) 8.0 5.0 1.60
fac(400) 17.0 12.0 1.41
fac(900) 38.0 20.0 1.90
fac(10000) 973.0 540.0 1.80
fac(70000) 22774.0 19722.0 1.15
100 300 500 700 900 3000 10000 40000 70000
Factorial
Slowdown ratio
0.0 0.5 1.0 1.5 2.0 2.5
Figure 6: Ratio between a non-debuggable and a debug-
gable interpreter. Use of a just-in-time compiler (JIT) is
denoted in black.
Figure 6 shows the overhead of the DIDP with the
VDP for each factorial expression. It also measures
the benefit of having a JIT. The black bar indicates a
THE DEBUGGABLE INTERPRETER DESIGN PATTERN
27

measurements obtained with the JIT enabled, whereas
the value denoted by the white bars are obtained with
the JIT disabled.
As a result, we see that the ratio is asymptotic to
1. This means that the cost of the debuggable inter-
preter design pattern compared to the classical visitor
is negligible for deep recursion.
The table below compares the memory consump-
tion of DIDP with VDP. The total number of created
objects is shown for each factorial expression.
Iteration DIDP VDP ratio
fac(100) 102 102 1
fac(200) 202 202 1
fac(400) 402 402 1
fac(900) 902 902 1
fac(10000) 10002 10002 1
fac(70000) 70002 70002 1
During the evaluation of factorial expression, con-
texts are created for each recursion, as well as a mode
and a service. This table shows that the DIDP does
not incur any memory overhead.
The computer used for this experiment is an Intel
Pentium M 1,6GHz, Linux (kernel 2.6.20.1), 512MB
RAM, ST/X 5.2.8.
5 RELATED WORK
Scripting debugging. Marceau et al. (Marceau et al.,
2006) designed a language for a scriptable debug-
ger. The purpose of this debugger is to automatise se-
quences of debugging operations that might be labori-
ous to repeat manually. A classical sequence could be
setting a breakpoint, examining values of some vari-
ables, or resuming execution. Debugging an appli-
cation generally may necessitate repeat this sequence
many times in order to find a single bug. Scripting a
debugger helps in automating such a task.
Similar to the debuggable interpreter pattern, the
scriptable debugger provides primitives to capture
the essential functionality of a debugger: observing
a program’s state, monitoring its control path, and
controlling its execution. This is achieved by explicit
commands embedded in the program. In order to
be debugged, a program must contain explicit trace
points. This is a major difference with the debuggable
interpreter pattern for which program do not need to
be annotated.
Trace library. Hofer et al. (Hofer et al., 2006) pro-
pose a backward-in-time debugger. The Unstuck de-
bugger allows one to navigate the history of the ap-
plication. Their implementation uses a trace library
to collect the events and reconstruct the states. To
generate events (method invocation, variable access
and method return), the methods are instrumented us-
ing ByteSurgeon (Denker et al., 2006), a high-level
library to manipulate method bytecode.
Unstuck assumes that a program is interpreted by
a virtual machine, whereas the debuggable interpreter
design pattern relies on an interpretation driven by a
visitor.
AST instrumentation. The Relational Meta-
Language (RML) (Pop and Fritzson, 2005) is a lan-
guage for writing executable Natural Semantics spec-
ifications. It is used to formally specify program-
ming languages such as Java, Pascal, and MiniML.
The RML debugger is based on an abstract syntax
tree instrumentation that captures and records partic-
ular events. A post-mortem analysis tool is then pro-
vided to walk back and forth in time, display variable
values, and execution points.
The AST is instrumented with debugging anno-
tation related to trace generation. From its design,
the programming environment of RML is limited to
one single debugger per session. On the contrary, our
approach allows several debuggers to coexist.
Grammar weaving. Wu et al. (Wu et al., 2005)
claims that debugging is a concern that crosscuts a do-
main specific language specification. They propose to
use AspectJ
8
to weave the debugging semantics into
the code created by a parser generator.
Their work is restricted to programming lan-
guages that are translated into a general purpose lan-
guage. Our approach is different since it assumes
a program interpretation through a visitor and inter-
preter design pattern.
6 CONCLUSION AND FUTURE
WORK
This paper presents a general approach for imple-
menting and realizing a debugger for a visitor-like in-
terpreter. It extends a visitor with a set of hooks em-
bedded in the visiting methods. The context, primar-
ily used to hold variables bindings, has been extended
with a reference to a parent context, and keeps a refer-
ence to the node currently being interpreted. A debug-
ger service models the different operations available
by means of a set of modes.
To conclude, the Debuggable Interpreter design
pattern offers the benefits of the coexistence of mul-
8
eclipse.org/aspectj/
ICSOFT 2007 - International Conference on Software and Data Technologies
28

tiple debuggers, a capacity to accept new debugging
operations, while being easy to implement.
For future work, we plan to assess the scalability
of the debuggable interpreter design pattern by im-
plementing a larger language such as Java, which in-
volves dozens of nodes.
ACKNOWLEDGEMENTS
We gratefully thank the financial support of Science
Foundation Ireland and Lero – the Irish Software En-
gineering Research Centre.
We also would like to thank Marcus Denker and
Erin Shoemaker for their valuable comments and re-
views.
REFERENCES
Acebal, C. F., Castanedo, R. I., and Lovelle, J. M. C.
(2002). Good design principles in a compiler univer-
sity course. SIGPLAN Not., 37(4):62–73.
AspectJ. AspectJ home page. http://eclipse.org/aspectj/.
Cheong, Y. C. and Jarzabek, S. (1999). Frame-based
method for customizing generic software architec-
tures. In SSR ’99: Proceedings of the 1999 symposium
on Software reusability, pages 103–112, New York,
NY, USA. ACM Press.
Denker, M., Ducasse, S., and Tanter,
´
E. (2006). Runtime
bytecode transformation for Smalltalk. Journal of
Computer Languages, Systems and Structures, 32(2-
3):125–139.
Gamma, E., Helm, R., Johnson, R., and Vlissides, J.
(1995). Design Patterns: Elements of Reusable
Object-Oriented Software. Addison Wesley, Reading,
Mass.
Gamma, E., Helm, R., Vlissides, J., and Johnson, R. E.
(1993). Design patterns: Abstraction and reuse of
object-oriented design. In Nierstrasz, O., editor, Pro-
ceedings ECOOP ’93, volume 707 of LNCS, pages
406–431, Kaiserslautern, Germany. Springer-Verlag.
Hofer, C., Denker, M., and Ducasse, S. (2006). Design
and implementation of a backward-in-time debugger.
In Proceedings of NODE’06, volume P-88 of Lecture
Notes in Informatics, pages 17–32. Gesellschaft f
¨
ur
Informatik (GI).
JDI. Java debug interface (jdi). http://java.sun.com/-
j2se/1.4.2/docs/jguide/jpda/jarchitecture.html.
Lorenz, D. H. (1997). Tiling design patterns a case study us-
ing the interpreter pattern. In OOPSLA ’97: Proceed-
ings of the 12th ACM SIGPLAN conference on Object-
oriented programming, systems, languages, and ap-
plications, pages 206–217, New York, NY, USA.
ACM Press.
Marceau, G., Cooper, G. H., Spiro, J. P., Krishnamurthi, S.,
and Reiss, S. P. (2006). The design and implementa-
tion of a dataflow language for scriptable debugging.
Automated Software Engineering Journal.
Pop, A. and Fritzson, P. (2005). Debugging natural seman-
tics specifications. In AADEBUG’05: Proceedings
of the sixth international symposium on Automated
analysis-driven debugging, pages 77–82, New York,
NY, USA. ACM Press.
Wu, H., Gray, J., Roychoudhury, S., and Mernik, M. (2005).
Weaving a debugging aspect into domain-specific lan-
guage grammars. In SAC ’05: Proceedings of the 2005
ACM symposium on Applied computing, pages 1370–
1374, New York, NY, USA. ACM Press.
THE DEBUGGABLE INTERPRETER DESIGN PATTERN
29
