
SEGMENTATION OF SATELLITE IMAGES IN
OPTOELECTRONIC SYSTEM
Andrey S. Ostrovsky, Ernesto Pino-Mota and Paulo C. Romero-Soría
Facultad de Ciencias Físico Matemáticas, Benemérita Universidad Autónoma de Puebla
A.P. 1152, 70000, Puebla, Pue., Mexico
Keywords: Image Segmentation, Image Classification, Synthetic Discriminant Functions, Optical Image Processing.
Abstract: The problem of segmenting the satellite images into homogeneous texture regions that correspond to the
different classes of terrestrial surface is considered. It is shown that this problem may be successfully solved
by using the method of spectral synthetic discriminant functions recently proposed by the authors for
classification of random image fields and realized by means of a rather simple optoelectronic technique. The
experimental results of segmenting the true satellite images are given.
1 INTRODUCTION
One of the central problems in automatic processing
of satellite images is to segment the given image into
homogeneous texture regions corresponding to
different classes of the terrestrial surface such as
different urban zones, mountainous zones, wooded
zones, agricultural zones, aquatic zones, etc. (Wu et
al, 1995). A specific feature of this problem is in the
fact that the images to be classified have
fundamentally random within-class variations so that
they must be viewed as being perfectly random or
stochastic. In this situation, one is better off talking
about the random image field and not the image
itself, i.e., as a deterministic function of space.
Recently we proposed a new method for
classification of such images in which we use the
special discriminant functions being synthesized to
separate linearly the power spectra of random image
fields of different classes (Ostrovsky et al, 2003).
We refer to this method as spectral synthetic
discriminant function (SSDF) method. In this paper,
we show how the SSDF method realized by menas
of a rather simple optoelectronic system may be
used for segmenting the satellite images.
2 SSDF METHOD
We consider a certain image of the nth classs (n =
1,…, N) as the 2-D kth (k = 1,…, K) sample
function
(
)
yxf
nk
, of a stationary and isotropic
random field
(
)
yxf
n
, with a power spectrum
() ()
2
;,
1
lim RF
R
S
nk
R
n
θρρ
∞→
= , (1)
where
() ()
ϕθρ
π
,;,
2
00
rfRF
nk
R
nk
∫∫
=
()
[
]
ϕ
θ
ϕ
ρ
π
ddcos2exp rrri −
−
×
, (2)
is the finite Fourier transform of
()
yxf
nk
, over the
domain of radio R occupied by the image,
()
ϕ
,r and
(
)
θ
ρ
, are the polar coordinates in the spatial and
spatial-frequency domains respectively, and the
angular brackets denote the expected value operation
over the ensemble index k. The SSDFs are defined
as linear combinations of power spectra
()
ρ
n
S , i.e.,
() ()
∑
=
=
N
l
lmlm
Sah
1
ρρ
, Nm ,...,1= , (3)
such that the following identity is determined:
() ()
nmmn
hS
δρρρ
≡
∫
∞
d
0
, (4)
408
S. Ostrovsky A., Pino-Mota E. and C. Romero-Soría P. (2007).
SEGMENTATION OF SATELLITE IMAGES IN OPTOELECTRONIC SYSTEM.
In Proceedings of the Fourth International Conference on Informatics in Control, Automation and Robotics, pages 408-411
DOI: 10.5220/0001615204080411
Copyright
c
SciTePress
where
nm
δ
is the Kronecker symbol. On substituting
for
()
ρ
m
h from Eq.(3) into Eq. (4) and taking for
granted the hypotesis of linear independence among
the power spectra
()
ρ
n
S for different classes, one
can find the unknown coefficients
ml
a as the
solutions of the system of linear equations
() ()
∑
∫
=
∞
=
N
l
nmlnml
SSa
1
0
d
δρρρ
, Nmn ,...,1, = . (5)
Once the SSDFs have been calculated in accordance
with Eq. (3), a procedure for classifying the
unknown sample image
()
yxf
k
,
0
is to verify
identity (4) for every m when substituting for
(
)
ρ
n
S
the power spectrum
()
ρ
0
S of corresponding image
field
()
ρ
0
f .
As can be seen from Eq. (3), in oder to
determine the SSDFs, is necessary to know each
power spectrum given by Eq. (1); this presupposes
averaging over the infinite ensemble of infinitely
extensive sample images. Actually, we always have
available a finite number of finitely extensive
sample images, a fact that leads to the statistical
formulation of the problem.
The quantity that can be directly measured in an
experiment is the sample power spectrum integrated
in the azimuthal direction, i.e.,
() ()
θθρ
π
ρ
π
d;,
2
1
;
2
2
0
RF
R
RS
nknk
∫
=
. (6)
In the stage of SSDF synthesis, when we commonly
dispose a sufficiently large number of sample
images, the consistent estimate of power spectrum
()
ρ
n
S can be obtained by averaging the sample
spectra (6) over the ensemble index k:
()
∑
=
∧
=
K
k
nk
n
RS
K
S
1
;
1
ρ
. (7)
In the stage of classification, usually just one sample
image is available, so that identity (4) has to be
substituted for the equation
()()
nmk
n
nk
N
l
ml
uSRSa =
∧
=
∞
∑
∫
ρρρ
d;
1
0
, (8)
where
nmk
u is the kth sample value of some random
variable
nm
u . To maximize the reliability of correct
classification it is obvious to require that
(
)
nmmlnm
au
δ
= (9)
and
Var
(
)
ml
a
mlnm
au min→ . (10)
This can be readily achieved by applying the well
known least-square technique. Once the SSDFs have
been calculated in this way, the decision on the class
to which the sample image
()
yxf
k
,
0
belongs can be
made according to index m of the largest value
mk
u
0
.
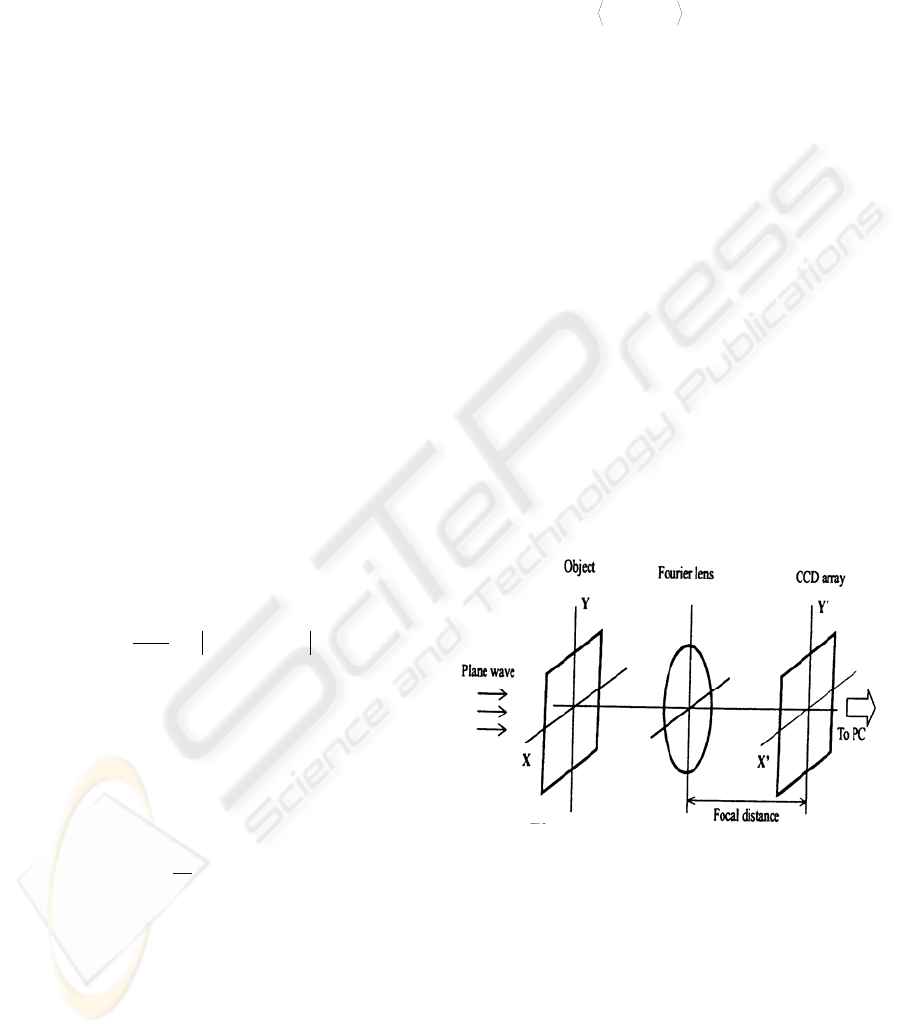
3 OPTICAL REALIZATION
As apears from the previous section, the
fundamental problem with practical realization of
the SSDF method is calculating the sample power
spectrum given by Eq. (6). For this purpose the
coherent optical Fourier processor shown in Fig. 1
may be employed.
Figure 1: Optical Fourier processor.
As is well known (Goodman, 1986), if in the
object plane of this processor a transparency with
amplitude transmittance
()
yxf , within a finite
domain D of radio R is placed, then the intensity
distribution of light field registered by the CCD
detector array in the back focal plane of the Fourier
transforming lens is given by
SEGMENTATION OF SATELLITE IMAGES IN OPTOELECTRONIC SYSTEM
409
() ()
∫∫
=
)(
,,
D
yxfqpI
()
[]
2
dd2exp yxyqxpi +−×
π
, (11)
where
fxp
λ
/
′
= , fyq
λ
/
′
= ,
λ
is the wavelength
of illumination, and f is the focal length of the lens.
Using the polar coordinates for input and output
planes of the Fourier processor, Eq. (11) may be
rewritten as follows:
() ()
ϕθρ
π
,,
2
00
rfI
R
∫∫
=
()
[]
2
dd2exp
ϕθϕρπ
rrri −−× . (12)
Comparing the latter equation with Eq. (2) and (5),
we come to conclusion that the sample power
spectrum
()
RS
nk
;
ρ
may be easily calculated in any
PC-compatible system connected with CCD array.
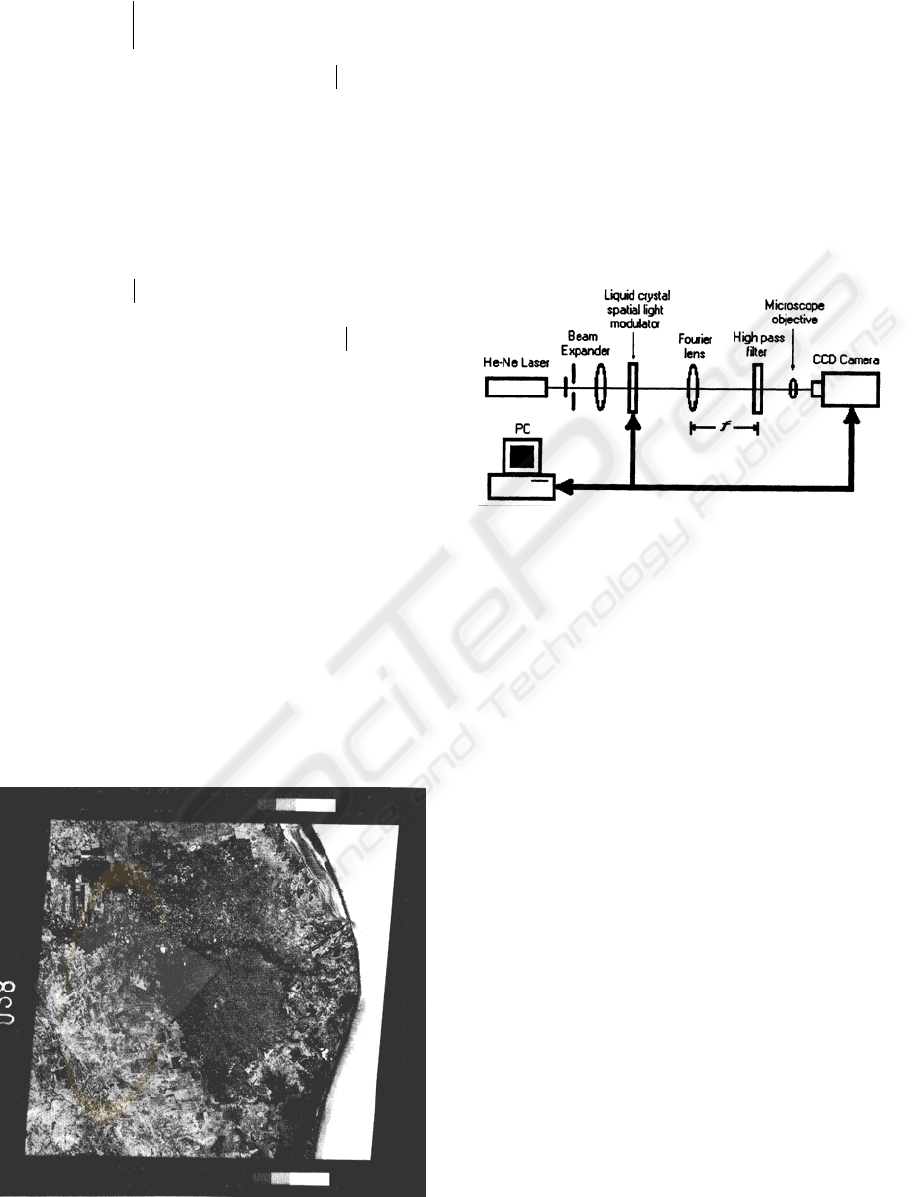
4 EXPERIMENTAL RESULTS
We performed a physical simulation experiment on
segmentation of true satellite (Landsat) images into
homogeneous regions that correspond to four
different classes of terrestrial surface, to wit, “sea”,
“mountains”, “crops” and “settlement”. An example
of such an image is shown in Fig. 2. Each class of
texture images to be classified was considered a
spatially stationary and isotropic random field.
Figure 2: True satellite image used in the experiment.
The experimental setup is sketched schematically
in Fig. 3. The images to be processed in this setup
were previously converted into numerical files using
a standard scanning technique. To provide the
capture of the digitalized images into the optical
Fourier processor, the liquid crystal spatial light
modulator HoloEye-LC2002 (800
× 600 pixels)
controlled by PC was used. The detection of the
light distribution in the output plane of the Fourier
processor was realized by means of the CCD camera
SONY-SSC-M374 (768
×
494 pixels).
Figure 3: Experimental setup.
In our experiment, at the stage of SSDF
synthesis, we used 50 images of 10
× 10 mm for
each of four classes. At the stage of segmentation we
used the composed full-scale image of 100
×
100
mm and realized its 2-D scanning by an aperture of
5
×
5 mm with a discrete step of 5 mm. At every step
of image scanning the corresponding texture image
was classified in accordance with the SSDF method.
Calculation of SSDFs and values
mk
u
0
(see Eq. (8))
was realized in a PC-system using specially
designed software. Decision on image class at every
step of scanning was made on the basis of
thresholding the output data. If none or more than
one of
mk
u
0
values had exceeded the threshold, the
corresponding image region was considered to be
unclassified. The result of four-class segmentation
that corresponds to the satellite image in Fig. 2 is
shown in Fig. 4. The regions of the segmented image
labeled by “
0” correspond to unclassified images.
As can be seen, in the main these regions correctly
repeat the true shape of the boundaries between
terrestrial surface images of different classes, but, in
certain cases, they occupy a rather large area of the
image. The latter can be explained by the fact that,
in reality, our satellite image contains textures of
more than four classes mentioned above (e.g.,
regions of the terrestrial surface covered by clouds),
ICINCO 2007 - International Conference on Informatics in Control, Automation and Robotics
410

but more profound study of this problem exceeds the
limits of our consideration.
2 2 0 0 0 0 0 0 0 0 0 0 0 0 1 1 0 1 1 1
0 0 0 0 4 4 4 0 0 0 3 3 0 0 0 1 1 0 1 1
0 4 0 4 0 4 4 4 0 3 3 3 3 0 0 0 0 1 1 1
0 4 4 0 4 0 0 0 0 3 3 3 3 3 0 0 0 1 1 1
4 4 4 4 0 0 0 0 3 3 3 3 3 3 3 0 0 0 1 1
0 4 4 4 0 0 0 0 3 3 3 3 3 3 3 3 0 0 1 1
0 0 3 3 0 0 0 0 3 0 0 0 0 0 3 0 0 1 0 1
0 0 0 0 0 0 0 3 3 3 3 0 3 3 0 0 0 0 0 1
0 0 0 0 0 0 0 3 3 3 3 3 3 3 3 3 0 0 0 1
0 0 1 0 0 0 0 0 3 3 3 3 3 3 3 0 0 0 0 1
0 0 1 0 0 0 0 0 3 3 3 3 3 3 3 0 0 0 0 1
2 0 0 1 0 0 4 0 3 3 3 3 3 3 0 0 0 0 1 1
2 2 0 0 0 4 4 0 3 3 3 3 3 3 0 0 0 0 1 1
2 2 2 0 0 0 4 4 0 3 3 3 3 3 0 0 0 0 1 1
2 2 2 2 0 0 0 0 0 3 3 3 3 0 0 1 1 0 1 1
2 2 2 2 0 0 1 0 0 0 3 3 0 0 0 1 0 0 1 1
2 2 2 2 2 0 0 1 0 0 0 0 0 0 0 0 0 0 1 1
2 2 2 2 2 2 0 0 1 0 0 0 1 1 0 0 0 0 1 1
2 1 2 2 2 2 2 0 0 0 0 0 1 0 0 1 0 1 1 1
2 2 2 2 2 2 2 0 1 1 1 0 0 0 0 0 0 1 1 1
Figure 4: Labled map of the satellite image shown in Fig.
2. Lables: 1 – “sea”, 2 – “mountains”, 3 – “crops”, 4 –
“settlement”, 0 – “unclassified image”.
5 CONCLUSIONS
As has been shown the problem of segmentating the
satellite images into homogeneous regions that
correspond to different classes of the terrestrial
surface may be successfully solved by using the
SSDF method for classification of random image
fields realized by means of rather simple
optoelectronic technique.
ACKNOWLEDGEMENTS
The authors gratefully acknowledge the support of
Mexican National Council of Science and
Technology – CONACYT, under project SEP-2004-
C01-46510.
REFERENCES
Wu, H.-S., Qian, J., Barba, J., 1995. A classified algorithm
for segmentation of multispectral images, Journal of
Imaging Science and technology, Vol. 39.
Ostrovsky, A.S., Pino-Mota, E., Palma-Cuatianquiz, J.,
2003. Optical classification of random image fields
using spectral synthetic discriminant functions. Optics
and Laser in Engineering, Vol. 40/1-2.
Goodman, J.W., 1986. Introduction to Fourier optics,
McGraw. New York, 2
nd
edition.
SEGMENTATION OF SATELLITE IMAGES IN OPTOELECTRONIC SYSTEM
411
