
A MULTI CRITERIA EVALUATION OVER A FINITE SCALE
FOR MAINTENANCE ACTIVITIES OF A MOTORWAY
OPERATOR
Céline Sanchez
(1)
, Jacky Montmain
(2)
, Marc Vinches
(2)
and Brigitte Mahieu
(1)
(1)
Service Structure Viabilité Sécurité, Société des Autoroutes Estérel Côtes d’Azur Provence Alpes
avenue de cannes, 06211 Mandelieu Cedex, France
(2)
Ecole des Mines d’Alès,6 avenue de Clavières, 30319 Alès Cedex, France
Keywords: Multi-criteria decision-making, Multi-criteria aggregation, Finite scale, Decision support system, Motorway
infrastructure.
Abstract: The Escota Company aims at the formalization and improvement of the decisional process for preventive
maintenance in a multi criteria (MC) environment. According to available pieces of knowledge on the
infrastructure condition, operations are to be evaluated with regards to (w.r.t.) technical but also to
conformity, security and financial criteria. This MC evaluation is modelled as the aggregation of partial
scores attributed to an operation w.r.t. a given set of n criteria. The scores are expressed over a finite scale
which can cause some troubles when no attention is paid to the aggregation procedure. This paper deals
with the consistency of the evaluation process, where scores are expressed as labels by Escota’s experts,
whereas the aggregation model is supposed to deal with numerical values and cardinal scales. We try to
analyse this curious but common apparent paradox in MC evaluation when engineering contexts are
concerned. A robustness study of the evaluation process concludes this paper.
1 ESCOTA DECISION PROCESS
1.1 Context
The Escota Company, founded in 1956, is the
leading operator of toll motorways in France. Due to
its integration into the Provence-Alpes-Côte d'Azur
region, Escota is committed, as every motorway
operator, to a sustainable development approach,
including the social, economic and environmental
aspects of its activities. Every year, specific
initiatives are undertaken, or repeated, to include the
motorway network in a sustainable development
approach. Within this scope, the Escota Company
aims at the formalization and improvement of the
decisional process for preventive maintenance and
property management in a multi actors and multi
criteria (MC) environment. These decisions concern
upkeep, improvement and upgrading operations,
involving technical, conformity, security or financial
criteria. The operations are related to operating
domains such as constructive works, carriageways,
vertical roadsigns and carriageway markings,
buildings, prevention of fire risks, open spaces…
Managing such a complex infrastructure necessitates
a dynamic Information Processing System (IPS) to
facilitate the way decision-makers use their
reasoning capabilities through adequate information
processing procedure.
1.2 Valuation of the Infrastructure
Condition
Periodic inspections are performed to detect and
measure, as early as possible, any malfunction
symptoms affecting an element of the infrastructure
(EI). The expert in charge of an operating domain
then analyses the technical diagnosis relative to the
EI. He evaluates the situation seriousness in terms of
technical risk analyses. This evaluation relies on a
specific set of n criteria relative to his domain. An
aggregation with a weighted arithmetic mean
(WAM) is then performed to assess a global degree
of emergency to the corresponding maintenance
operation. This evaluation is then submitted to the
official in charge of the operating network. This
68
Sanchez C., Montmain J., Vinches M. and Mahieu B. (2007).
A MULTI CRITERIA EVALUATION OVER A FINITE SCALE FOR MAINTENANCE ACTIVITIES OF A MOTORWAY OPERATOR.
In Proceedings of the Fourth International Conference on Informatics in Control, Automation and Robotics, pages 68-76
Copyright
c
SciTePress

latter coordinates the experts’ needs and demands
for operation planning purposes.
This paper deals more particularly with the MC
evaluation process by the expert of an operating
domain, i.e. the affectation of an emergency degree
to an operation. There exist several methods to
identify and perform aggregation process with a
WAM. The Analytic Hierarchical Process, AHP, is
probably the most famous one in industry (Saaty,
1980). However, because it explicitly guarantees the
consistency between the commensurable scales it
aggregates and the WAM operator it identifies, the
Measuring Attractiveness by a Categorical Based
Evaluation TecHnique method, MACBETH, has got
recent successes (Bana e Costa, 1994)(Clivillé,
2004). In our application, MACBETH is first used to
build the valuation scale associated to each
emergency criterion of a domain. It is then applied
to determine the WAM parameters.
Furthermore, the way experts give their
assessment in natural language raises another
problem (Jullien, 2006). These labels are commonly
converted into numerical values to perform the
aggregation process. No particular attention is
generally paid to this “translation”. However the
consequences over the aggregation results are
damageable. In civil engineering, the culture of
numbers is strongly developed. People commonly
manipulate symbolic labels but may convert them
into more or less arbitrary numerical values when
necessary without further care. This cultural
viewpoint explains why an aggregation operator is
generally preferred to a rule base whereas appraisals
are expressed in terms of symbolic labels (Jullien,
2006). A completely symbolic evaluation over finite
scales could be envisaged (Grabisch, 2006).
Let us illustrate the scales problem with the
following example. Let us suppose that the semantic
universe of an expert w.r.t. the seriousness of a
symptom is: {insignificant, serious, alarming}. We
can imagine that a corresponding possible set of
discrete numerical values (in [0; 1]) could be: {0;
0.5; 1}. There are several assumptions behind this
translation concerning the nature of the scale. This
point will be discussed later. Let us just note here
that the numerical values are commonly chosen
equidistant. Now let us consider another semantic
universe: {insignificant, minor, alarming}. This
time, the associated set of numerical values {0; 0.5;
1} intuitively appears more questionable. The expert
should prefer {0; 0.25; 1}. When seriousness
degrees of several symptoms are to be aggregated,
the result of the WAM aggregation strongly depends
on the choice of the set of numerical values.
Furthermore, in any case, the numerical WAM value
does not necessary belong to {0; 0.5; 1} or {0; 0.25;
1}. It must then be converted into the convenient
label in return.
The way labels are converted into numerical
values (and back) coupled to the commensurability
of the scales of the dimensions to be aggregated can
entail serious problems when aggregating without
any care. In this paper, we propose a methodology to
build finite partial valuation scales consistently with
WAM aggregation.
The paper is organized as follows. Some
considerations are given about the way continuous
cardinal scales are constructed with the Escota
operating domain experts. Then, it is explained how
to build a WAM aggregation operator w.r.t. each
operating domain, in order to be consistent with the
identified scales. The MACBETH method is the
support of these first two steps. The problem related
to the finite scales, that the experts use when
assigning partial scores to an operation, is then
considered. A method is proposed to ensure a
logically sound interface between symbolic
assessments and numerical computations in the
framework of WAM aggregation. Then, a robustness
analysis is proposed to determine the potential
causes of overestimation or underestimation in the
evaluation process of an operation.
2 CARDINAL SCALES OF
EMERGENCY DEGREES
2.1 Nature of Scales
The purpose of this section is to explain how we
have worked with Escota experts of the different
operating domains in order to properly identify their
emergency scales. There are one emergency scale
for each criterion of the domain and one scale for the
aggregated emergency value. In the following we
will consider the case of the operating domain
“carriageway”. Eight criteria (n=8) are related to it:
security, durability, regulation, comfort, public
image, environment protection, sanitary and social
aspects.
It has been checked a priori that Escota
emergency scales are of cardinal nature: the
emergency scale relative to any of the criteria is an
interval scale.
Let us consider a finite set X. When the elements of
X can be ranked w.r.t. to their attractiveness, this is
ordinal information. It means that a number n(x) can
be associated to any element x of X such that:
A MULTI CRITERIA EVALUATION OVER A FINITE SCALE FOR MAINTENANCE ACTIVITIES OF A
MOTORWAY OPERATOR
69
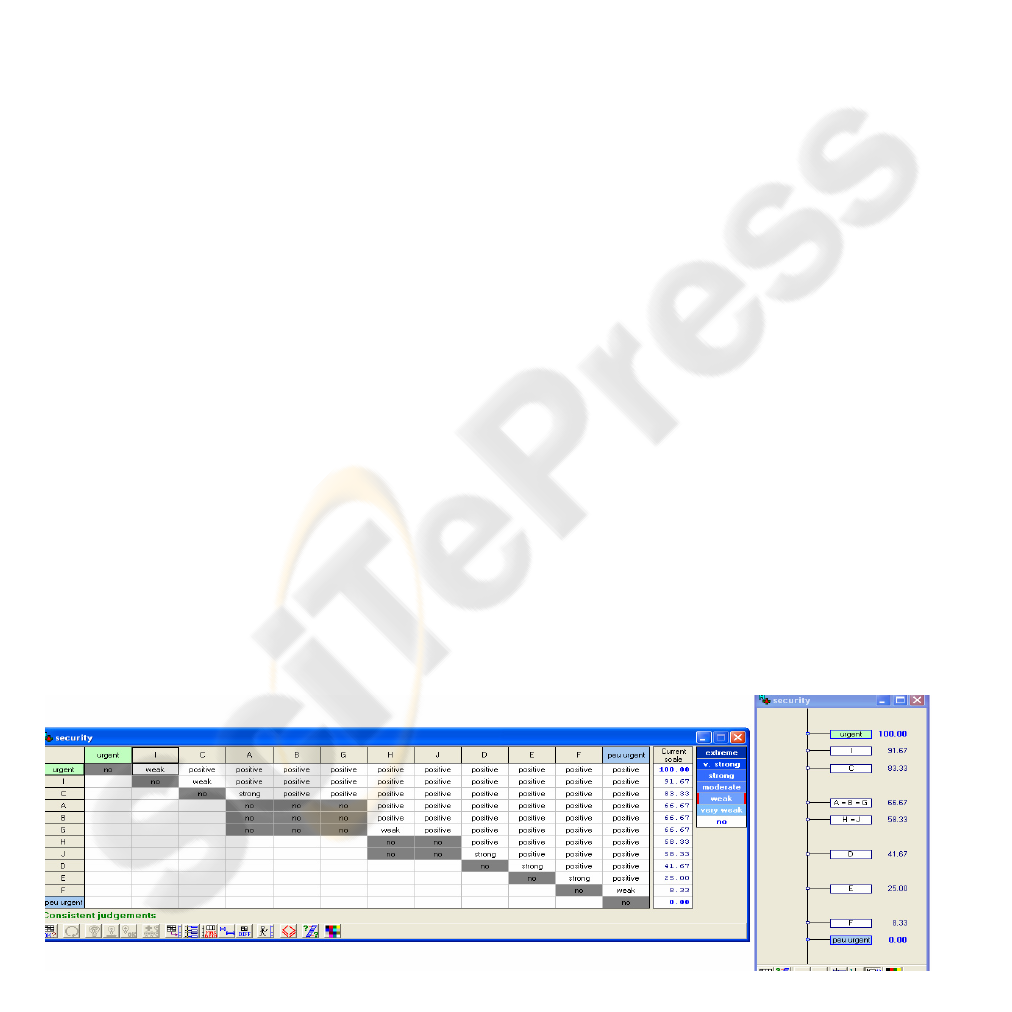
Figure 1: MACBETH - Pair to pair comparison of operations and cardinal scale for security criterion.
,:[ ()()]
x
yXxy nx ny∀∈ Ρ⇔ f (1)
,:[ ()()]
x
yXxy nx ny∀∈ Ι⇔ =
(2)
where relation P « is more attractive than » is
asymmetric and non transitive and relation I « is as
attractive as » is an equivalence relation. n(x)
defines an ordinal scale.
Based upon this first level of information, an
interval scale can then be built. The next step
consists in evaluating the difference of intensity of
preference between elements of X. It implies the
following constraints:
Ν
∈=− kkynxn ,)()(
α
(3)
where k characterizes the intensity of preference
and
α
enables to respect the limits of the domain
(for example [0,1]). The resolution of a system of
equations of type (1), (2) and (3) provides an
interval scale. That’s the principle used in the
MACBETH method (Bana e Costa, 1994).
2.2 Emergency Scales and MACBETH
Method
The problem of commensurability of the dimensions
to be aggregated is at the heart of the MACBETH
method. Aggregation can be envisaged only if the
scales relative to the emergency criteria are
commensurable (Clivillé, 2004). Then, MACBETH
guarantees the consistency between the resulting
partial scales and the WAM aggregation (Bana e
Costa, 1994).
First, a training set of operations is constituted.
A ranking of the operations in terms of emergency is
established w.r.t. each criterion. At this stage,
information is purely ordinal. Then, for each
criterion, the solutions are compared pair to pair.
Two fictive alternatives are introduced in the
comparison process; they provide the reference
values corresponding to the two emergency degrees:
zero and one. The zero (resp. one) emergency degree
corresponds to the threshold value under which
operations are considered as not urgent at all (resp.
highly urgent). The comparison then consists in
quantifying the difference of emergency degree for
each criterion. This difference is expressed in a finite
set of labels: for example, “equivalent”, “weak”,
“strong” and “extreme”. The resulting set of
constraints defines a linear programming problem.
The solution of this problem provides the cardinal
scale of emergency associated to one criterion. This
step is repeated for each criterion.
Figure 1 illustrates this process for criterion
security. The carriageway expert compares 10
operations {A… J} pair to pair. The real names of
operations are not given for confidentiality reasons.
Two fictive operations urgent (highly urgent) and
peu_urgent (not urgent at all) complete the training
base. The “positive” label in figure 1 introduces a
more flexible constraint because it simply replaces
any label with a higher degree than weak. The
resulting cardinal scale is given at the right side of
Figure 1.
Finally, this procedure is then applied to identify the
weights of the WAM operator. The pair to pair
comparison is carried out over the eight criteria of
the carriageway domain (Figure 2). The resulting
interval scale of weights is given in Figure 2. Let us
note the weights
i
p
,
1..in=
(n=8 for the
carriageway domain). At this stage of the modelling,
the carriageway expert has identified his 8
emergency scales and his WAM parameters. He is
supposed to be able to compute the global degree of
emergency of any operation when partial quotations
i
u
are available, w.r.t. each criterion:
1
() .
n
ii
i
WAM OP p u
=
=
∑
ICINCO 2007 - International Conference on Informatics in Control, Automation and Robotics
70
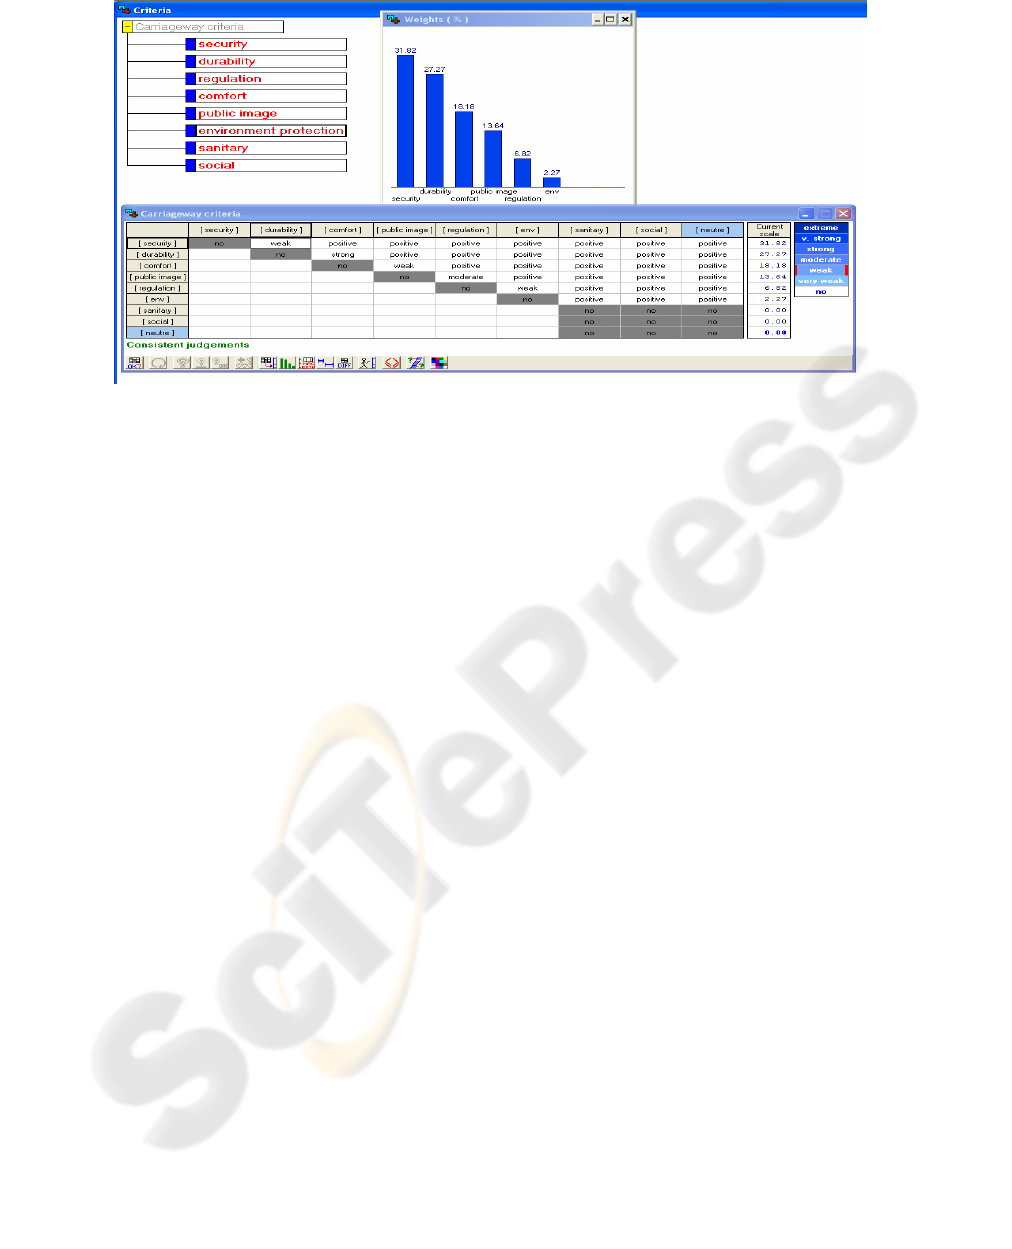
Figure 2: MACBETH - Pair to pair comparison of carriageway criteria and weights identification.
3 DISCRETE CARDINAL
SCALES OF EMERGENCY
Partial scores aggregation does not cause any
problem when quotations referred to continuous
cardinal scales. As explained in section 1, it is more
questionable when partial scores are expressed on a
discrete or finite scale. Indeed, Escota experts
express their assessment w.r.t. each criterion on a
finite set of 3 labels
123
{, , }UUU . The different U
i
define a discrete cardinal scale. However, computing
the WAM value necessitates assigning numerical
values to each U
i
. In the following, we describe the
way this assignment can be achieved in a consistent
manner with previous MACBETH identification
phases.
A continuous cardinal scale has been identified
with MACBETH method for the emergency scale of
each criterion. The problem is now to assign a set of
numerical values
{
}
iii
uuu
321
,, to
123
{, , }UUU
for
criterion i. Let us suppose the continuous cardinal
scale for criterion i has been identified with a
training set of q operations. These operations are
grouped into 3 clusters corresponding to
123
,,UUU
.
The computation of the clusters and their associated
centres is achieved by minimizing the quadratic
difference
3
2
11
(())
k
q
ii
kj
kj
uuOP
==
−
∑∑
where
k
q is the
number of operations in class
k
U (
3
1
k
k
qq
=
=
∑
) and
()
i
j
uOP
, j=1..q, the emergency degree of an
operation
j
OP
computed with MACBETH
(Figure 1).
In the example of Figure 1, the computation of
clusters gives:
sec
1
0.91
urity
u =
,
sec
2
0.52
urity
u =
and
sec
3
0.11
urity
u = .
This assignment is repeated for each criterion
relative to the carriageway domain. Then, the WAM
can be numerically computed:
• For each criterion i , 1..in= ( 8n = ), a value
k
U is affected to an operation OP. Let us note this
emergency degree
()ki
U ;
•
OP
is thus described by its vector of
emergency degrees
(1) ( )
[,.., ]
kkn
UU;
• The corresponding vector of numerical
values is:
12
(1) ( 2) ( )
{ , ,.., }
n
kk kn
uu u
;
()
1
() .
n
i
iki
i
WAM OP p u
=
=
∑
(4)
The last constraint to be satisfied is that the
WAM values must be converted in return into the
semantic universe
123
{, , }UUU . The output of the
WAM operator must be discretized in
123
{, , }UUU .
The problem is thus to determine the centres of the
k
U clusters of the aggregated emergency scale
(WAM values).
Let us note that the WAM operator is idempotent.
Therefore, we must have:
, {1, 2, 3}, ( , ..., )
kkkk
Uk WAMU U U
∀
∈= (5)
A MULTI CRITERIA EVALUATION OVER A FINITE SCALE FOR MAINTENANCE ACTIVITIES OF A
MOTORWAY OPERATOR
71
A sufficient condition for (5) is that the centres
of the
k
U clusters of the aggregated emergency
scale are the images of the corresponding
k
U
centres of the partial emergency scales by the WAM
function, i.e.:
1
1
( ,.., ) .
n
niAg
kk ikk
i
WAM u u p u u
=
==
∑
(6)
where
Ag
k
u is the centre of class
k
U in the
aggregated emergency scale.
Consequently, when an operation is defined by
its partial emergency vector
(1) ( )
[ ,.., ]
kkn
UU,
equation (4) provides the numerical value
8
()
1
() .
i
iki
i
WAM OP p u
=
=
∑
(7)
Then, the attribution of a class
k
U in the
aggregated emergency scale is obtained through the
following calculation:
()
1
min .
n
Ag i
kiki
k
i
upu
=
−
∑
(8)
The value of k in
{1, 2 , 3}
that minimizes the
expression in (8) provides the class
k
U of operation
OP.
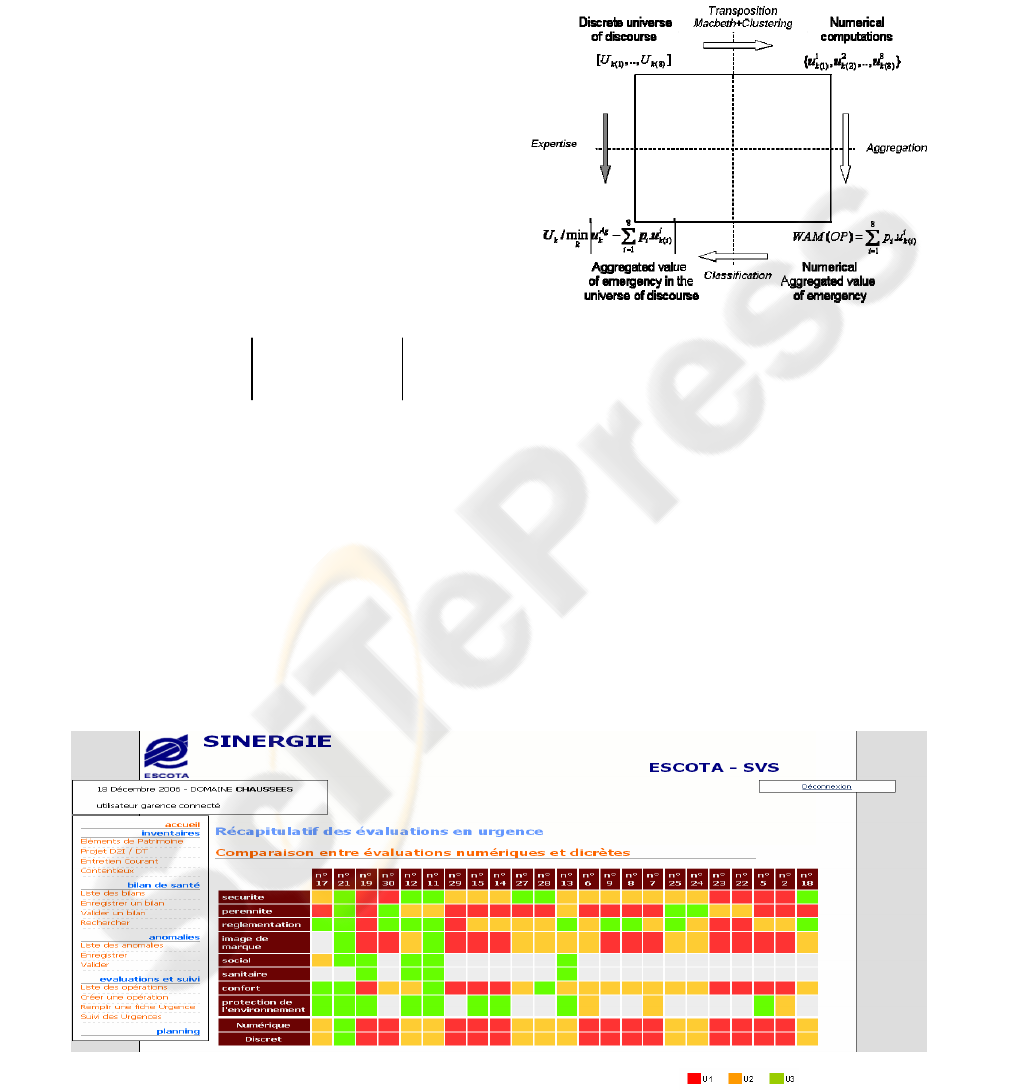
Figure 3 summarizes the whole evaluation
process of an operation OP. The validation of this
process has been carried out with a test base of 23
operations in the carriageway domain. The
carriageway expert has analysed each of these
operations. For each of them, he has attributed
emergency degrees in the Escota normalized
semantic universe
123
{, , }UUU w.r.t. every of his
8 criteria.
Then, the aggregated emergency degree in this
semantic universe can be computed using the 3-step
process described in this paper (white arrows in
Figure 3). Besides these computations, the expert
has been asked to directly attribute an overall
emergency degree to each of the 23 operations (grey
arrow in Figure 3).
Figure 3: Evaluation process of an operation.
Figure 4 reports these data. The last line
corresponds to the direct expert evaluation (grey
arrow). The last but one line provides the
corresponding computed values with the 3-step
method (white arrows). No error has been observed.
However, the poor semantic universe—only 3
labels—implied in our application can also partly
explain such a perfect matching.
Figure 4: Tests on the evaluation method over a base of 23 operations
.
ICINCO 2007 - International Conference on Informatics in Control, Automation and Robotics
72
4 THE MC HIERARCHICAL
EVALUATION BY ESCOTA
In this paper, the study was focused on the MC
evaluation by the expert of an operating domain.
However, as evocated in section 1, planning of
operations, by Escota, is more complex. The
emergency assessment by operating domain experts
described here is only part of a hierarchical MC
evaluation process. From symptoms detection on
elements of infrastructure to operation planning, a
similar MC evaluation is carried out at different
functional levels in the Escota organization.
The complete information processing used for
Escota preventive maintenance can be formalized as
the following sequence of risk analysis. Periodic
inspections are performed to detect and measure any
malfunction symptoms as early as possible. The
expert in charge of a domain then analyses these
technical diagnoses and evaluates the situation
seriousness. The official in charge of the operating
network coordinates and ponders the experts’ needs
and demands. Each actor of this information
processing system participates to a tripartite MC
decision-making logic: measurement, evaluation and
decision. To each step of this process corresponds a
specific set of criteria and an aggregation operator:
seriousness of a malfunction results from a
prescribed aggregation of the symptoms quotation;
the expert’s interpretation of the diagnosis associates
an emergency degree to the corresponding
maintenance operation w.r.t. the criteria relating to
his operating domain (technical risks assessment);
finally, the manager attributes a priority degree to
the operation on the basis of a set of more strategic
criteria (strategic risks analysis).
This hierarchical MC evaluation process enables
to breakdown the decision-making into elementary
steps. Each step collaborates to the enrichment of
information from measures to priority degrees and
thus contributes to the final step, i.e. operation
planning.
We have developed a dynamic Information
Processing System (IPS) to support this hierarchical
MC evaluation of the infrastructure condition and
facilitate the way decision-makers use their
reasoning capabilities through adequate information
processing procedure.
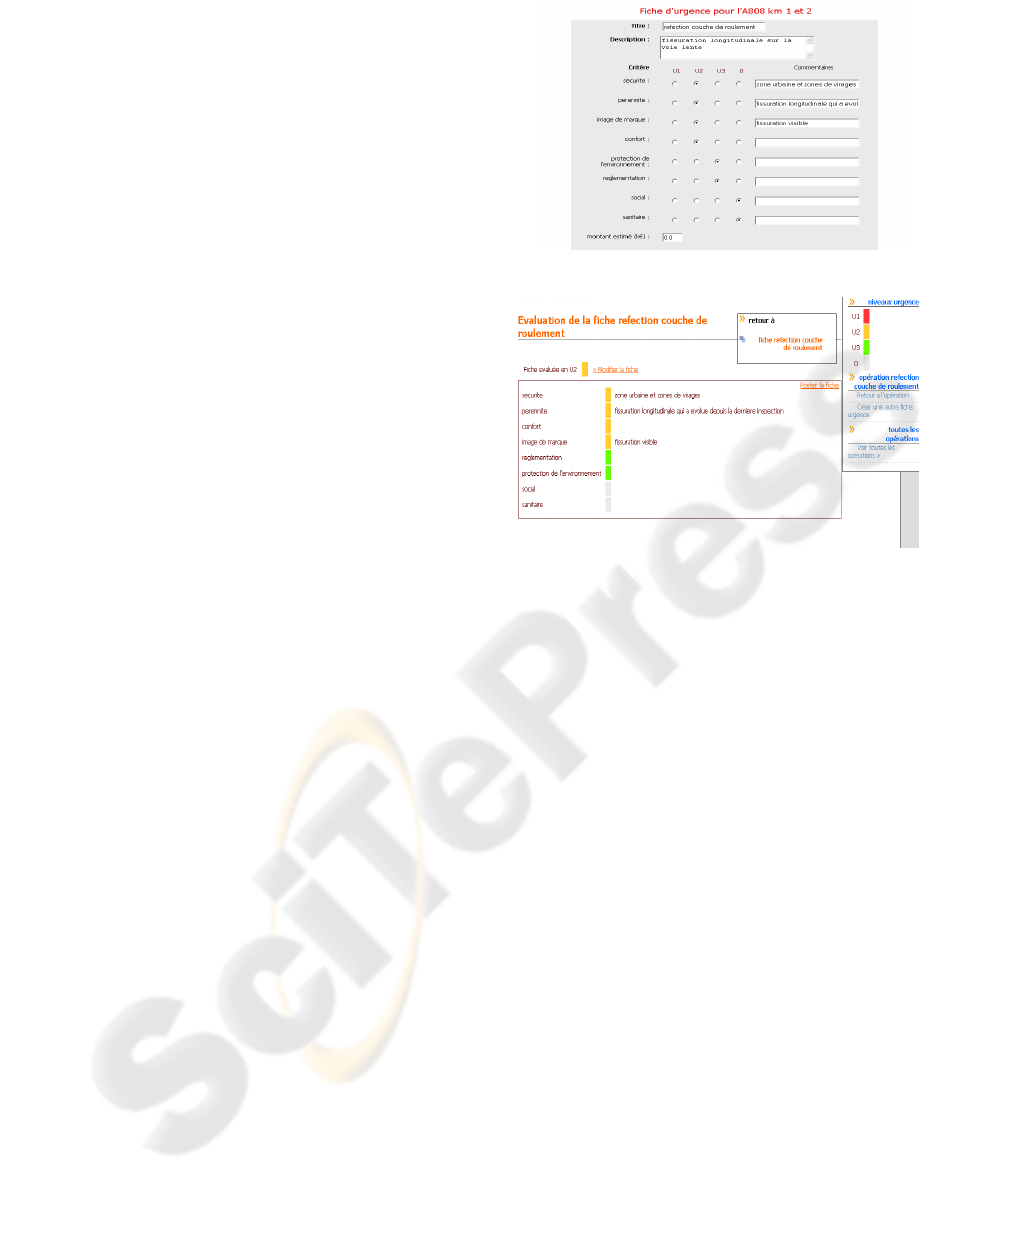
Figure 5 illustrates the man machine-interface
the expert has at his disposal to fulfil an emergency
form relative to an operation. Finally, the emergency
evaluation synthesis (Figure 6) can be consulted by
the official in charge of the operation network before
he proceeds to his own MC evaluation.
Figure 5: Keyboarding of an emergency form.
Figure 6: Emergency evaluation synthesis.
5 THE ROBUSTNESS ANALYSIS
OF THE EVALUATION
PROCESS
Let us now consider a last step in the evaluation
process: assessment of the risk of erroneous
estimation w.r.t. the emergency of an operation, i.e.,
the risk of underestimation or overestimation of the
aggregated emergency score of an operation. It relies
on a robustness analysis of the evaluation procedure
based upon the WAM. Two aims are assigned to this
step, it must answer the following questions: 1)
when an erroneous partial estimation is done w.r.t.
criterion i, what is the risk the aggregated emergency
degree to be affected? 2) when an operation appears
to be underestimated (resp. overestimated), which
criteria could most likely explain this faulty result?
The first question corresponds to an a priori risk
estimation of erroneous evaluation; the second
question is related to a diagnosis analysis.
Let us first define the notion of neighbourhood of
a vector of emergency degrees
(1) ( )
[ ,.., ]
kkn
UU
associated to an operation OP. The vectors of the
neighbourhood of
(1) ( )
[ ,.., ]
kkn
UU
are all the vectors
''
(1) ( )
[ ,.., ]
kkn
UU
such that:
'
() ()
{1 . . } ,
ki ki
inUU∀∈ =
or
'
()ki
U
is the value just above (resp. below)
()ki
U
(when
A MULTI CRITERIA EVALUATION OVER A FINITE SCALE FOR MAINTENANCE ACTIVITIES OF A
MOTORWAY OPERATOR
73

defined; indeed, there is no value below zero and no
value above
1
U
). The neighbourhood is a set of
vectors denoted
(1) ( )
([ ,.., ])
kkn
UUΝ
. In the example in
dimension 2 in Figure 8,
(1) 2k
UU=
and
(2) 2k
UU
=
.
The values of component
i
(12)ior=
of a neighbour
vector may be
2
U
,
1
U
or
3
U
. There are 8
neighbours. In the general case, the maximal number
of neighbours is
31
n
− .
Figure 7: Neighbourhood of the vector of emergency
degrees (U
2
, U
2
) in dimension 2.
5.1 Risk of Erroneous Estimation
The risk of misclassification of an operation due to
an overestimation (resp. underestimation) w.r.t. a
criterion
i enables the expert in charge of a domain
to assess the impact of an evaluation error w.r.t.
criterion
i on the overall emergency degree of the
operation. The higher, the more carefully the partial
appraisal w.r.t. criterion
i must be carried out.
Compute
()WAM U
For each criterion i :
• Find all the vectors
''
(1) ( )
' [ ,.., ]
kkn
UU U=
in
()UΝ
such that
'
()ki
U
takes the value just above
()ki
U
(when defined, else
() 1ki
UU=
and there is no risk of
underestimation w.r.t. criterion i in this case). Note this
set:
_
()Under i U
• Count the numbers of vectors
'U
in
_
()Under i U
such that
(')WAM U
is higher than
()WAM U
. Note this number
_under i
n
• The risk of underestimation induced by
criterion i for an operation characterized by
U
is then:
_
_()
_
()
under i
n
risk under i
Under i U
=
The lower, the weaker the impact of the criterion to
the global emergency degree. The risk analysis is
based upon the following algorithm. We’ll first
consider the risk of underestimation for sake of
simplicity. We consider that a value
()ki
U
is
underestimated (resp. overestimated) when it should
take the value just above
()ki
U
(resp. just
below
()ki
U
). This assumption means that the worst
appraisal error w.r.t. one criterion can only
correspond to the value just below or just above for
this criterion.
Let’s consider a vector
(1) ( )
[,.., ]
kkn
UU U
=
In the example in Figure 8, let us consider an
assumption of underestimation w.r.t. criterion 1. The
set
22
_
1( , )Under U U
is represented in the figure.
22
_
1( , ) 3Under U U
=
; only
12
(, )UU
and
11
(, )UU
lead to an overall underestimation (the operation is
evaluated
2
U
whereas it should be
1
U
). Then,
_1
2
under
n
=
and
_
(1) 2 / 3risk under =
. It means that
an underestimation w.r.t. criterion 1 for an operation
characterized by
22
(, )UU
leads to an
underestimation of the overall degree of emergency
of the operation in 66% of the cases.
The algorithm is the same for the risk of
overestimation. Nevertheless, in this case, when
()
0
ki
U
=
, the risk of overestimation w.r.t. criterion i
is null. Figure 9 and Figure 10 provide the results for
the risk analysis when underestimation (Figure 9)
and when overestimation (Figure 10) for all the
vectors in Figure 4.
5.2 Diagnosis Analysis
When the degree of emergency of an operation is
suspected to be overestimated (resp.
underestimated), the diagnosis analysis consists in
determining the most likely causes, i.e., the criteria
that the most frequently entail an overestimation
(resp. underestimation) of the operation when
they’re overestimated (resp. underestimated)
themselves. The possibility that criterion
i is a cause
of overestimation (resp. underestimation) assuming
an overestimation (resp. underestimation) of the
overall emergency degree of the operation― is
computed in the diagnosis step.
Let us consider the algorithm in case of
underestimation (resp. overestimation).
_
()Diag under i
gives the rate that an
underestimation w.r.t. criterion
i be a potential cause
of underestimation of the overall emergency degree
of an operation (idem for overestimation).
0
0
U
3
U
3
U
2
U
2
U
1
U
1
U
2
U
2
U
2
U
1
U
1
U
1
U
2
U
2
U
3
Criterion 1
Criterion 2
22
_1( , )Under U U
22
_1( , )Over U U
0
0
U
3
U
3
U
2
U
2
U
1
U
1
U
2
U
2
U
2
U
1
U
1
U
1
U
2
U
2
U
3
0
0
U
3
U
3
U
2
U
2
U
1
U
1
U
2
U
2
U
2
U
1
U
1
U
1
U
2
U
2
U
3
Criterion 1
Criterion 2
22
_1( , )Under U U
22
_1( , )Over U U
ICINCO 2007 - International Conference on Informatics in Control, Automation and Robotics
74

Let’s consider a vector
(1) ( )
[,.., ]
kkn
UU U=
Compute
()
WAM U
Compute
()
UΝ
and its cardinal
()UΝ
• Compute
(')
WAM U
for each
''
(1) ( )
' [ ,.., ]
kkn
UU U=
in
()UΝ
• Let us note
_
()
H
igher UΝ
(resp.
_
()Lower UΝ
), the set of vectors
'U
in
()UΝ
such that
(') ()
WAM U WAM U>
(resp.
(') ()WAM U WAM U<
)
• For each criterion i, count the number
'
_under i
n (resp.
'
_over i
n ) of times criterion i is
underestimated (resp. overestimated) in a vector
of
_
()
H
igher UΝ
(resp.
_
()Lower UΝ
), i.e.,
'
()ki
U
takes the value just above
()ki
U
(resp. just
below
()ki
U
) in
_
()
H
igher UΝ
(resp.
_
()Lower UΝ
)
Compute for each criterion i:
'
_
_()
_
()
under i
n
Diag under i
H
igher U
=
Ν
(resp.
'
_
_()
_
()
over i
n
Diag over i
Lower U
=
Ν
)
Figure 11 concerns underestimation diagnosis
and Figure 12 overestimation diagnosis for the base
of operations in Figure 4. A rate indicates the
possibility a criterion is underestimated itself (resp.
overestimated) when the overall emergency degree
of the concerned operation is underestimated (resp.
overestimated).
6 CONCLUSION
In civil engineering, the culture of numbers is
strongly developed. People commonly manipulate
symbolic labels but attribute them numerical values
when necessary without further care. A typical case
is when aggregation procedures are required. We
have proposed a methodology that enables 1) experts
to express their judgement values in their own
discrete semantic universe, 2) to convert the labels in
adequate numerical values using the MACBETH
method and clustering techniques, 3) to compute the
WAM based aggregated value and convert it in
return into the experts’ semantic universe 4) to carry
out a robustness analysis of the evaluation process to
assess the risk of misclassification of the operations
and to diagnose these misclassifications. This
method is implemented in an IPS—SINERGIE—
that supports decisions concerning maintenance
operations planning by the motorway operator
Escota.
REFERENCES
Saaty, T.L. 1980. The Analytic Hierarchy Process.
McGraw-Hill , New York.
Bana e Costa, C.A., Vansnick, J.C., 1994. MACBETH -
an interactive path towards the construction of cardinal
value functions. International transactions in
Operational Research, 1, 489-500.
Clivillé, V., 2004. Approche Systémique et méthode
multicritère pour la définition d’un système
d’indicateurs de performance. Thèse de l’Université de
Savoie, Annecy.
Jullien, S., Mauris, G., Valet, L., Bolon, Ph., 2006.
Decision aiding tools for Animated film selection from
a mean aggregation of criteria preferences over a finite
scale. 11th Int. Conference on Information processing
and Management of uncertainty in Knowledge-Based
Systems, Paris, France.
Grabisch, M., 2006. Representation of preferences over a
finite scale by a mean operator. To appear in
mathematical Social Sciences, downloadable at www-
sysdef.lip6.fr/~grabisch.
A MULTI CRITERIA EVALUATION OVER A FINITE SCALE FOR MAINTENANCE ACTIVITIES OF A
MOTORWAY OPERATOR
75

Figures 8 and 9: risk of overall underestimation (resp. overestimation) of the operations induced by partial underestimations
(resp. overestimation) w.r.t. criteria.
Figures 10 and 11: rates of causes of underestimation (resp. overestimation) diagnoses.
1721193012112915142728136987252423225218
env 11.0% 44.0% 0% 0% 15.0% 2.0% 0% 0% 0% 26.0% 13.0% 41.0% 0% 0% 0% 0% 18.0% 21.0% 0% 0% 0% 0% 21.0%
sanitary 11.0% 42.0% 0% 0% 14.0% 1.0% 0% 0% 0% 26.0% 13.0% 39.0% 0% 0% 0% 0% 18.0% 21.0% 0% 0% 0% 0% 21.0%
comfort 25.0% 58.0% 0% 0% 25.0% 4.0% 0% 0% 0% 40.0% 27.0% 55.0% 0% 0% 0% 0% 28.0% 32.0% 0% 0% 0% 0% 37.0%
regulation 11.0% 45.0% 0% 0% 16.0% 2.0% 0% 0% 0% 34.0% 20.0% 43.0% 0% 0% 0% 0% 20.0% 25.0% 0% 0% 0% 0% 23.0%
security 32.0% 67.0% 0% 0% 37.0% 4.0% 0% 0% 0% 62.0% 35.0% 76.0% 0% 0% 0% 0% 41.0% 46.0% 0% 0% 0% 0% 55.0%
durability 15.0% 73.0% 0% 0% 28.0% 4.0% 0% 0% 0% 32.0% 17.0% 62.0% 0% 0% 0% 0% 39.0% 44.0% 0% 0% 0% 0% 27.0%
social 11.0% 42.0% 0% 0% 14.0% 1.0% 0% 0% 0% 26.0% 13.0% 39.0% 0% 0% 0% 0% 18.0% 21.0% 0% 0% 0% 0% 21.0%
public image 18.0% 56.0% 0% 0% 26.0% 4.0% 0% 0% 0% 44.0% 27.0% 58.0% 0% 0% 0% 0% 29.0% 34.0% 0% 0% 0% 0% 39.0%
1721193012112915142728136987252423225218
env 2.0% 3.0% 0.0% 53.0% 7.0% 30.0% 12.0% 17.0% 17.0% 1.0% 6.0% 0.0% 41.0% 34.0% 34.0% 28.0% 13.0% 11.0% 6.0% 6.0% 0.0% 0.0% 1.0%
sanitary 2.0% 3.0% 0.0% 53.0% 6.0% 29.0% 12.0% 16.0% 16.0% 1.0% 6.0% 0.0% 34.0% 34.0% 34.0% 22.0% 13.0% 11.0% 6.0% 6.0% 0.0% 0.0% 1.0%
comfort 8.0% 7.0% 1.0% 69.0% 13.0% 46.0% 19.0% 24.0% 24.0% 3.0% 14.0% 2.0% 51.0% 51.0% 51.0% 39.0% 20.0% 18.0% 12.0% 12.0% 2.0% 1.0% 3.0%
regulation 3.0% 3.0% 1.0% 58.0% 9.0% 32.0% 19.0% 23.0% 23.0% 1.0% 6.0% 1.0% 40.0% 35.0% 35.0% 28.0% 14.0% 14.0% 7.0% 7.0% 1.0% 0.0% 1.0%
security 8.0% 9.0% 1.0% 72.0% 18.0% 63.0% 35.0% 47.0% 47.0% 3.0% 18.0% 2.0% 74.0% 80.0% 80.0% 56.0% 30.0% 27.0% 19.0% 19.0% 2.0% 1.0% 3.0%
durability 8.0% 9.0% 1.0% 96.0% 17.0% 49.0% 24.0% 30.0% 30.0% 3.0% 11.0% 2.0% 48.0% 48.0% 48.0% 36.0% 39.0% 34.0% 18.0% 18.0% 2.0% 1.0% 3.0%
social 2.0% 3.0% 0.0% 53.0% 6.0% 29.0% 12.0% 16.0% 16.0% 1.0% 6.0% 0.0% 34.0% 34.0% 34.0% 22.0% 13.0% 11.0% 6.0% 6.0% 0.0% 0.0% 1.0%
public image 3.0% 5.0% 1.0% 60.0% 15.0% 44.0% 24.0% 29.0% 29.0% 3.0% 14.0% 2.0% 53.0% 48.0% 48.0% 33.0% 20.0% 18.0% 12.0% 12.0% 2.0% 1.0% 3.0%
1721193012112915142728136987252423225218
durability 45% 57% 0% 0% 67% 100% 0% 0% 0% 40% 42% 52% 0% 0% 0% 0% 71% 67% 0% 0% 0% 0% 41%
security 97% 53% 0% 0% 86% 100% 0% 0% 0% 79% 87% 64% 0% 0% 0% 0% 75% 71% 0% 0% 0% 0% 84%
comfort 77% 45% 0% 0% 59% 90% 0% 0% 0% 51% 66% 46% 0% 0% 0% 0% 51% 49% 0% 0% 0% 0% 56%
public image 55% 44% 0% 0% 62% 90% 0% 0% 0% 56% 66% 48% 0% 0% 0% 0% 53% 52% 0% 0% 0% 0% 60%
env 35% 35% 0% 0% 36% 45% 0% 0% 0% 33% 33% 35% 0% 0% 0% 0% 33% 33% 0% 0% 0% 0% 33%
regulation 35% 35% 0% 0% 37% 45% 0% 0% 0% 43% 51% 36% 0% 0% 0% 0% 37% 39% 0% 0% 0% 0% 35%
social 33% 33% 0% 0% 33% 33% 0% 0% 0% 33% 33% 33% 0% 0% 0% 0% 33% 33% 0% 0% 0% 0% 33%
sanitary 33% 33% 0% 0% 33% 33% 0% 0% 0% 33% 33% 33% 0% 0% 0% 0% 33% 33% 0% 0% 0% 0% 33%
1721193012112915142728136987252423225218
durability 100% 100% 100% 60% 82% 57% 66% 61% 61% 100% 60% 100% 46% 46% 46% 53% 94% 96% 93% 93% 100% 100% 100%
security 100% 100% 100% 46% 90% 72% 96% 95% 95% 100% 100% 100% 71% 78% 78% 84% 73% 75% 100% 100% 100% 100% 100%
comfort 100% 78% 100% 44% 66% 53% 53% 48% 48% 100% 80% 100% 50% 50% 50% 57% 50% 51% 62% 62% 100% 100% 100%
public image 45% 60% 100% 38% 74% 50% 66% 58% 58% 100% 80% 100% 51% 46% 46% 50% 50% 51% 62% 62% 100% 100% 100%
env 35% 34% 33% 33% 35% 34% 33% 35% 35% 33% 33% 40% 40% 33% 33% 42% 33% 33% 33% 33% 33% 50% 33%
regulation 40% 39% 100% 35% 43% 36% 53% 46% 46% 33% 33% 60% 39% 34% 34% 42% 35% 41% 37% 37% 50% 50% 33%
social 33% 33% 33% 33% 33% 33% 33% 33% 33% 33% 33% 33% 33% 33% 33% 33% 33% 33% 33% 33% 33% 33% 33%
sanitary 33% 33% 33% 33% 33% 33% 33% 33% 33% 33% 33% 33% 33% 33% 33% 33% 33% 33% 33% 33% 33% 33% 33%
ICINCO 2007 - International Conference on Informatics in Control, Automation and Robotics
76
