
SETPOINT ASSIGNMENT RULES BASED ON TRANSFER TIME
DELAYS FOR WATER-ASSET MANAGEMENT OF NETWORKED
OPEN-CHANNEL SYSTEMS
Eric Duviella
Ecole des Mines de Douai, Dpt. Informatique et Automatique, 941 rue Charles Bourseul, 59508 Douai, France
Pascale Chiron and Philippe Charbonnaud
Laboratoire G
´
enie de Production, Ecole Nationale d’Ing
´
enieurs de Tarbes, 47 av. d’Azereix, 65016 Tarbes, France
Keywords:
Supervision, hybrid control accommodation, resource allocation, setpoint assignment, networked systems,
water management.
Abstract:
The paper presents a new strategy based on a supervision and hybrid control accommodation to improve the
water-asset management of networked open-channel systems. This strategy requires a modelling method of
the network based on a weighted digraph of instrumented points, and the definition of resource allocation
and setpoint assignment rules. Two setpoint assignment rules are designed and evaluated in the case of an
open-channel system composed of one difluent and one confluent showing their effectiveness.
1 INTRODUCTION
A hydrographic network is a geographically dis-
tributed system composed of dams and interconnected
rivers and channels. Weather conditions and hu-
man activities have a great influence on the flow dis-
charges. An interesting problem to address deals with
the allocation of water quantities in excess toward
the catchment area and of water quantities in lack
amongst the users. The complex hydrographic net-
work representation, as well as the determination of
the discharge allocation on the network, constitute an
essential step for the design of reactive control strate-
gies. In (Naidu et al., 1997) a hydrographic network
representation by oriented graphs is proposed by con-
sidering only the difluences. This representation is
modified and extended to the cases of the conflu-
ences in (Islam et al., 2005). Cembrano et al (Cem-
brano et al., 2000) proposed a modelling approach for
the drinking water distribution networks, and sewer-
age networks. Object-oriented modelling techniques
(Chan et al., 1999) and a XML approach (Lisounkin
et al., 2004) allow the representation of the control
and measurement instrumentation equipping the hy-
drographic networks and the drinking water distribu-
tion networks. Optimization techniques were pro-
posed in the literature for the water-asset manage-
ment. The approach proposed in (Faye et al., 1998) al-
lows the adjustment of the criteria and the constraints
of an optimization problem starting from the supervi-
sion of the network variables. However, the complex-
ity of the hydrographic networks and the number of
instrumented points to be taken into account in the op-
timization problem require the use of decomposition
and coordination techniques of the studied systems as
proposed in (Mansour et al., 1998). These techniques
are used for the optimal water management of irriga-
tion networks. Finally, in (Duviella et al., 2007), a
supervision and hybrid control accommodation strat-
egy is proposed for the water asset management of
the Neste canal in the southwestern region in France.
This strategy can be adapted for the case of gridded
hydrographic networks.
In this paper, the allocation and setpoint assign-
ment rules are proposed for the water asset manage-
ment of complex hydraulic systems i.e. with conflu-
ences and difluences. Networked hydraulic systems
modelling is presented in section 2. In section 3, iden-
tification steps of transfer time delay are presented.
The supervision and resource allocation rules are pro-
posed in section 4. Section 5 deals with the design
of a water asset management strategy where two set-
point assignment rules are compared. Finally, their
evaluation by simulation within the framework of a
hydrographic system is carried out.
312
Duviella E., Chiron P. and Charbonnaud P. (2007).
SETPOINT ASSIGNMENT RULES BASED ON TRANSFER TIME DELAYS FOR WATER-ASSET MANAGEMENT OF NETWORKED OPEN-CHANNEL
SYSTEMS.
In Proceedings of the Fourth International Conference on Informatics in Control, Automation and Robotics, pages 312-319
DOI: 10.5220/0001637803120319
Copyright
c
SciTePress
2 NETWORKED HYDRAULIC
SYSTEM MODELLING
Hydrographic networks are composed of a finite num-
ber of Simple Hydraulic Systems (HYS), i.e. com-
posed of one stream. A HYS source is defined as a
HYS which is not supplied by others HYS. A rep-
resentation is proposed to locate the instrumentation,
i.e. the sensors and the actuators, and to be able to
determine the way to distribute a water quantity mea-
sured in a place of the hydrographic network, onto the
whole HYS downstream. HYS are indexed by an in-
dex b, and all these indices forms the set B ⊂ N. Each
HYS is equipped with several sensors M
b
i
and actua-
tors G
b
j
, with i ∈ [1, m] and j ∈ [1,n], where m and
n are respectively the total number of measurement
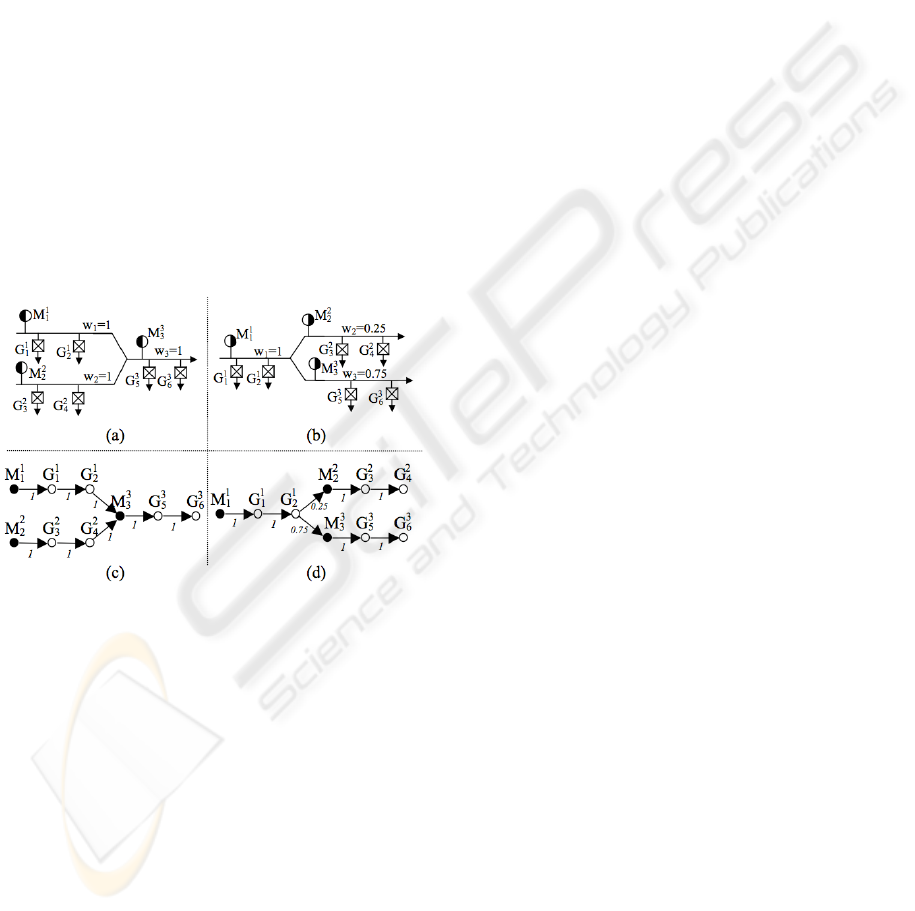
points and actuators, as shown in Figure 1.a. Up-
per indexes are omitted when not necessary for com-
putation and comprehension. The structure of a hy-
drographic network is described by distinguishing the
confluences (see Figure 1.a) and the difluences (see
Figure 1.c).
Figure 1: (a) A confluence, (c) its associated weighted di-
graph, (b) a difluence, (d) its associated weighted digraph.
According to the hydraulic conditions and the
equations of energy and mass conservation, the sum
of the discharges entering a node (confluent or diflu-
ent), is equal to the sum of the discharges outgoing
from this node. Thus, around an operating point, the
discharge q
b
of the HYS b resulting from the con-
fluence between several HYS is equal to the sum of
the upstream HYS discharges, q
b
=
∑
r∈C
b
q
r
, where C
b
⊂ B is the set of the HYS indices upstream to the
HYS b. In addition, the HYS r resulting from the
difluence of the HYS b upstream is supplied with a
proportion w
r
such that the discharge q
r
verifies the
relation: q
r
= w
r
q
b
. In order to represent difluence,
each HYS of an hydrographic system is associated to
a discharge proportion w
r
. For the HYS source and
Table 1: Assignment function of R matrix.
Input: weighted digraph.
Output: proportion matrix R.
Initialization of R to 0
For each node h
If h is a measurement point
Run (h, h, 1,R)
EndIf
EndFor
Run (h, c, p, R),
For each successor d of c
p
d
← p.w
d
,
Run (h, d, p
d
, R),
If d is a gate
R(h,d) ← R(h,d) + p
d
EndIf
EndFor
for the HYS downstream from a confluence (see Fig-
ure 1.a) it is equal to 1. The discharge proportion w
r
of the HYS downstream the HYS b are known and
such as ∀r ∈ D
b
, w
r
< 1, and
∑
r∈D
b
w
r
= 1, where D
b
⊂ B is the set of HYS indices resulting from the di-
fluence of the HYS b (see Figure 1.b). A discharge
which is measured in a place of the hydrographic net-
work, supplies the HYS downstream with discharge
proportions according to the structure of the hydro-
graphic network.
The hydrographic systems are represented by a
weighted digraph of instrumented points in order
to determine the discharge proportions between two
places of the networks. The digraph is composed
with a succession of two types of nodes M
i
or G
j
,
represented respectively by full circle and circle and
their respective graphs, and arcs indicate the links be-
tween the successive nodes (see Figure 1.c and Fig-
ure 1.d). The arcs are oriented in the direction of
the flow and are weighted by the discharge propor-
tion between the two nodes w
r
. Thereafter, an algo-
rithm lead to the generation of the proportion matrix
R which is composed of m lines (measurement points)
and of n columns (actuators). The weighted digraph
is browsed for each measurement point M
i
following
the algorithm given in Table 1. The matrix R contains
all the discharge proportions of a point to another of
the hydrographic networks.
Thereafter, the transfer time delay between the
measurement points and the gates, is computed ac-
cording to the method described in the next section.
SETPOINT ASSIGNMENT RULES BASED ON TRANSFER TIME DELAYS FOR WATER-ASSET MANAGEMENT
OF NETWORKED OPEN-CHANNEL SYSTEMS
313
3 IDENTIFICATION OF
TRANSFER TIME DELAYS
Hydrographic systems consist of several reaches, i.e.
a part between two measurement points, each reach
being composed of Open-Channel Reach Section
(OCRS), i.e. a part between two gates, between a
measurement point and a gate or between a gate and
a measurement point. The OCRS dynamics can be
modelled by transfer functions according to the mod-
elling method which consists in the simplification
of the Saint Venant equations and their linearization
around an operating point (Litrico and Georges, 1999;
Malaterre and Baume, 1998; Chow et al., 1988). The
parameters of the transfer function are considered
constant under an operating range around the operat-
ing point. In this paper, only disturbances around the
operating point are considered. Thus, the variation of
the transfer delays for these discharges is sufficiently
small in comparison with the chosen control period,
and will not have a significant influence on the strat-
egy effectiveness. If large operating conditions are
considered, and/or in the case of the ”small” control
period, it is necessary to consider several time delays
function of discharge value, as proposed in (Duviella
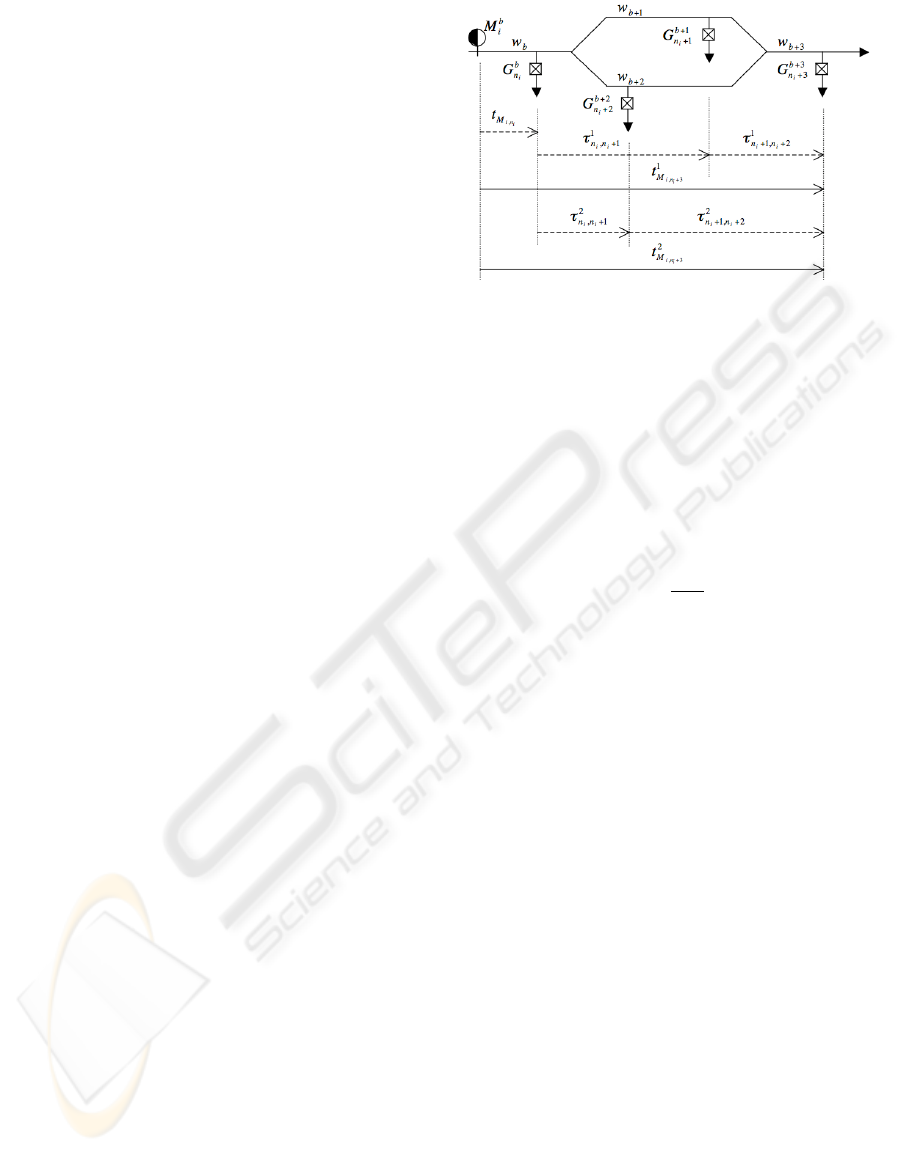
et al., 2006). For each OCRS (see Figure 2), the trans-
fer time delay τ
r
is obtained from the step response of
the corresponding transfer function. It is chosen as the
time value for which Π
Q
percent of step is reached.
The percentage Π
Q
can be tuned from simulation.
In the case of gridded systems, the value of the
transfer time delay between the measurement point
M
b
i
and the gate G
d
j
depends on the path to go from
the measurement point M
b
i
to the gate G
d
j
(see Figure
2). P
b,d
is the set of direct paths to go from the HYS
b to the HYS d, and P
b,d
v
is one of the direct paths to
go from the HYS b to the HYS d, such as P
b,d
v
∈ P
b,d
,
where 1 ≤ v ≤ ρ
b,d
, with ρ
b,d
the total number of paths
which compose P
b,d
. A direct path from M
i
to G
j
, is
a path where not other measurement point can be met
between M
i
and G
j
.
The transfer time delays between the measure-
ment point M
b
i
and the gate G
d
j
are computed by
considering each path and constitute the vector t
M
i
, j
(ρ
b,d
× 1):
t
M
i
, j
=
h
t
1
M
i
, j
, t
2
M
i
, j
, ... , t
ρ
b,d
M
i
, j
i
T
. (1)
Thereafter, the transfer time delay between M
b
i
and G
d
j
, is computed according to the selected path
P
b,d
v
:
t
v
M
i
, j
= t
M
i
,n
i
+
r< j
∑
r=n
i
τ
v
r,r+1
,
n
i
≤ j ≤ n,
(2)
Figure 2: Transfer delays between the measurement point
M
i
and gates G j.
where n
i
is the first gate downstream M
i
, v is the index
of the path P
b,d
v
, and τ
v
r,r+1
is the transfer time delay
between each gate along the path P
b,d
v
as illustrated in
Figure 2.
Then, the new setpoints must be assigned to the
gates at a time instant taking into account the trans-
fer time delays which are expressed according to the
sampling period T
s
:
kd
v
M
i
, j
=
t
v
M
i
, j
T
s
+ 1, (3)
where
b
x
c
denotes the integer part of x.
The measured water quantity in M
i
, following the
path with index v, will arrive on gate G
j
at the time:
T
v
M
i
, j
=
k + kd
v
M
i
, j
T
s
. (4)
Finally, the transfer time delays between the mea-
surement point M
b
i
and the gate G
d
j
are expressed by
the vector T
M
i
, j
(ρ
b,d
× 1):
T
M
i
, j
=
h
T
1
M
i
, j
, T
2
M
i
, j
, ... , T
ρ
b,d
M
i
, j
i
T
. (5)
The complex hydrographic network representation, as
well as the identification of the transfer time delays,
constitute an essential step for the design of reactive
control strategies.
4 SUPERVISION AND
RESOURCE ALLOCATION
Supervision and hybrid control accommodation
framework is depicted in Figure 3. The hydrographic
network is represented by a set of m measurement
points M
i
and n gates G
j
locally controlled. For each
gate G
j
, a weekly objective discharge q
j
ob j
and sea-
sonal weights λ
j
and µ
j
are given by the Management
Objective Generation module according to the water
ICINCO 2007 - International Conference on Informatics in Control, Automation and Robotics
314
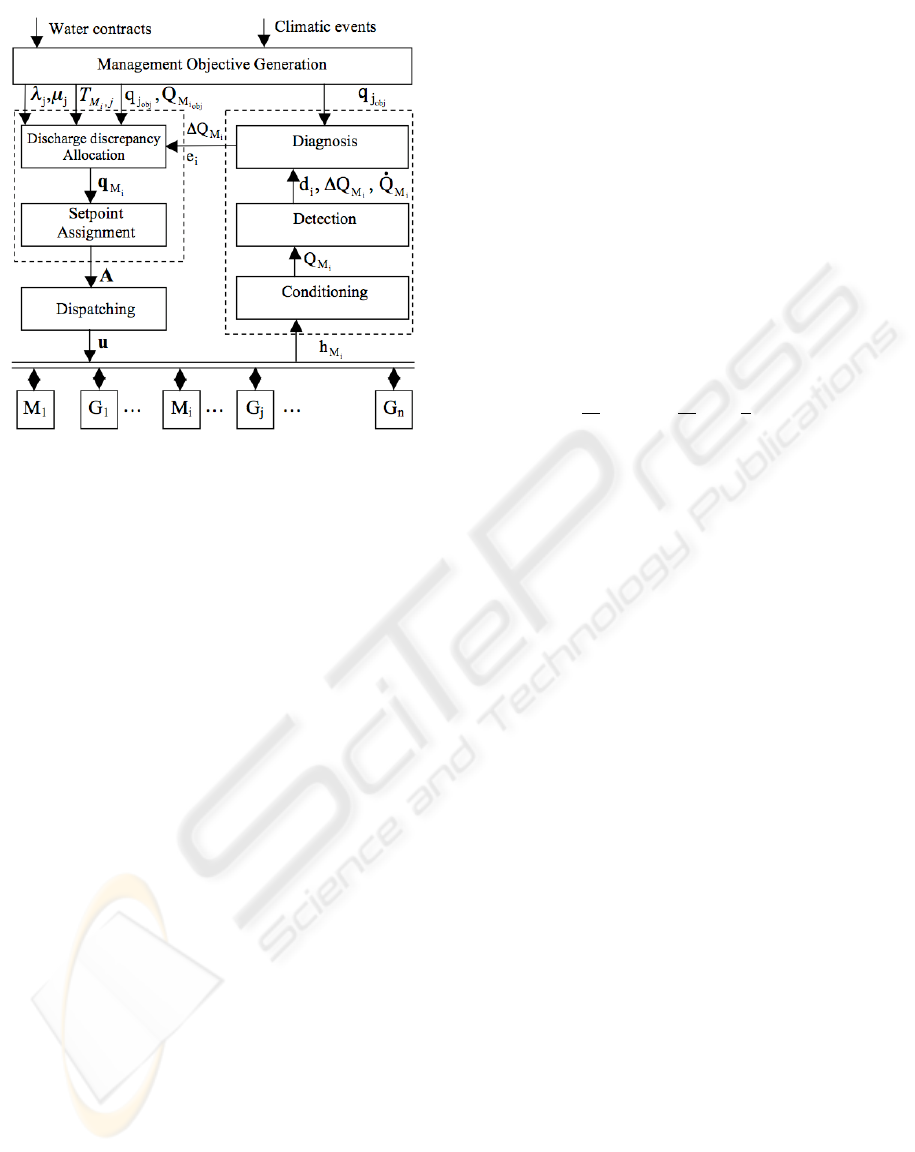
Figure 3: Supervision and hybrid control accommodation
framework.
contracts and climatic events. The weekly measure-
ment point objective discharge Q
M
i
ob j
is known.
For each measurement point M
i
; i = 1,...,m, dis-
charge supervision consists in monitoring discharge
disturbances and diagnosing the resource state, simul-
taneously. Limnimeter measurements are conditioned
by a low-pass filter on a sliding window which re-
moves wrong data due to transmission errors for in-
stance. Based on the discharge value Q
M
i
which is
determined at each sample time kT
s
, detection and
diagnosis automata are used respectively to detect a
discharge discrepancy superior or inferior than a de-
tection threshold d
th
around Q
M
i
ob j
, and to diagnose
the resource states (Duviella et al., 2007). According
to the resource state and the discharge discrepancy
∆Q
M
i
= Q
M
i
ob j
− Q
M
i
, the hybrid control accommo-
dation consists in determining the setpoints q
j
, and
in assigning them to the gates taking into account the
hydraulic system dynamics. The resource allocation
consists in recalculating setpoints with a goal to route
resource in excess to dams and to dispatch amongst
the users the resource in lack. At each sample time
kT
s
, the resource allocation leads to the determina-
tion of allocation vector q
M
i
which is composed of
the new computed setpoints. The allocation vector is
computed according to the resource state e
i
tacking
into account the seasonal weights λ
j
and µ
j
.
If the resource state is no diagnose situation, the
setpoints are the objective discharges q
j
ob j
. The allo-
cation vector is such as:
q
M
i
=
h
δ
1
d
R(i,1)
e
q
1
ob j
...δ
1
d
R(i, j)
e
q
j
ob j
...δ
1
d
R(i,n)
e
q
n
ob j
i
T
,
(6)
where
d
x
e
corresponds to the higher rounding of x,
n is the total number of gates, and δ
a
b
the Kronecker
index, is equal to 1 when a = b, and equal to 0 if not.
If the resource state is such as discharge is
in lack or in excess, the water resource is allocated
among the gate downstream the measurement point
M
i
, according to the weights λ
j
and µ
j
. The allo-
cation strategy consists in optimizing a cost function
by linear programming method for each measurement
point. The cost function f
M
i
is defined as the weighted
sum of the differences between the setpoint q
j
and the
objective q
j
ob j
for each gate G
j
, at time kT
s
:
f
M
i
=
n
∑
j=1
δ
1
d
R(i, j)
e
χ
M
i, j
(q
j
− q
j
ob j
)
, (7)
with χ
M
i, j
= γ
1
λ
j
+(γ−1)
1
µ
j
, γ =
1
2
(sign(∆Q
M
i
)+1).
The optimization is carried out under constraints:
n
∑
j=1
R(i, j)(q
j
− q
j
ob j
)
= ∆Q
M
i
,
q
j
min
≤ q
j
≤ q
j
max
,
(8)
where q
j
min
and q
j
max
are respectively the minimum
and maximum discharges given by gate, river or canal
characteristics. In this case, the allocation vector q
M
i
is such as:
q
M
i
=
h
δ
1
d
R(i,1)
e
.q
1
... δ
1
d
R(i, j)
e
.q
j
... δ
1
d
R(i,n)
e
.q
n
i
T
.
(9)
Then, to synchronize the gate control with the wa-
ter lacks or excess due to the disturbances, the set-
points must be assigned at a time instant tacking into
account the transfer time delays T
M
i
, j
between the
measurement point M
i
and the gate G
j
.
5 SETPOINT ASSIGNMENT
RULES
The setpoint assignment consists in taking into ac-
count the transfer delays before the dispatching of
the new computed setpoints at the gates. In the case
of gridded systems, two different setpoint assignment
rules are proposed.
The first rule consists in considering only one
transfer delay T
M
i
, j
from each measurement point M
i
to each gate G
j
, whatever existing several paths to go
from M
i
at the gate G
j
. The transfer delay between
M
b
i
and G
d
j
is selected as the direct path between M
b
i
and G
d
j
, which have the greatest supplying discharge
proportion. The following assumptions are consid-
ered:
SETPOINT ASSIGNMENT RULES BASED ON TRANSFER TIME DELAYS FOR WATER-ASSET MANAGEMENT
OF NETWORKED OPEN-CHANNEL SYSTEMS
315

Table 2: Assignment function of α and β matrices.
Input: weighted digraph.
Output: α
M
i
matrix, β
M
i
matrices
Initialization of the diagonal of α
M
i
to 0
Initialization of β
M
i
to 0
g ← first gate successor of M
i
Run (M
i
, g, 1, α
M
i
, β
M
i
)
Run (M
i
, c, p, α
M
i
, β
M
i
)
For any successor d of c
p
d
← p.w
d
If d is a gate
Run (M
i
, d, p
d
, α
M
i
, β
M
i
)
α
M
i
(d, d) ← α
M
i
(d, d) + p
d
l = 1
While (β
M
i
(l, d) 6= 0)
l + +
EndWhile
β
M
i
(l, d) ← p
d
EndIf
EndFor
- if the discharge proportion β
M
i
(v, j) resulting from
M
b
i
and supplying G
d
j
by a single path P
b,d
v
, is weak,
the discrepancy allocation will be weak also,
- if the discharge proportion β
M
i
(v, j) resulting from
M
b
i
and supplying G
d
j
by a single path P
b,d
v
, is impor-
tant, the discrepancy allocation will be important also.
The supplying discharge proportion β
M
i
(ρ
M
i
×n),
where ρ
M
i
is the maximum number of paths between
M
i
and the gates G
j
, is computed for each measure-
ment point M
i
according to the algorithm given in Ta-
ble 2 and the weighted digraph of the system.
Thus, the set of allocation dates starting from M
i
is
denoted T
M
i
(1 × n) updated at each sampling period
T
s
and expressed by:
T
M
i
= [T
M
i
,1
... T
M
i
, j
... T
M
i
,n
], (10)
where
T
M
i
, j
= 0, if β
M
i
(1, j) = 0
T
M
i
, j
= T
v
M
i
, j
, otherwise,
(11)
and v such as β
M
i
(v, j) = max
l∈
[
1,ρ
M
i
]
β
M
i
(l, j). When
β
M
i
(1, j) = 0 there is no direct path between M
i
and
G
j
.
At each sample time kT
s
, the setpoint assignment
matrix A
k
M
i
(H
M
i
× n), where H
M
i
is the allocation
horizon from M
i
, is scheduled according to T
M
i
and
q
M
i
. The first row of A
k
M
i
contains the setpoints to be
assigned to each gate from M
i
at the date (k +1)T
s
, the
h
th
row the ones to be assigned at the date (k + h)T
s
as defined in equation 12, the last row the ones to be
assigned at the date (k + H
M
i
)T
s
.
If T
M
i
( j) ≥ (k + h)T
s
A
k
M
i
(h, j) = q
M
i
( j),
Else
If 1 ≤ h < H
M
i
A
k
M
i
(h, j) = A
k−1
M
i
(h + 1, j)
Else
A
k
M
i
(h, j) = q
j
ob j
Endif
Endif
(12)
and A
0
M
i
(h, j) = q
j
ob j
.
The setpoints are dispatched with the control pe-
riod T
c
= κT
s
, where κ is an integer. The control set-
point vector denoted u (1 × n) is updated at each date
k
0
T
c
, where k
0
=
k
κ
, thanks to the assignment matrix
A
k
0
M
i
and the α
M
i
(n×n) diagonal control accommoda-
tion matrix, with H =
1
κ
max
1≤i≤m
(H
M
i
) the control hori-
zon. For each measurement point M
i
, the α
M
i
matrix,
the role of which is to capture the measurement point
influence on the gates, must be determined. In order
to generate the α
M
i
matrix, the weighted digraph (see
Figure 1.c and 1.d) is browsed using the algorithm
given in Table 2, for each measurement point M
i
. The
control setpoint vector u
k
0
(1 × n) is calculated by:
u
k
0
( j) =
m
∑
i=1
α
M
i
( j, j)A
k
0
M
i
(1, j). (13)
The second rule consists in considering the sev-
eral direct transfer delays T
M
i
, j
from each measure-
ment point M
i
to each gate G
j
. The set of alloca-
tion dates starting from M
i
is denoted T
M
i
(ρ
M
× n),
where ρ
M
is the maximum number of paths between
the measurement points M
i
and the gates G
j
. The ma-
trix T
M
i
is updated at each sampling period T
s
and ex-
pressed by:
T
M
i
= [T
M
i
,1
... T
M
i
, j
... T
M
i
,n
], (14)
where T
M
i
, j
is the set of the transfer time delays be-
tween the measurement point M
i
and the gate G
j
. The
value of T
M
i
, j
(l) is fixed to 0 for ρ
M
i
< l ≤ ρ
M
, i.e.
when the length ρ
M
i
of the T
M
i
, j
is smaller than ρ
M
.
In this case, the setpoint assignment matrix A
k
M
i
(H
M
i
× n) is scheduled, at each sample time kT
s
, ac-
ICINCO 2007 - International Conference on Informatics in Control, Automation and Robotics
316
cording to T
M
i
and q
M
i
:
If ∃v such as T
M
i
(v, j) ≥ (k + h)T
s
A
k
M
i
(h, j) =
ρ
M
∑
v=1
ϕ
v
.β
M
i
(v, j).q
M
i
( j)
Else
If 1 ≤ h < H
M
i
A
k
M
i
(h, j) = A
k−1
M
i
(h + 1, j)
Else
A
k
M
i
(h, j) = α
M
i
( j, j).q
j
ob j
Endif
Endif
(15)
where ϕ
v
= 1 if T
M
i
(v, j) ≥ (k + h)T
s
, ϕ
v
= 0 other-
wise, and A
0
M
i
(h, j) = α
M
i
( j, j).q
j
ob j
.
The control setpoint vector denoted u (1×n) is up-
dated at each date k
0
T
c
, thanks to the assignment ma-
trix A
k
0
M
i
, with H =
1
κ
max
1≤i≤m
(H
M
i
) the control horizon.
The control setpoint vector u
k
0
(1 × n) is calculated
by:
u
k
0
( j) =
m
∑
i=1
A
k
0
M
i
(1, j). (16)
The setpoint dispatching leads to the application of
the most recently calculated setpoints. This method
increases the control strategy reactivity, because dis-
charge variations between two control dates are taken
into account.
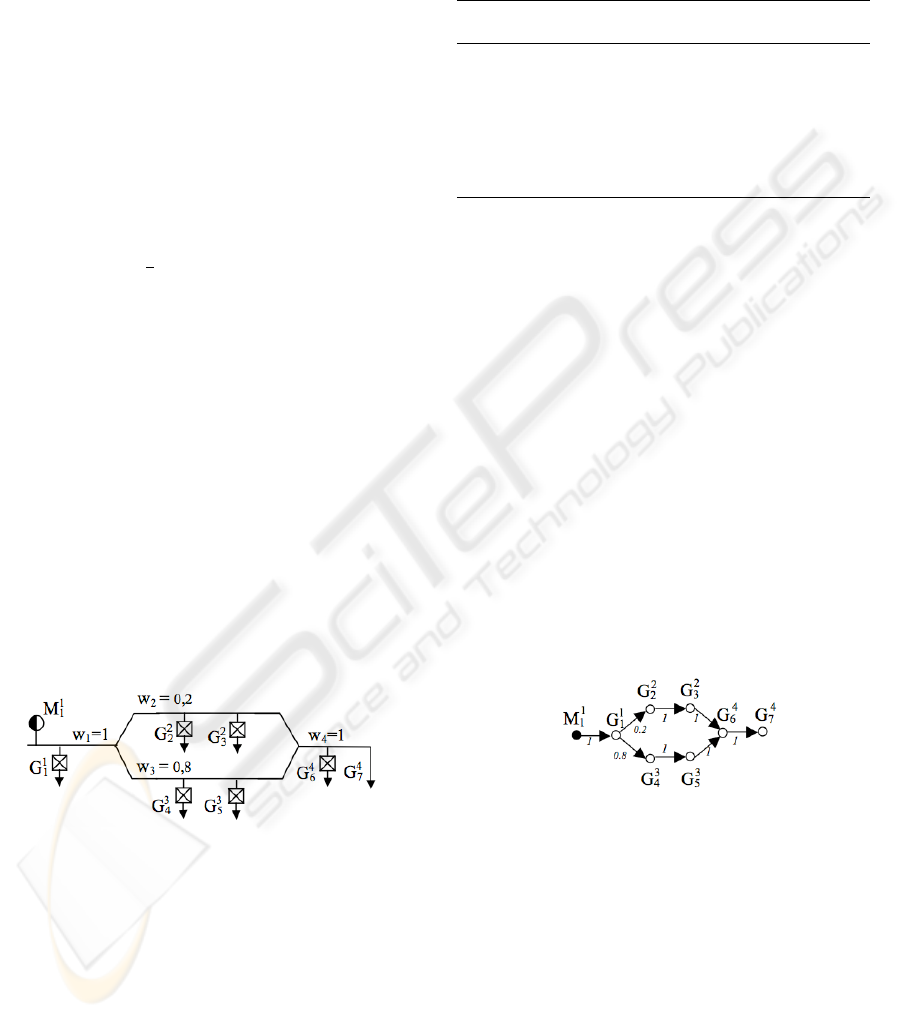
6 SIMULATION RESULTS
The proposed setpoints assignment rules have been
evaluated for a hydrographic system composed of one
difluence and one confluence (see Figure 4).
Figure 4: Hydrographic system composed of one difluence
and one confluence.
The hydrographic system is composed of 4 HYS,
equipped with 6 gates, G
1
1
to G
4
6
, and 1 measurement
point M
1
1
. The discharge downstream the gate G
1
1
fed
the HYS which is equipped with the gates G
2
2
to G
2
3
with the discharge proportion w
2
and the HYS which
is equipped with the gates G
3
4
to G
3
5
with the discharge
proportion w
3
. The discharge proportion w
2
is equal
to 0.2 and w
3
to 0.8. The gates G
4
7
which corresponds
to the canal outputs, is not controlled. The gate char-
acteristics, i.e. objective discharge q
j
ob j
, maximum
and minimum discharges q
j max
, q
j min
, and their asso-
ciated weights, are given in Table 3.
Table 3: Gate parameters.
Gate q
j
ob j
[m
3
/s]
q
j min
[m
3
/s]
q
j max
[m
3
/s]
λ
j
µ
j
G
1
1
1.1 0.05 0.85 10 10
G
2
2
0.3 0.1 0.9 1 4
G
2
3
0.4 0.15 1.2 1 4
G
3
4
1.9 0.1 1.4 4 1
G
3
5
1.6 0.1 0.9 1 4
G
4
6
0.9 0.05 1.8 10 10
G
4
7
1.8 0.05 0.75 − −
The use of the proposed rules requires the identi-
fication of the transfer time delays. The set of HYS
which are characterized by trapezoidal profile have
been modelled according to the transfer time delay
identification steps. The matrix, T
M
i
, of transfer time
delays between M
1
and each gate, expressed in sec-
onds, are given by:
T
M
i
=
850 1750 2700 1450 2050 3750
0 0 0 0 0 2700
.
(17)
There are two identified transfer time delays be-
tween M
1
and G
6
; T
1
M
1
,6
= 3750 s corresponds to the
path P
1,4
1
; T
2
M
1
,6
= 2700 s corresponds to the path P
1,4
2
.
Then, the hydrographic system (see Figure 4) is
represented by the weighted digraph depicted in Fig-
ure 5 to determine the matrix R, and then, to deter-
mine the matrices α
Mi
and β
M
i
.
Figure 5: Graph for the determination of R and α
Mi
.
The matrix R is given by:
R =
1 0.2 0.2 0.8 0.8 1
. (18)
The diagonal matrix α
M
1
is given by:
α
M
1
= diag
{
1,0.2,0.2,0.8,0.8,1
}
.
(19)
The matrix β
M
1
is given by:
β
M
1
=
1 0.2 0.2 0.8 0.8 0.2
0 0 0 0 0 0.8
. (20)
The objective discharges of M
1
correspond to 8
m
3
/s. The hydrographic system is subjected to dis-
turbances upstream the measurement points M
1
(see
SETPOINT ASSIGNMENT RULES BASED ON TRANSFER TIME DELAYS FOR WATER-ASSET MANAGEMENT
OF NETWORKED OPEN-CHANNEL SYSTEMS
317
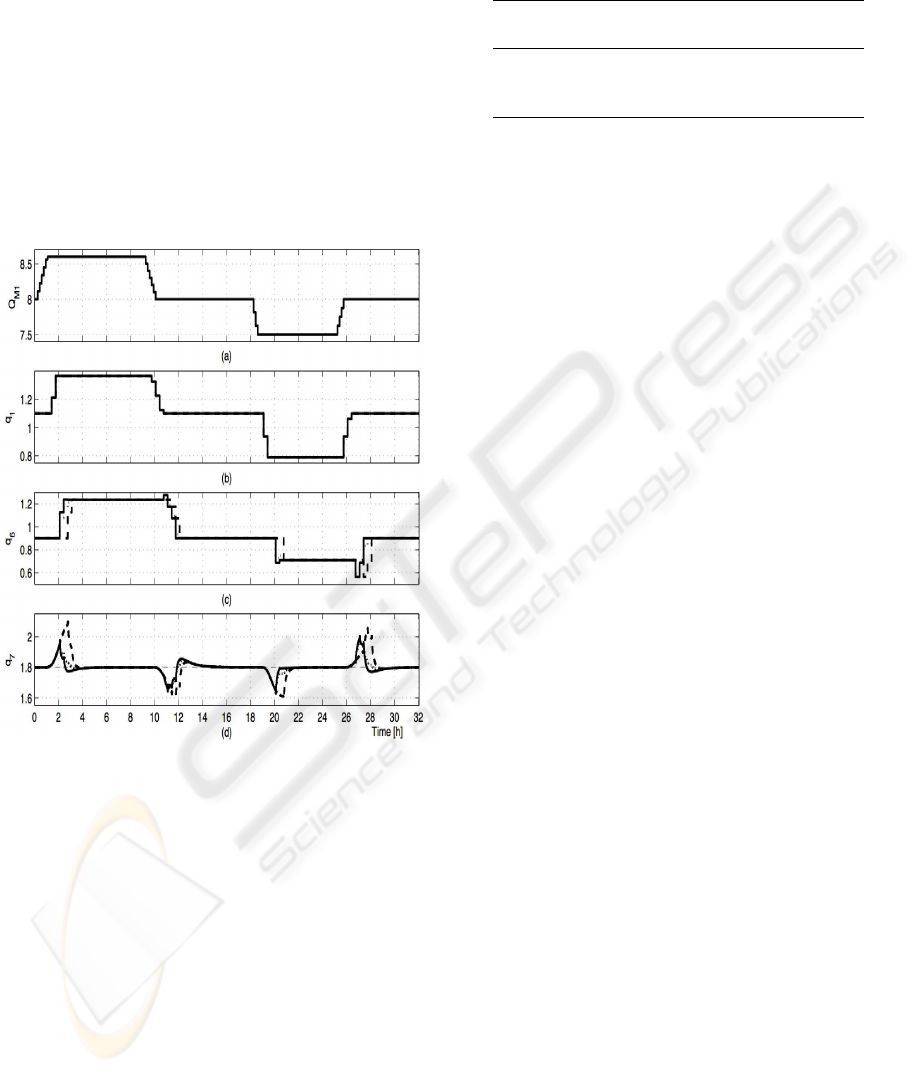
Figure 6.a). The detection threshold is selected as
d
th
= 0.15 m
3
/s. Figure 6 shows discharges measured
on M
1
, and the new setpoints which have been dis-
patched at the gates which were controlled, i.e. G
1
in
(b) and G
6
in (c), and the discharges resulting at the
canal ends q
7
in (d) in case 1: the case where only
one transfer time delay is considered (the first rule is
used without any assumption about the discharge pro-
portion values), the transfer time delay considered is
T
1
M
1
,6
(dashed line), in case 2: the case where the first
rule is applied, thus the time delay considered is T
2
M
1
,6
(dotted line), and in case 3: the case where the second
rule is applied (continuous line).
Figure 6: Discharges in [m
3
/s] (a) Q
M
1
, (b) q
1
, (c) q
6
, and
(d) the resulting discharges q
7
.
Whatever the setpoint assignment rules used are,
there is a peak of approximately 0.15 m
3
/s on G
7
at
the 2
nd
, 11
th
, 20
th
and 27
th
hours (see Figure 6.d),
due to the detection threshold d
th
and the occurrence
of the discharge discrepancies on Q
M
1
. When the
transfer time delay is T
1
M
1
,6
, the setpoints are assigned
too late, and the discharges at the end of the hydro-
graphic system are not close to the objective value
q
7ob j
. These results show the importance of the trans-
fer time delay. The results are improved when the first
rule is used with T
2
M
1
,6
, because of better evaluation of
transfer time delay. Finally, the performances are also
improved when the second rule is applied, the effec-
tive transfer time delays are taken into account be-
cause all direct paths are considered. The maximum
and minimum discharges reached at G
7
and the wa-
Table 4: Criteria computed when the different rules are
used.
Case max(q
7
)
[m
3
/s]
min(q
7
)
[m
3
/s]
V
[m
3
]
case 1 2.09 1.59 1815
case 2 1.99 1.63 1099
case 3 1.97 1.63 1057
ter volume V which was not allocated are displayed
in Table 4. The maximum discharge discrepancy at
G
7
corresponds to 9.5 % of the objective discharge
q
7ob j
when the second rule is used and to 10.5 % in
the other case. The second rule leads to spare an ad-
ditional water quantity of 42 m
3
during 32 hours, in
comparison to the use of the first rule. The differ-
ences between the two strategies are weak. In addi-
tion, these differences decrease for hydrographic sys-
tems which are equipped by a great number of mea-
surement points, because, in this case, the number of
direct paths is weak.
7 CONCLUSION
The resource allocation and setpoint assignment rules
constitute a generic approach allowing the water re-
source valorization whatever the configuration of the
hydrographic networks is. Multiple graph represen-
tations make it possible to identify the information
for implementing the proposed supervision and hy-
brid control accommodation strategy. Two rules of
setpoint assignment have been proposed, tested and
compared within the framework of a networked open-
channel system composed of one difluent and one
confluent. Although the second rule leads to the best
performances, its implementation is more complex
than the one for the first rule. The choice between the
two strategies could be carried out only by consider-
ing the hydrographic system with this equipment.
REFERENCES
Cembrano, G., Wells, G., Quevedo, J., Perez, R., and Arge-
laguet, R. (2000). Optimal control of a water distribu-
tion network in a supervisory control system. Control
Engineering Practice, 8:1177–1188.
Chan, C., Kritpiphat, W., and Tontiwachwuthikul, P. (1999).
Development of an intelligent control system for a
municipal water distribution network. IEEE Canadian
conference on Electrical and Computer Engineering,
2:1108–1113.
ICINCO 2007 - International Conference on Informatics in Control, Automation and Robotics
318

Chow, V. T., Maidment, D. R., and Mays, L. W. (1988).
Applied Hydrology. McGraw-Hill, New York, Paris.
Duviella, E., Chiron, P., and Charbonnaud, P. (2006). Hy-
brid control accommodation for water-asset manage-
ment of hydraulic systems subjected to large operating
conditions. ALSIS06, 1st IFAC Workshop on Applica-
tions of Large Scale Industrial Systems, Helsinki, Fin-
land, August 30-31 2006.
Duviella, E., Chiron, P., Charbonnaud, P., and Hurand, P.
(2007). Supervision and hybrid control accommoda-
tion for water asset management. Control Engineering
Practice (CEP), 15:17–27.
Faye, R. M., Sawadogo, S., Niang, A., and Mora-Camino,
F. (1998). An intelligent decision support system
for irrigation system management. IEEE Interna-
tional Conference on Systems, Man and Cybernetics,
SMC’98, October 11-14, San Diego, USA, 4:3908–
3913.
Islam, A., Raghuwanshi, N. S., Singh, R., and Sen, D. J.
(2005). Comparison of gradually varied flow compu-
tation algorithms for open-channel network. Journal
of irrigation and drainage engineering, 131(5):457–
465.
Lisounkin, A., Sabov, A., and Schreck, G. (2004). Inter-
preter based model check for distribution networks.
IEEE international conference on industrial informat-
ics, INDIN’O4, 24-26 juin, pages 431–435.
Litrico, X. and Georges, D. (1999). Robust continuous-time
and discrete-time flow control of a dam-river system.
(i) modelling. Applied Mathematical Modelling 23,
pages 809–827.
Malaterre, P.-O. and Baume, J.-P. (1998). Modeling and
regulation of irrigation canals: Existing applications
and ongoing researches. IEEE International Con-
ference on Systems, Man, and Cybernetics, 4:3850–
3855.
Mansour, H. E. F., Georges, D., and Bornard, G. (1998).
Optimal control of complex irrigation systems via
decomposition-coordination and the use of augmented
lagrangian. IEEE, International Conference on Con-
trol Applications, Trieste, Italy, pages 3874–3879.
Naidu, B. J., Bhallamudi, S. M., and Narasimhan, S.
(1997). GVF computation in tree-type channel net-
works. Journal of hydraulic engineering, 123(8):700–
708.
SETPOINT ASSIGNMENT RULES BASED ON TRANSFER TIME DELAYS FOR WATER-ASSET MANAGEMENT
OF NETWORKED OPEN-CHANNEL SYSTEMS
319
