
COMPARYING A TABU SEARCH PROCESS
Using and Not Using and Intensification Strategy to Solve
the Vehicle Routing Problem
Etiene Pozzobom Lazzeris Simas
Universidade do Vale do Rio dos Sinos. Av. Unisinos, 950, São Leopoldo, Brasil
Arthur Tórgo Gómez
Universidade do Vale do Rio dos Sinos. Av. Unisinos, 950, São Leopoldo, Brasil
Keywords: Vehicle Routing Problem; Tabu
Search, Intensification Strategy.
Abstract: In this paper we propose a Tabu Search algorithm to solve the Vehicle Routing Problem. The Vehicle
Routing Problem are usually defined as the problem that concerns in creation of least cost routs to serve a
set of clients by a fleet of vehicles. We develop an intensifications strategy to diversify the neighbours
generated and to increase the neighbourhood size. We had done experiments using and not using the
intensification strategy to compare the performance of the search. The experiments we had done showed
that an intensification strategy allows an increase on the solutions quality.
1 INTRODUCTION
The Vehicle Routing Problem (VRP) is a NP-Hard
problem (Lenstra and Rinooy Kan, 1981) that is
usually dealt within the logistic context (Ho and
Haugland, 2004; Xu and Kelly, 1996). It can be
described as a set of customers that have to be
served by a fleet of vehicles, satisfying some
constraints (Laporte, 1992; Xu and Kelly, 1996).
The Transport is one of the most costly activities in
logistic, typically varying in one or two thirds of the
total costs (Ballou, 2001). Therefore, the necessity
of improving the efficiency of this activity has great
importance. A small percentage saved with this
activity could result in a substantial saving total
(Bodin, Golden and Assad, 1983). There many
variants and constraints that can be considered, i.e. it
can be considered that the fleet may be
heterogeneous the vehicles must execute collections
and deliveries, there may exist more than one depot,
etc. In this paper we are dealing with the classic
version of this problem, were just the vehicle
capacity constraint are considered.
2 THE VEHICLE ROUTING
PROBLEM
A classical definition is presented in Barbarasolgu
and Ozgur (Barbarasolgu and Ozgur, 1999). The
VRP is defined in a complete, undirected graph
G=(V.A) where a fleet of Nv vehicle of
homogeneous capacity is located. All remaining
vertices are customers to be served. A non-negative
matrix C=(c
ij
) is defined on A representing the
distance between the vertices. The costs are the same
in both directions. A non-negative demand di, is
associated with each vertex representing the
customer demand at vi. The routes must start and
finish at the depot. The clients must be visited just
once, by only one vehicle and the total demand of
the route can’t exceed the capacity Qv of the
vehicle. In some cases, there is a limitation on the
total route duration. In this case, t
ij
is defined to
represent travel time for each (vi,vj), ti represents
the service time at any vertex vi and is required that
the total time duration of any route should not
exceed Tv. A typical formulation based on
Barbarasoglu and Ozgur ones (Barbarasolgu and
O
zgur, 1999) are used in this paper:
77
Pozzobom Lazzeris Simas E. and Tórgo Gómez A. (2007).
COMPARYING A TABU SEARCH PROCESS - Using and Not Using and Intensification Strategy to Solve the Vehicle Routing Problem.
In Proceedings of the Fourth International Conference on Informatics in Control, Automation and Robotics, pages 77-84
DOI: 10.5220/0001638700770084
Copyright
c
SciTePress

Minimize
X
v
ij
v
ij
ji
c
∑∑∑
(1)
Subject:
1=
∑∑
X
v
ij
vi
for all j
(2)
1=
∑∑
X
v
ij
vj
for all i
(3)
0=−
∑∑
XX
v
pj
j
v
ip
i
for all p,v
(4)
Q
X
v
v
ij
ji
i
d <=
⎟
⎟
⎠
⎞
⎜
⎜
⎝
⎛
∑∑
for all v
(5)
1
0
1
<=
∑
=
X
v
j
n
j
for all v
(6)
1
0
1
<=
∑
=
X
v
i
n
i
for all v
(7)
Z
X
v
ij
∈
for all i,j and v
(8)
Where are binary variables indicating if
arc(vi,vj) is traversed by vehicle v. The objective
function of distance/cost/time is expressed by eq.
(1). Constraints in eqs (2) and (3) together state that
each demand vertex is served by exactly one vehicle.
The eq. (4) guarantees that a vehicle leaves the
demand vertex as soon as it has served the vertex.
Vehicle capacity is expressed by (5) where Q
X
ij
v
f b
v
is the
capacity. Constraints (6) and (7) express that vehicle
availability can’t be exceeded. The sub tour
elimination constraints are given in eq.(8) where Z
can be de ined y:
(
)
{
1: −<==
∑∑
∈∈
BZ
XX
v
ij
BjBi
v
ij
for
}
2};0/{ >=⊆ BVB
(8)
3 RESOLUTIONS METHODS
Since VRP is Np-Hard to obtain good solutions in an
acceptable time, heuristics are used and this is the
reason why the majority of researchers and scientists
direct their efforts in heuristics development
(Thangiah and Petrovik, 1997; Nelson et al, 1985;
Xu and Kelly, 1996). Osman and Laporte (Osman
and Laporte, 1996) define heuristic as a technique,
which seeks good solutions at a reasonable
computational cost without being able to guarantee
the optimality. Laporte et al (Laporte et al, 2000)
define two main groups of heuristics: classical
heuristics, developed mostly between 1960 and
1990, and metaheuristics. The classical heuristics
are divided in three groups: constructor methods,
two-phase methods and improvement methods.
Since 1990, the metaheuristics have been applied to
the VRP problem. To Osman and Laporte (Osman
and Laporte, 1996) a metaheuristic is formally
defined as an iterative generation process which
guides a subordinate heuristic by combining
intelligently different concepts for exploring and
exploiting the search space in order to find
efficiently near-optimal solutions. Several
metaheuristics have been proposed to solve the VRP
problem. Among these ones, Tabu Search are
considered the best metaheuristic for VRP. To
review some works with Tabu Search and others
metaheuristics some readings are suggested
(Cordeau et al, 2002; Tarantilis et al, 2005).
3.1 Tabu Search
It was proposed by Glover (Glover, 1989) and had
its concepts detailed in Glover and Laguna (Glover
and Laguna, 1997). It’s a technique to solve
optimization combinatorial problems (Glover, 1989)
that consists in an iterative routine to construct
neighborhoods emphasizing the prohibition of
stopping in an optimum local. The process that Tabu
Search searches for the best solution is through an
aggressive exploration (Glover and Laguna, 1997),
choosing the best movement for each iteration, not
depending on if this movement improves or not the
value of the actual solution. In Tabu Search
development, intensification and diversification
strategies are alternated through the tabu attributes
analysis. Diversification strategies direct the search
to new regions, aiming to reach whole search space
while the intensification strategies reinforce the
search in the neighborhood of a solution historically
good (Glover and Laguna, 1997). The stop criterion
makes it possible to stop the search. It can be
defined as the interaction where the best results were
found or as the maximum number of iteration
without an improvement in the value of the objective
function. The tabu list is a structure that keeps some
solution’s attributes that are considered tabu. The
objective of this list is to forbid the use of some
solutions during some defined time.
4 VRP APPLICATION
The application developed are divided into three
modules:
ICINCO 2007 - International Conference on Informatics in Control, Automation and Robotics
78
a) Net Generation module: This module generates
the nets that will be used in the application using
vertices coordinates and demands given.
b) Initial Solution module: This module generates
the initial solutions of the nets. The initial solutions
are created thought the use of an algorithm
implementing the Nearest Insertion heuristic (Tyagi,
1968; Cook et al, 1998).
c) Tabu Search module: This module performs the
tabu search algorithm. The Tabu Search elements
that were used are now detailed. The stop criterion
adopted is the maximum number of iterations
without any improvement in the value of the
objective value. The tabu list keeps all the routes and
the cost of the solution, forbidden these routes to be
used together during the tabu tenure defined. And
elite solution list is used to keep the best results that
were found during the search. It was proposed an
intensification strategy to be used every time when
the search executes 15 iterations without an
improvement in the objective function value. In this
strategy we visit every solution that is in elite list
generating a big neighbourhood for each one. There
were defined two movements to neighbourhood
generation. V1, that makes the exchange of vertices
and V2, that makes the relocation of vertices. In V1,
one route r1 is selected and than one vertex of this
route is chosen. We try to exchange this vertex with
every vertex of all the other routes. The exchange is
done if the addition of the two new demands doesn’t
exceed the vehicle’s capacity of both routes. This
procedure is done for every vertex of the route r1.
To every exchange that is made, one neighbour is
generated. In V2, we select one route and choose
one vertex and then we try to reallocate it into all
others routes, if it doesn’t exceed the vehicle
capacity of the route. When a vertex can be insert
into a route, we try to insert it into all possible
positions inside this route. To every position that a
vertex is inserted, one neighbour is generated.
When these movements are used in the search with
intensification, they are called V1’ and V2’ because
with intensification, not only one route is selected
like in V1 and V2, but also all routes of the solution
are chosen. Aiming increase the neighbourhood size
and the diversification between the solutions, we
proposed to use the movements alone and together.
5 COMPUTACIONAL
EXPERIENCE
The computational experiments were conducted on
problems 1, 2, 3, 4 and 5 of Christofides Mingozzi
and Toth (Christofides Mingozzi and Toth, 1979).
These problems contain 50, 75, 100, 150 and 199
vertices and one depot respectively and they are
frequently used in papers for tests purposes. The
objective of the experiments was to compare the
search process using and not using intensification
strategy using the different movements proposed.
There were proposed 9 values to Nbmax {100, 250,
500, 750, 1000, 1250, 1500, 1750, and 2000} and 6
values to Tabu List size {10, 25, 50, 75, 100, 200}.
For every problem, the experiments were divided
into 6 groups according with the used movements.
Table 1 shows these groups.
Table 1: Groups of experiments divided by movements.
Search mode Used movement
Using Intensification V1
Using Intensification V2
Using Intensification V1,V2
Not Using Intensification V1 + V1’
Not Using Intensification V2 + V2’
Not Using Intensification V1V2 + V1’ V2’
There were generated 54 experiments for each group
combining all values proposed to Nbmax with all
Tabu List size. So, for each problem there were
generated 162 experiments using intensification and
162 experiments not using it. Two types of analyses
were done. In one type it was evaluated the best
result obtained for a fixed value of Nbmax used
with all Tabu List size and in other type it was
evaluated the best results obtained for a fixed size of
Tabu List used with all values proposed to Nbmax.
Analyses had also been made comparing the best
result found for each group of experiment, in this
case comparing the quality of the different
movements.
5.1 Analysing the Nbmax Variation for
Each Tabu List Size
By analysing the results in this perspective it will be
evaluate the variation of the Nbmax for each Tabu
List size. The objective is verified if big values of
Nbmax can improved the quality of Tabu Search
process. We create a “lower average” for the average
from results obtained with Nbmax = 100 and Nbmax
= 250 and an “upper average” for the average from
results obtained with Nbmax = 1750 and 2000. For
all problems, analysing each one of the 6 groups of
experiments done, the “upper average” were always
lesser than the “lower average”, indicating that big
values of Nbmax can improve the search quality.
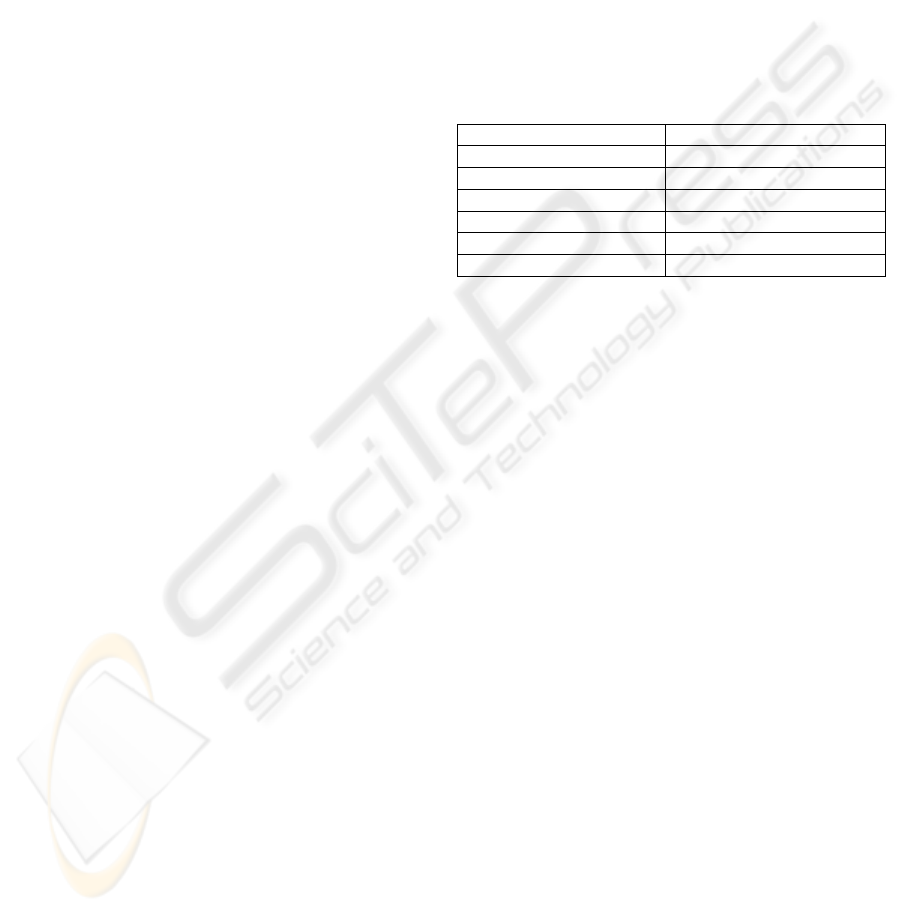
Figure 1 shows an example of the graphics
COMPARYING A TABU SEARCH PROCESS - Using and Not Using and Intensification Strategy to Solve the Vehicle
Routing Problem
79
generated with the results of the search process. It’s
clear to see that an increase in Nbmax value can
improve the search quality, by decreasing the results
costs of the solutions.
Results obtained for a Nbmax variation with fixed Tabu list size for a
search process not using intensification with V1,V2
1300
1320
1340
1360
1380
1400
1420
1440
1460
1
0
0
250
500
7
5
0
1
0
0
0
1250
1
5
0
0
1750
2
0
0
0
Nbmax value
Cost
Solution cost
w ith Tabu List
size = 10
Solution cost
w ith Tabu List
size = 25
Solution cost
w ith Tabu List
size = 50
Solution cost
w ith Tabu List
size = 75
Solution cost
w ith Tabu List
size = 100
Solution cost
w ith Tabu List
size = 200
Figure 1: Costs obtained from Nbmax variation with
different Tabu List size for problem 5 using V1 and V2
without intensification.
Tables 2 to 6 show the number of best results that were
found in each Nbmax value:
Table 2: Quantity and localization of the best Results
found for problem 1.
500 750 1000 1250 1500 1750 2000
Int. 1 1 3 3 3 4 3
No
Int.
0 0 1 2 4 6 5
Table 3: Quantity and localization of the best Results
found for problem 2.
500 750 1000 1250 1500 1750 2000
Int. 1 0 1 3 4 2 7
No
Int.
0 0 1 2 3 6 6
Table 4: Quantity and localization of the best Results
found for problem 3.
500 750 1000 1250 1500 1750 2000
Int. 0 1 0 2 1 4 10
No
Int.
0 1 0 1 2 1 12
Table 5: Quantity and localization of the best Results
found for problem 4.
500 750 1000 1250 1500 1750 2000
Int. 0 0 1 2 3 1 11
No
Int.
0 0 1 4 1 2 10
Table 6: Quantity and localization of the best Results
found for problem 5.
500 750 1000 1250 1500 1750 2000
Int. 0 0 2 3 0 1 12
No
Int.
0 0 0 1 1 5 11
These tables shown that most best results were
found when the search used big values of Nbmax.
5.2 Analysing the Tabu List Size
Variation for Each Nbmax Value
By analysing the results in this perspective it will be
evaluate the variation of the tabu list size for each
Nbmax value. The objective is verified if big Tabu
list size can improved the quality of Tabu Search
process. For problem 1, not using intensification,
66,66% of the results were found with Tabu list size
>=75. Using intensification it was 48,14%. For
problem 2 the percentage were 55,55% and 59,25%,
not using and using intensification. For problem 3
the percentage were 77,77% and 96,29% not using
and using intensification. For problem 4 these
percentage were 74,05% and 77,77% and for
problem 5 they were 63,88% and 92,59%. So by
analysing these results we can see that big tabu list
size can improve the quality of the search process.
5.3 Comparing the Search Process
using and not using Intensification
This analysis intend to compare the search process
using and not using the intensification strategy to see
if it can improve the results generated.
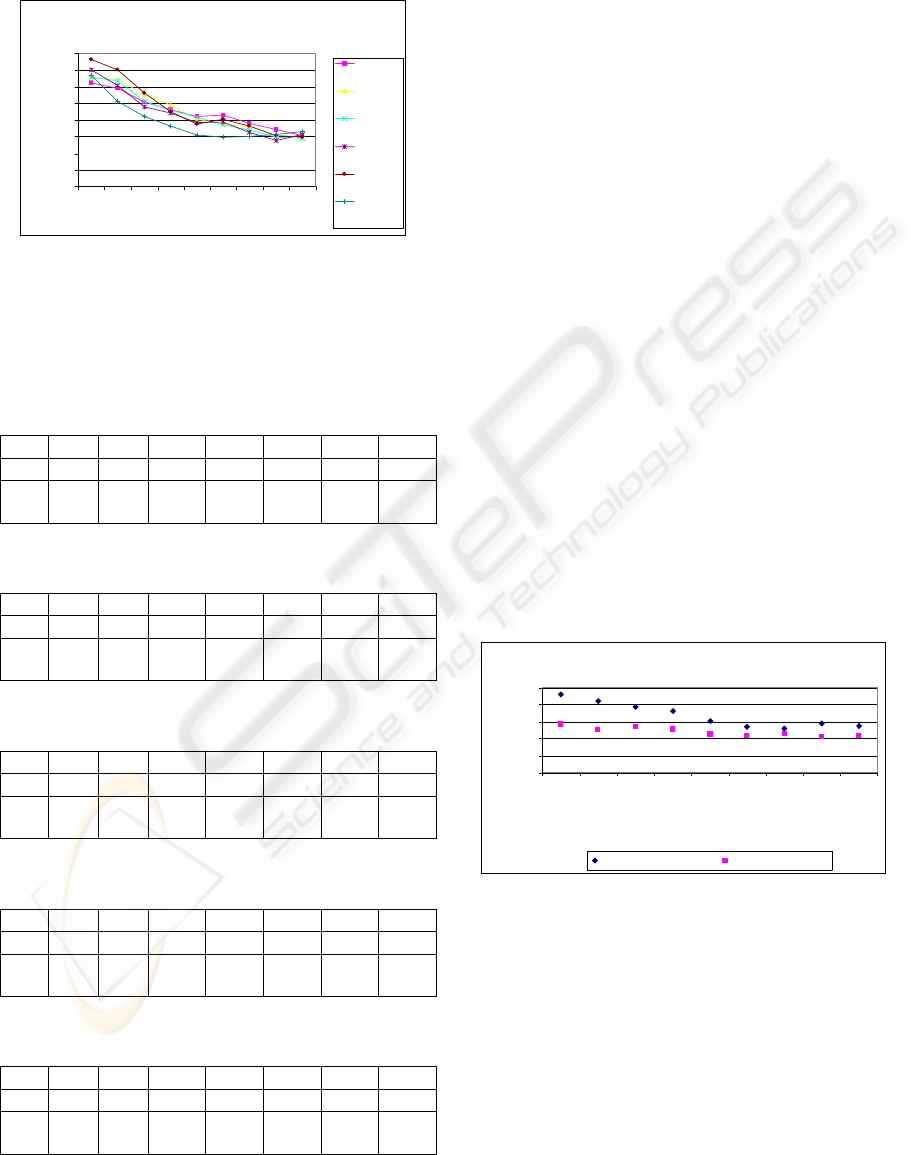
Figure 2 shows an example of the graphics done
with the results obtained in both search process to
compare the quality of the different search process.
Results from search process using V2
1250
1300
1350
1400
1450
1500
75/10
0
75
/
2
5
0
75/50
0
7
5/
7
5
0
7
5
/
1
000
7
5/125
0
75/1500
7
5/175
0
7
5/2000
Tabu List/Nbmax
Cost
Not Using Intensification Using intensification
Figure 2: Costs obtained from both search process for
Tabu List size = 75 and using V2 for problem 5.
This figure shows that an intensification strategy
increase all results of the search process using V2
for problem 5. A comparison with the results
generated by the search process using and not using
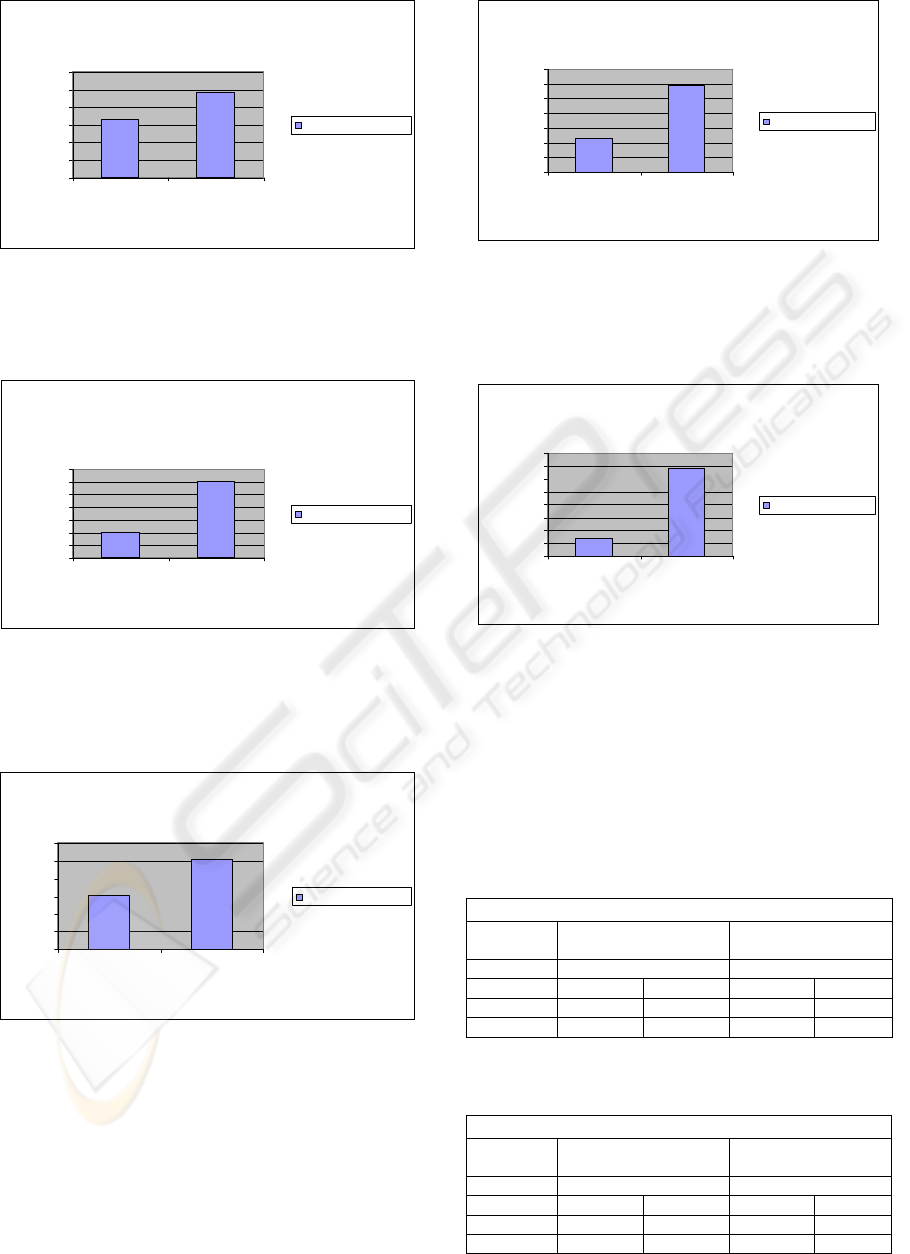
intensification was done. Figures 3 to 7 shows the
percentage of results that were improved with the
intensification strategy. Figure 3 shows that for
problem 1, from 162 results that were generated 97
were improved with intensification.
ICINCO 2007 - International Conference on Informatics in Control, Automation and Robotics
80
Quantity of best results obtained in search
process using and not using intensification for
problem 1
0
20
40
60
80
100
120
not using
intensification
using
intensification
Search type
Results quantity
Best results quantity
Figure 3: Improve caused by the intensification search for
problem 1.
For problem 2, from 162 results, 121 were improved
using intensification strategy.
Quantity of best results obtained in search
process using and not using intensification for
problem 2
0
20
40
60
80
100
120
140
not using
intensification
using
intensification
Search type
Resuls quantyti
Best results quantyti
Figure 4: Improve caused by the intensification search for
problem 1.
For problem 3, from 162 results 102 were improved
using intensification strategy.
Quantity of best results obtained in search
process using and not using intensification for
problem 3
0
20
40
60
80
100
120
not using
intensification
using intensification
Search type
Results quantyti
Best results quantyti
Figure 5: Improve caused by the intensification search for
problem 3.
For problem 4, from 162 results 117 were improved
using intensification strategy.
Quantity of best results obtained in search
process using and not using intensification for
problem 4
0
20
40
60
80
100
120
140
not using
intensification
using
intensification
Search type
Results quantyti
Best results quantyti
Figure 6: Improve caused by the intensification search for
problem 4.
For problem 5, from 162 results 135 were improved
using intensification strategy.
Quantity of best results obtained in search
process using and not using intensification for
problem 5
0
20
40
60
80
100
120
140
160
not using
intensification
using
intensification
Search Process
Results quantyti
Best results quantyti
Figure 7: Improve caused by the intensification search for
problem 5.
The figures show that an increase in solution quality
of, at least, 50% happens when intensification
strategy is used
The average results and the standard deviation are
shown for problem 1, 2, 3, 4 and 5 in tables 7 to 11.
Table 7: Average results and standard deviation for
problem 1.
Problem 1
Average
Standard Deviation
Not Using Intensive Using Intensive
V1 657,55 650,95 24,79 28,30
V2 582,08 570,30 21,16 22,21
V1,V2 537,36 542,01 8,56 13,62
Table 8: Average results and standard deviation for
problem 2.
Problem 2
Average
Standard Deviation
Not Using Intensive. Using Intensive
V1 951,07 943,02 21,68 25,84
V2 895,75 883,03 20,67 21,71
V1,V2 867,96 863,06 13,00 14,70
COMPARYING A TABU SEARCH PROCESS - Using and Not Using and Intensification Strategy to Solve the Vehicle
Routing Problem
81
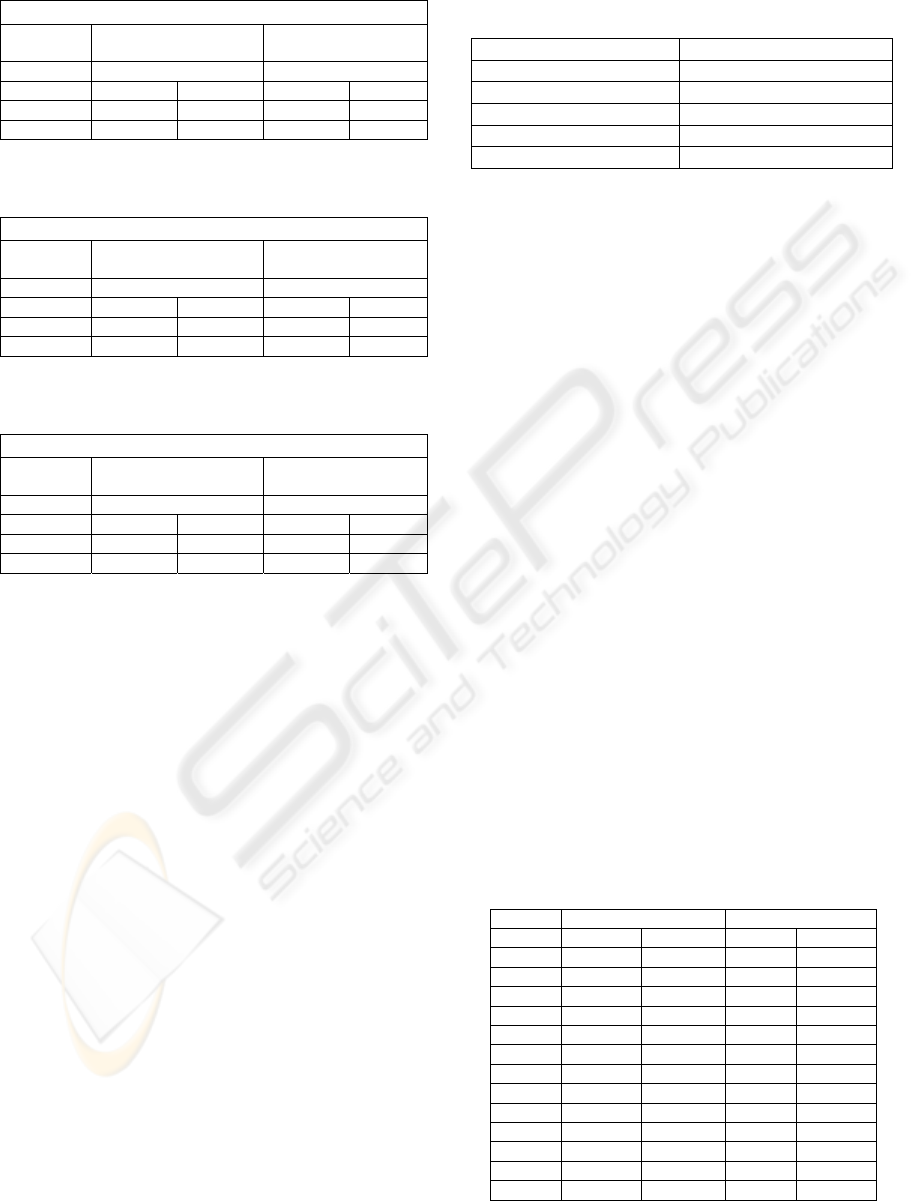
Table 9: Average results and standard deviation for
problem 3.
Problem 3
Average
Standard Deviation
Not Using Intensive. Using Intensive
V1 954,01 948,12 19,60 16,95
V2 903,63 901,17 14,50 17,84
V1,V2 879,90 870,10 15,05 20,73
Table 10: Average results and standard deviation for
problem 4.
Problem 4
Average
Standard Deviation
Not Using Intensive. Using Intensive
V1 1215,35 1210,79 12,79 10,70
V2 1124,93 1118,83 15,66 12,52
V1,V2 1087,72 1079,54 18,15 16,70
Table 11: Average results and standard deviation for
problem 5.
Problem 5
Average
Standard Deviation
Not Using Intensive. Using Intensive
V1 1569,11 1561,59 10,12 16,22
V2 1421,41 1393,56 34,40 12,75
V1,V2 1387,93 1377,82 26,64 16,37
From the results presented in tables 7 to 11 we can
see that the results generated by the movements
grouped are better than the results obtained using the
movements alone. The reason for this is that when
movements are used together the size of the
neighbourhood generated is bigger than the
neighbourhood generated by V1 or V2 alone. The
movements together also cause an increase of the
diversification of the solutions. And when the search
generates more results, it is doing a deeper search in
the space. Of course, as was shown, the
intensification strategy helps the search to produce
more qualified results.
When comparing the V1 and V2 movements, we can
see that V2 produce results more qualified. If we
analyse the policy behind the movement, we can say
that V2 is more flexible than V1. V1 needs that two
constraints are satisfied to generate one neighbour.
While in V2, just one demand capacity must be
verified (the capacity of the vehicle that serve the
route where the vertex are being allocated) in V1,
both routes must be verified to see if the vehicles
capacities aren’t exceeded.
Next table shows the best results obtained for each
problem. All the best results were obtained during
the search using movements V1 and V2 together and
with the intensification strategy.
Table 12: Best results obtained.
Problem Best Result
1 525,42
2 847,82
3 837,79
4 1061,07
5 1352,74
5.4 Comparisons
Aiming to evaluate the quality of the application
developed, some papers were selected from the
literature to compare the results. There were selected
some classical heuristic and some papers that also
used Tabu Search to solve the VRP. The paper
selected were: {WL} Willard (1989), {PF}Pureza
and França (1991), {OM1} Osman (1991), {OM2}
Osman (1993), {RG} Rego (1998), {GHL}
Gendreau, Hertz and Laporte (1994), {BO}
Barbarasoglu and Ozgur (1999), {XK} Xu and
Kelly (1996), {TV} Toth and Vigo (2003), {CW}
Clarke and Wright (1964), {GM} Gillet and Miller
(1974), {MJ} Mole and Jamenson (1976), {CMT}
Christofides, Mingozzi and Toth (1979).
Table 13 shows the comparison done with the results
from the papers. The results were obtained in
Barbarasolgu and Ozgur (Barbarasolgu and Ozgur,
1999) and in Gendreau, Hertz and Laporte
(Gendreau, Hertz and Laporte, 1994). In the first
columns the paper used is shown. Columns 2 and 4
present the best results from the paper and columns
3 and 5 shows the difference in percentage from the
results obtained in this paper to the paper compared.
This difference was called “gap”. The (+) indicate
that our result is that percentage more than the result
from the paper. The (-) indicate that our results is
that percentage minor than the result from the paper.
Table 13: Best Results and gap for problem 1 and 2.
Problem 1 Problem 2
Best %Gap Best %Gap
WL 588 11,91(-) 893 5,33(-)
RG 557,86 6,17(-) 847 0,10(+)
PF 536 2,10(-) 842 0,69(+)
OM1 524,61 0,15(+) 844 0,45(+)
OM2 524,61 0,15(+) 844 0,45(+)
GHL 524,61 0,15(+) 835,77 1,42(+)
BO 524,61 0,15(+) 836,71 1,31(+)
XK 524,61 0,15(+) 835,26 1,48(+)
TV 524,61 0,15(+) 838,60 1,09(+)
CW 578,56 10,11(-) 888,04 4,74(-)
GM 546 3,92(-) 865 2,03(-)
MJ 575 9,44(-) 910 7,33(-)
CMT 534 1,63(-) 871 2,73(-)
ICINCO 2007 - International Conference on Informatics in Control, Automation and Robotics
82
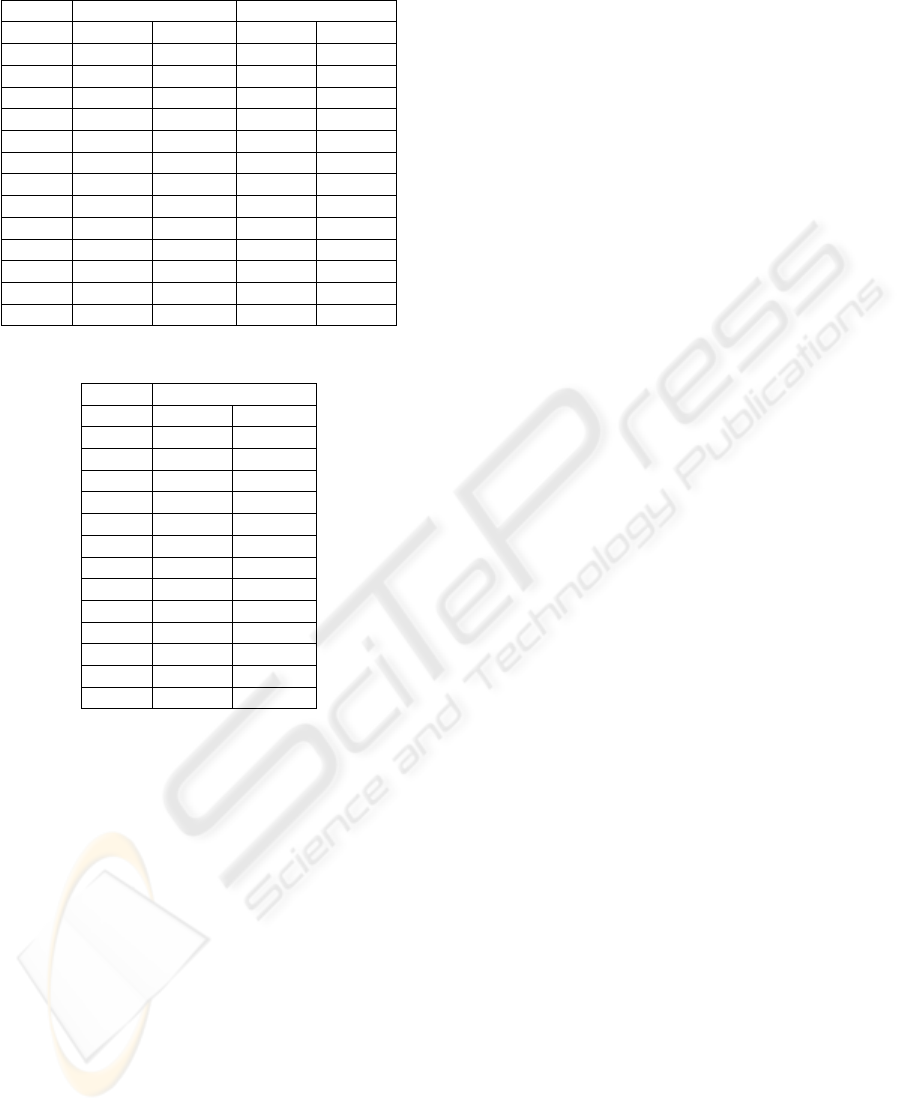
Table 14: Best Results and gap for problem 3 and 4.
Problem 3 Problem 4
Best %Gap Best %Gap
WL 906 8,14(-) - -
RG 832,04 0,69(+) 1074,21 1,31(+)
PF 851 1,58(-) 1081 1,88(-)
OM1 835 0,33(+) 1052 0,85(+)
OM2 838 0,03(-) 1044,35 1,58(+)
GHL 829,45 1,00(+) 1036,16 2,35(+)
BO 828,72 1,08(+) 1043,89 1,62(+)
XK 826,14 1,39(+) 1029,56 2,97(+)
TV 828,56 1,10(+) 1028,42 3,08(+)
CW 878,70 4,88(-) 1204 13,47(-)
GM 862 2,89(-) 1079 1,69(-)
MJ 882 5,28(-) 1259 18,65(-)
CMT 851 1,58(-) 1093 3,01(-)
Table 15: Best Results and gap for problem 5.
Problem 5
Best %Gap
WL - -
RG 1352,88 0,014(-)
PF - -
OM1 1354 0,09(-)
OM2 1334,55 1,34(+)
GHL 1322,65 2,22(+)
BO 1306,16 3,44(+)
XK 1298,58 4,00(+)
TV 1291,45 4,53(+)
CW 1540 13,84(-)
GM 1389 2,68(-)
MJ 1545 14,21(-)
CMT 1418 4,82(-)
By analysing these tables we can see that our
application produce more qualified results than all
the classical heuristics used in comparison because
our result was better than all of the heuristic results.
Comparing with other tabu search algorithm, we can
say that our algorithm is very competitive. It
dominates at least 2 results from the 9 used for each
problem. Moreover, the results generated were less
than 5% of the other results for all cases. And in 25
cases out of 45 this percentage is minor than 2%.
6 FINAL CONSIDERATIONS
In this paper it was proposed an application using
Tabu Search to solve the vehicle routing problem.
This application was divided into 3 modules: a net
generation module, an initial solution module and
tabu search module. We used two movements based
in relocation of vertices and exchange of vertices to
create the neighbourhood. We use the movements
alone and together, intending to diversify the
solutions. We used an elite list solution to keep the
best results found during the search. We propose an
intensification strategy to use every time the search
executes 15 iterations without improvement in
objective value. We proposed some experiments to
test if the solution quality increase or not with the
increase in Nbmax value and in Tabu List size. We
also compare the search process using and not using
intensifications intending to see if this solution´s
quality is improved with the Intensification strategy.
The experiments showed that big values to Nbmax
and Tabu list size could improve the results. From
the experiments we also can see that an
intensification strategy can improve the quality of
the search.
REFERENCES
Ballou, R.H. 2001 Gerenciamento da cadeia de
Suprimentos – Planejamento, Organização e Logística
Empresarial, 4Ed, Porto Alegre: Bookman
Barbarasoglu,G., Ozgur, D. 1999. “A tabu search
algorithm for the vehicle routing problem”, Computers
& Operations Research 26, 255-270
Bodin, L.D, Golden, B.L., Assad, A.A., Ball, M.O. 1983
“Routing and Scheduling of vehicles and crews: The
State of the Art”. Computers and Operations Research
10, 69-211
Clarke, G, Wright, J.W. 1964 “Scheduling of vehicles
from a central depot to a number of delivery points”.
Operations Research 12: 568-581
Christofides, N.; Mingozzi, A.; Toth, P.1979. The Vehicle
Routing Problem.In: Christofides, Nicos.
Combinatorial Optimization UMI, 1979
Cook,W.J, Cunningham, W.H, Pulleyblank, W.R,
Schrijver, A.1998. Combinatorial Optimization.
Willey
Cordeau, J-F., Gendreau, M., Laporte, G., Potvin, J.-Y., &
Semet, F. 2002. A guide to vehicle routing heuristics.
Journal of the Operational Research Society, 53,512-
522
Gendreau, M.,Hertz, A.,Laporte, G. 1994 “A Tabu Search
Heuristic for the Vehicle Routing Problem”.
Management Science, 40, 1276-1290.
Gillet, B.E, Miller, L.R.1974 “A heuristic algorithm for
the vehicle dispatch problem” Operations Research 22,
240-349.
Glover,F.1989 “Tabu Search – parte 1”. ORSA Journal on
Computing v.1, n.3.
Glover,F.,Laguna,M..1997 Tabu Search. Kluwer
Academic Publishers.
Ho, S.C.,Haugland, D. 2004 “A tabu search heuristic for
the vehicle routing problem with time windows and
split deliveries” Computers & Operations Research
31, 1947-1964
COMPARYING A TABU SEARCH PROCESS - Using and Not Using and Intensification Strategy to Solve the Vehicle
Routing Problem
83

Laporte, G. 1992. “The Vehicle Routing Problem: An
overview of exact and approximate algorithms”.
European Journal of operational Research 59,345-458
Laporte,G., Gendreau,M., Potvin,J., Semet, F.2000
“Classical and modern heuristics for the vehicle
routing problem” Intl.Trans. in Op. Res 7,285-300
Lentra,J.K, Rinnoy K., G. 1981 “Complexity of Vehicle
Routing and Scheduling Problems” Networks 11,221-
227
Mole,R.H, Jamenson, S.R. 1976 “A sequential route -
building algorithm employing a generalized savings
criterion” Operations Research Quarterly 27,503-511
Osman, I; Laporte,G.1996 Metaheuristics: A bibliography.
Annals of Operations Research 63, 513-628.
Pureza V.M., França, P.M. 1991.“Vehicle routinh
problems via tabu search metaheuristic, Publication
CRT-747, Centre de recherché sur les transports,
Montreal.
Rego, C. 1998 “A Subpath Ejection Method for the
Vehicle Routing Problem”, Management Science, 44,
1447-1459.
Tarantilis, C.D; Ioannou, G; Prastacos, G. 2005
“Advanced vehicle routing algorithms for complex
operations management problems” Journal of Food
Engineerig, 70:455-471.
Thangiah, S.R., Petrovik, P. 1997 Introduction to Genetic
Heuristics and vehicle Routing Problems with
Complex Constraints.In: Woodruff, David, L.
Advances in Computacional and Stochastic
Optimization, Logic programming , and Heuristic
search: Interfaces in Computer Science and Operations
research. Kluwer Academic Publishers.
Toth, P., Vigo, D. 2003 “Models, relaxations and exact
approachs for the capacitated vehicle routing problem”
Discrete Applied Mathematics 123, 487-512
Tyagi, M. 1968 “A Pratical Method for the Truck
Dispatching Problem”. J. of the Operations Research
Society of Japan, 10,76-92
Xu, J., Kelly, James P. 1996 “A Network Flow-Based
Tabu Search Heuristic for the Vehicle Routing
Problem” Transportation Science 30, 379-393
Willard, A.G. “Vehicle routinh using r-optimal tabu
search”.MSc.Disseration, The Management School,
Imperial College, London (1989)
ICINCO 2007 - International Conference on Informatics in Control, Automation and Robotics
84
