
VERSATILE EVALUATION OF EFFECTS ON DCT-BASED
LOSSY COMPRESSION OF EMG SIGNALS ON MEDICAL
PARAMETERS
Tiia Siiskonen, Tapio Grönfors and Niina Päivinen
Department of Computer Science, University of Kuopio, Yliopistonranta 5, Kuopio, Finland
Keywords: Lossy data compression, Electromyography, Discrete Cosine Transform and Medical parameters.
Abstract: Typically used simplified error measures, like mean-squared-error (MSE), do not reveal everything about
the clinical quality of lossy compressed medical signals. Errors have to be interpreted via essential medical
parameters. The medical parameters depend on the type of the signal and only the preservation of essential
medical parameters can guarantee the correct clinical quality. In this study, short electromyography (EMG)
signals are compressed with DCT transformation -based lossy compression method. The compression is
gained with irreversible masking and scalar quantization of the DCT coefficients. The most prominent
medical parameters of EMG signal are the mean frequency (MNF) and the median frequency (MDF). The
behaviors of these parameters are studied both by fitting a regression line and by examining the mean
absolute errors frequency-by-frequency over clinically interesting frequency range. This reveals the
frequency dependency of errors of the medical parameters and inspires the idea that the generated linear
model can be used for estimating the correct value of the processed medical parameter.
1 INTRODUCTION
The compression ratio, the computational efficiency
of the method, and the quality of the result are the
most essential features of lossy signal compression
(Salomon, 2004). The quality of the result is
typically characterized with mathematical,
measurable error, or the distance between original
and processed (compressed-decompressed) signal.
It has not been validated that simplified error,
represented as mean-squared-error (MSE) (Carotti et
al., 2006), signal-to-noise-ratio (SNR) (Cuerrero and
Mailhes, 1997) or root-mean-squared difference
(PRD) (Wellig et al., 1998), can establish the
preservation of medical parameters. Only the
preservation of essential medical parameters can
guarantee the correct clinical quality. In spite of that
fact, many medical signal compression studies rely
only on simplified error measurements. However,
some of the thorough studies have been concentrated
on distinguishing proper medical parameters (Chan,
Lovely and Hudgins, 1997; Carotti et al., 2006;
Grönfors, Reinikainen and Sihvonen, 2006).
The lossy compression of electromyography
(EMG) signals is not intensively studied, although
the first methods have been published almost ten
years ago (Cuerrero and Mailhes, 1997). Anyway,
currently many EMG technologies, for example
wireless measuring and archiving in patient
recordings, need effective data compression. In this
study, a DCT-based transformation approach has
been used (Cuerrero and Mailhes, 1997; Berger et
al., 2003), because of well-known algorithm with
efficient implementation.
The most prominent spectral features of EMG
signal are the mean frequency (MNF) and the
median frequency (MDF) (Farina and Merletti,
2000; Filligoi and Felici, 1999), whose time
evolution has been used for clinical assessment of
EMG recordings. The simplified error represents a
suggestive average estimate of the error value of the
medical parameters, but it cannot be used to predict
where in the dynamic range the error has been
concentrated. In this study, we focus on versatile
evaluation of compression effects on medical
parameters. Both systematic and random errors on
medical parameters are examined over these
dynamic ranges.
149
Siiskonen T., Grönfors T. and Päivinen N. (2007).
VERSATILE EVALUATION OF EFFECTS ON DCT-BASED LOSSY COMPRESSION OF EMG SIGNALS ON MEDICAL PARAMETERS.
In Proceedings of the Fourth International Conference on Informatics in Control, Automation and Robotics, pages 149-156
DOI: 10.5220/0001640501490156
Copyright
c
SciTePress

2 MATERIALS AND METHODS
We have used real EMG recordings in this study. All
the tests and simulations were done with Matlab
(Versions 6.5.0.180913a Release 13 and 7.14
Release 14).
2.1 Test Signals
We have used EMG signals measured from
paraspinal muscles of healthy young volunteers. The
measurements and classification were done by an
experienced clinical neurophysiologist. The duration
of every signal was 20 seconds and they were
sampled with 1 kHz sampling frequency, consisting
of 20000 twelve-bit integer values measured with
DCU-600 lightweight EMG system (Sihvonen et al.,
2004). Each signal consists of several muscle
activity periods.
We have randomly picked out five 20000 sample
long EMG signals for training material and another
five 20000 sample long EMG signals for testing
material. On other words, we have used two
independent materials for testing and training, both
consisting of 100000 samples.
2.2 Spectral Features Mean Frequency
and Median Frequency
The mean and median frequencies are calculated
from the frequency spectrum of the segmented
signal. Signal segments are sliding over the signal
with one sample step (segments are heavily
overlapping). The frequency spectrum is obtained by
taking the FFT of the segment, using a Hanning
window of length 1024. The frequency spectrum
consists of 512 amplitude coefficients, A
i
.
The mean frequency MNF is the amplitude-
weighted average of the frequencies,
1
1
(1)
M
ii
i
M
i
i
fA
MNF
A
=
=
=
∑
∑
Graphically, the median frequency is the
frequency dividing the area of the amplitude
spectrum into equal halves. The value can be
computed using a cumulative function
(2)
k
f
m
m
fk
m
m
A
c
A
=
∑
∑
The median frequency MDF is the value of f
k
for
which the value of c
fk
is as close to 1/2 as possible.
2.3 The DCT Method
The proposed compression technique is based on
discrete cosine transformation which is a very
popular transformation used in many compression
schemes, especially in image compression standards
such as JPEG. There are also applications for
biomedical signal compression based on DCT
(Cuerrero and Mailhes, 1997; Berger et al., 2003).
The idea of transformation coding is that the
sequence of n data samples of one domain is rotated
to some other domain with equation
(3)
=
XTY
where X is the vector of original signal coefficients,
Y is the vector of transformed coefficients and T is
the transform matrix. The DCT coefficients of n data
samples in one-dimensional case is (Salomon, 2004)
given by
)4(
2
)12(
cos
2
1
0
∑
−
=
⎥
⎦
⎤
⎢
⎣
⎡
+
=
n
t
tff
n
ft
pC
n
G
π
where
)5(.1,...,1,0,
,0
,0
,1
,
2
1
−=
>
=
⎪
⎩
⎪
⎨
⎧
= ntffor
f
f
C
f
Input vector of n data values is p
t
and the output
vector is a set of n DCT coefficients G
f
. The inverse
DCT transformation is (Salomon, 2004) given by
.1,...,1,0
)6(
,
2
)12(
cos
2
1
0
−=
⎥
⎦
⎤
⎢
⎣
⎡
+
=
∑
−
=
nt
for
n
jt
GC
n
p
n
j
jjt
π
DCT compression concentrates signal energy to
a small number of DCT coefficients and the
compression is usually achieved by eliminating the
coefficients containing less information.
The DCT method applied here is based on three
steps:
ICINCO 2007 - International Conference on Informatics in Control, Automation and Robotics
150

• DCT
• Eliminating some of DCT coefficients
by using a masking vector
• Scalar quantization of the coefficients
First step was to calculate DCT from the original
signal using blocks of 16, 24 or 32 signal
coefficients. In these tests DCT was done by using
MatLab's DCT-function. After that, some of the
coefficients were eliminated by using binary
maskvector. Maskvector is the same size as the used
DCT block size. If maskvector's value in some index
is zero, the value of corresponding index of DCT
block will be eliminated. Otherwise maskvector's
value is one and DCT coefficient in corresponding
index will not be eliminated.
Maskvector is constant during the whole
compression process and the same vector is used
when compression is done and when signal is
decompressed. Before IDCT, receiver adds zeros at
those indexes of DCT block where coefficients have
been eliminated to have correct number of
reconstructed signal coefficients.
In this study, we have used masking to eliminate
high end DCT coefficients. For block size 16
coefficients we masked out last 3, 5 and 7 DCT
coefficients, for block size 24 respectively 4, 8 and
12 DCT coefficients, and for block size 32
respectively 5, 10 and 15.
After masking the selected coefficients, the rest
of coefficients will be scalar quantized. Compression
in this method comes from masking some DCT
coefficients and from scalar quantization.
Decompression is done by finding the DCT
values corresponding to indexes from codebook,
adding zeros to those places of the DCT block where
coefficients have been eliminated and making the
IDCT.
2.4 Scalar Quantization of Coefficients
In this study, non-uniform scalar quantization
method was used to quantize the DCT coefficients.
In a uniform scalar quantization the difference
between every value in codebook is the same,
whereas in a non-uniform scalar quantization the
difference between codebook values depends on the
distribution of coefficients' probabilities. In the
intervals where the probability of that the coefficient
is placed on that interval is large, the difference
between codebook values is short, and where the
probability of coefficient is placed on some interval
is small, the difference between codebook values is
bigger.
Table 1: Raw remaining sizes and mean-squared-errors
(MSE) of compressed signals in percentages by variations.
Codebook size 64 (6 bit)
Segment length 16 samples
Without mask 50% 25.6498
Masking last 3 41% 25.9935
Masking last 5 34% 27.6196
Masking last 7 28% 36.1951
Segment length 24 samples
Without mask 50% 17.0290
Masking last 4 42% 17.2294
Masking last 8 33% 19.0580
Masking last 12 25% 36.3946
Segment length 32 samples
Without mask 50% 19.5787
Masking last 5 42% 19.7208
Masking last 10 34% 20.8712
Masking last 15 27% 31.1169
Codebook size 256 (8 bit)
Segment length 16 samples
Without mask 67% 20.2835
Masking last 3 54% 20.6467
Masking last 5 46% 22.2934
Masking last 7 38% 30.9039
Segment length 24 samples
Without mask 67% 13.6706
Masking last 4 56% 13.8864
Masking last 8 44% 15.7420
Masking last 12 33% 33.1424
Segment length 32 samples
Without mask 67% 18.4853
Masking last 5 56% 18.6404
Masking last 10 46% 19.8118
Masking last 15 35% 30.1023
We constructed the codebooks by using Matlab's
KMEANS function. Before using KMEANS
function, the DCT of the training signal was
calculated using the same DCT block size which
will be used when compressing the test signal.
KMEANS function was given the following
parameters: training signal, which has 50000
samples, replicates 'rep' was 3, which made method
more optimal, maximum number of iterations
'maxiter' was 800 and 'EmptyAction' was 'singleton',
which creates a new cluster consisting of the one
point furthest from its centroid. We tested codebook
sizes 64 and 256. For codebook size 64, it is possible
to present all codebook indexes with 6 bits and
respectively for codebook size 256, indexes are
presented with 8 bits.
VERSATILE EVALUATION OF EFFECTS ON DCT-BASED LOSSY COMPRESSION OF EMG SIGNALS ON
MEDICAL PARAMETERS
151
3 RESULTS
The transformation itself has no compression effect;
all the compression is gained with irreversible
masking and scalar quantization of DCT
coefficients.
The achieved compression rations and related
MSE values by processing variations are listed in
Table 1. The general observation is that the MSE
increases when more coefficients are masked out
and MSE decreases when codebook size increases.
3.1 The Parameter Model
The mean frequency and median frequency values
are calculated from sliding segments for original
testsignal and all compressed-decompressed signals.
In every case we got 98974 MNF, MDF -pairs from
every signal. These values are compared time
synchronically against values of the original
unprocessed test material. That way we got new set
of value pairs:
()
()
,
(7)
,
original processed
ii
original processed
ii
MNF MNF
MDF MDF
where
98973,...,0=i is the segment number.
The pairs of values make possible the evaluation
of the effects of lossy compression to essential
medical parameters from-frequency-to-frequency. In
an ideal case, there are no differences.
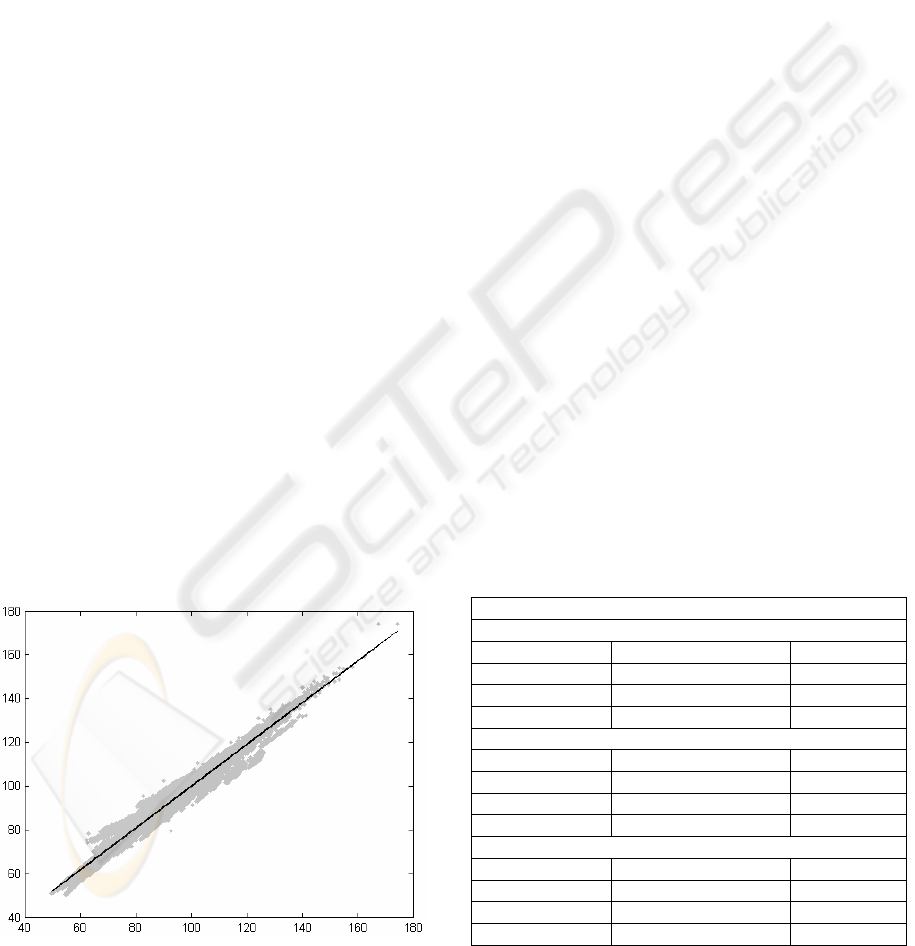
Figure 1: Idea of fitting the regression line.
To model the behaviour of original MNF and
MDF values against the processed values, we fit the
regression lines to all sets with Matlab's POLYFIT
function.
dcMDFMDF
baMNFMNF
originalprocessed
originalprocessed
+=
+=
)8(
In Figure 1, the best fit line can be seen inside the
cloud of data points. Both axes are in frequency (Hz)
and the points are presented as the original value on
X-axis against the processed value on Y-axis. The
line coefficients and the norm of residuals are listed
in Table 2 - 5. If the line is exactly diagonal, there is
no error between the medical parameters of original
and processed signals.
The error of MNF value is typically positive in
low frequencies (the MNF of processed signal is
higher than the MNF of the original signal) and
negative in high frequencies. Reversal point is
around 80 Hz. The negative error in high frequencies
is smaller on nonmasked cases and the masking
increases it. The behaviour of the error of MDF
value is similar to MNF value, but typically smaller
in absolute value.
The line coefficients and the norm of residuals
values not seems to be dependent on segment length.
By comparing MSE values in Table 1 and norm of
residual values in Tables 2-5, can be recognized that
results are more or less correlated with each other.
Table 2: Line coefficients and the norm of the residuals of
MNF values.
Codebook size 64 (6 bit)
Segment length 16 samples
Without mask a=0.9611 b=5.0618 526.1498
Masking last 3 a=0.9479 b=5.6428 592.4270
Masking last 5 a=0.9401 b=6.1727 727.8094
Masking last 7 a=0.9425 b=5.9066 954.0903
Segment length 24 samples
Without mask a=0.9824 b=2.5583 280.5778
Masking last 4 a=0.9616 b=3.6733 486.0408
Masking last 8 a=0.9421 b=4.6243 833.8518
Masking last 12 a=0.9110 b=6.0588 1.1791e+003
Segment length 32 samples
Without mask a=0.9780 b=2.8869 301.1080
Masking last 5 a=0.9635 b=3.5139 394.1623
Masking last 10 a=0.9432 b=4.5146 626.5258
Masking last 15 a=0.9121 b=5.4824 972.4219
ICINCO 2007 - International Conference on Informatics in Control, Automation and Robotics
152

Table 3: Line coefficients and the norm of the residuals of
MNF values.
Codebook size 256 (8 bit)
Segment length 16 samples
Without mask a=0.9721 b=3.4008 412.3716
Masking last 3 a=0.9607 b=3.9323 544.9072
Masking last 5 a=0.9552 b=4.3098 711.5584
Masking last 7 a=0.9553 b=4.3155 946.9896
Segment length 24 samples
Without mask a=0.9865 b=1.7056 242.4786
Masking last 4 a=0.9660 b=2.8420 505.2355
Masking last 8 a=0.9469 b=3.8802 832.9791
Masking last 12 a=0.9160 b=5.3868 1.1716e+003
Segment length 32 samples
Without mask a=0.9752 b=2.8877 292.1546
Masking last 5 a=0.9605 b=3.5969 423.3512
Masking last 10 a=0.9412 b=4.5570 651.8788
Masking last 15 a=0.9119 b=5.4024 979.2064
Table 4: Line coefficients and the norm of the residuals of
MDF values.
Codebook size 64 (6 bit)
Segment length 16 samples
Without mask c=0.9943 d=0.9374 337.6673
Masking last 3 c=0.9895 d=1.0218 344.2408
Masking last 5 c=0.9837 d=1.1714 385.5636
Masking last 7 c=0.9689 d=1.4947 501.9240
Segment length 24 samples
Without mask c=0.9949 d=0.6864 291.5252
Masking last 4 c=0.9890 d=0.8036 355.9760
Masking last 8 c=0.9774 d=1.0882 477.4020
Masking last 12 c=0.9328 d=2.3365 708.1398
Segment length 32 samples
Without mask c=0.9960 d=0.6308 279.4163
Masking last 5 c=0.9910 d=0.7421 295.6508
Masking last 10 c=0.9807 d=1.0079 361.8950
Masking last 15 c=0.9445 d=1.9601 574.9671
Table 5: Line coefficients and the norm of the residuals of
MDF values.
Codebook size 256 (8 bit)
Segment length 16 samples
Without mask c=0.9955 d=0.5822 261.3096
Masking last 3 c=0.9914 d=0.6590 289.8141
Masking last 5 c=0.9863 d=0.7767 344.2559
Masking last 7 c=0.9717 d=1.1063 469.8654
Segment length 24 samples
Without mask c=0.9978 d=0.3327 243.8635
Masking last 4 c=0.9918 d=0.4807 296.6823
Masking last 8 c=0.9806 d=0.7793 422.6246
Masking last 12 c=0.9365 d=2.0190 672.4723
Segment length 32 samples
Without mask c=0.9932 d=0.7448 261.7802
Masking last 5 c=0.9884 d=0.8634 287.3707
Masking last 10 c=0.9779 d=1.1613 362.2217
Masking last 15 c=0.9426 d=2.0834 570.4948
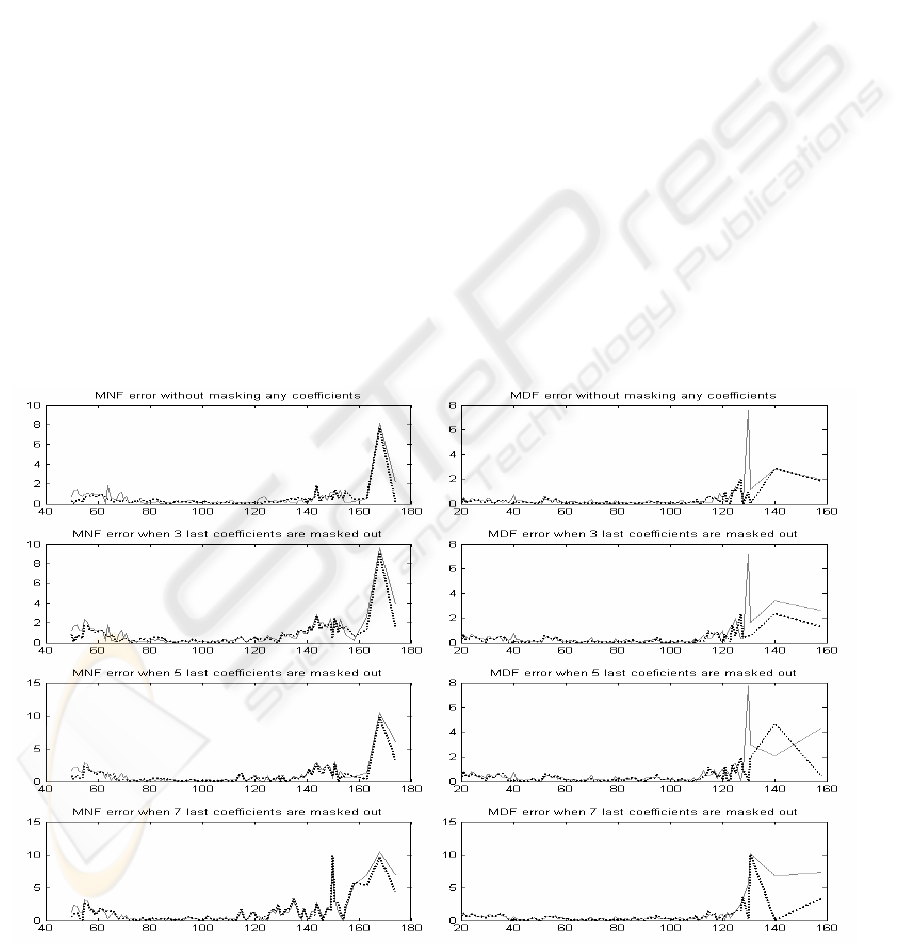
3.2 Contemplation of Error
Examining the mean absolute error of MNF and
MDF values frequency-by-frequency over clinically
interesting frequency range from 40 Hz to 180 Hz is
an entirely novel approach.
The mean absolute error (MAE) is calculated by
sorting the value pairs (Equation 8) in increasing
order and averaging the differences between original
and processed value inside the pair. It must be
noticed that the distribution of the value pairs is not
uniform; on the contrary, the average value is in
some cases coarse.
By examining Figures 2 – 4, it can be easily
noticed that the mean absolute error of MNF and
MDF get the least values between 80 and 120 Hz in
all processing variations. Error is very moderate
within this range, and the segment length itself
doesn't dominate the error.
In the range less than 80 Hz, the error increases
when more coefficients are masked out. However,
behaviour is similar with MNF and MDF values and
also with codebook size 64 (6 bit) and codebook size
256 (8 bit).
The most prominent differences can be seen in
the range over 120 Hz. The error is multifold
compared to other ranges and heavily increasing
when more coefficients are masked out. At this
range the errors are also more dependent on the
codebook size.
Generally, the MNF error is larger than the MDF
error. The segment lengths have not fundamental
effect on error. Again, by comparing MSE values in
Table 1 and peak level of the MAE in the range over
120 Hz in Figures 2-5, can be recognized that results
are more or less correlated with each other, but not
so evidently than in case of the norm of residual
values.
4 CONCLUSIONS
The main value of this study was to reveal the
complexity of error evaluation on EMG signal lossy
compression studies. Guerrero and Mailhes (1997)
have used standard deviation estimator -based SNR
to evaluate the quality of the process. Wellig et al.
(1998) have used both SNR and PRD on quality
evaluation. Berger et al. (2003) use energy -based
SNR as a tool for quality evaluation. None of these
studies cover any medical parameters. Chan, Lovely
and Hudgins (1997) were first ones to use medical
parameters in performance evaluation. Carotti et al.
(2006) have used both MSE and some medical
VERSATILE EVALUATION OF EFFECTS ON DCT-BASED LOSSY COMPRESSION OF EMG SIGNALS ON
MEDICAL PARAMETERS
153
parameters, including MNF and MDF, for quality
evaluation. Examination is made via four force
levels and the results show a valid correlation
between MSE, MNF, and MDF values. Grönfors,
Reinikainen and Sihvonen (2006) have used PRD
value and percentual differences of MNF and MDF
values in quality evaluation. Also these values
indicate correlative behaviour. The use of averaged
values over signals is common for all the referred
studies.
The averaged processing errors with standard
deviations of medical parameters form the baseline
for the evaluation of a lossy compression method.
However, there are pitfalls in the use of averaged
error values. Only the error examinations over the
whole clinically interesting range of parameter
values expose the fidelity.
In this study we have used frequency-by-
frequency aspect and compared synchronically
generated medical parameters of original and
processed signals. We have found that there is more
or less correlation between MSE values and errors in
medical parameters. However, this interdependency
can only reveal the coarse amount of error, not
errors natural for a specific range of MNF or MDF
values.
The contemplation of error approach (chapter
3.2) has strong analytic use in finding out the values
for which the medical parameters are valid. The
parameter model approach (chapter 3.1) has both
theoretical, analytical, value and practical, predictive
usage. The generated regression line can be used for
estimating the true value of the processed parameter.
Together both approaches can produce a tool for
calculating the corrected MNF and MDF value and
an index for their quality.
Some of the achieved results are hypothetical,
such as the best achived compression ratio has the
worst MSE and the effect of masking on error in
high frequency range. With DCT-based method, the
segment length seems not to have prominent effect
on error as with direct vector quantization based
method has (Grönfors and Päivinen, 2006).The
method should be further tested with larger datasets
and with larger quantity of different lossy
compression methods.
Figure 2: Mean absolute errors of MNF and MDF values for segment length 16. Solid line for codebook size 64 and
dotted line for codebook size 256.
ICINCO 2007 - International Conference on Informatics in Control, Automation and Robotics
154
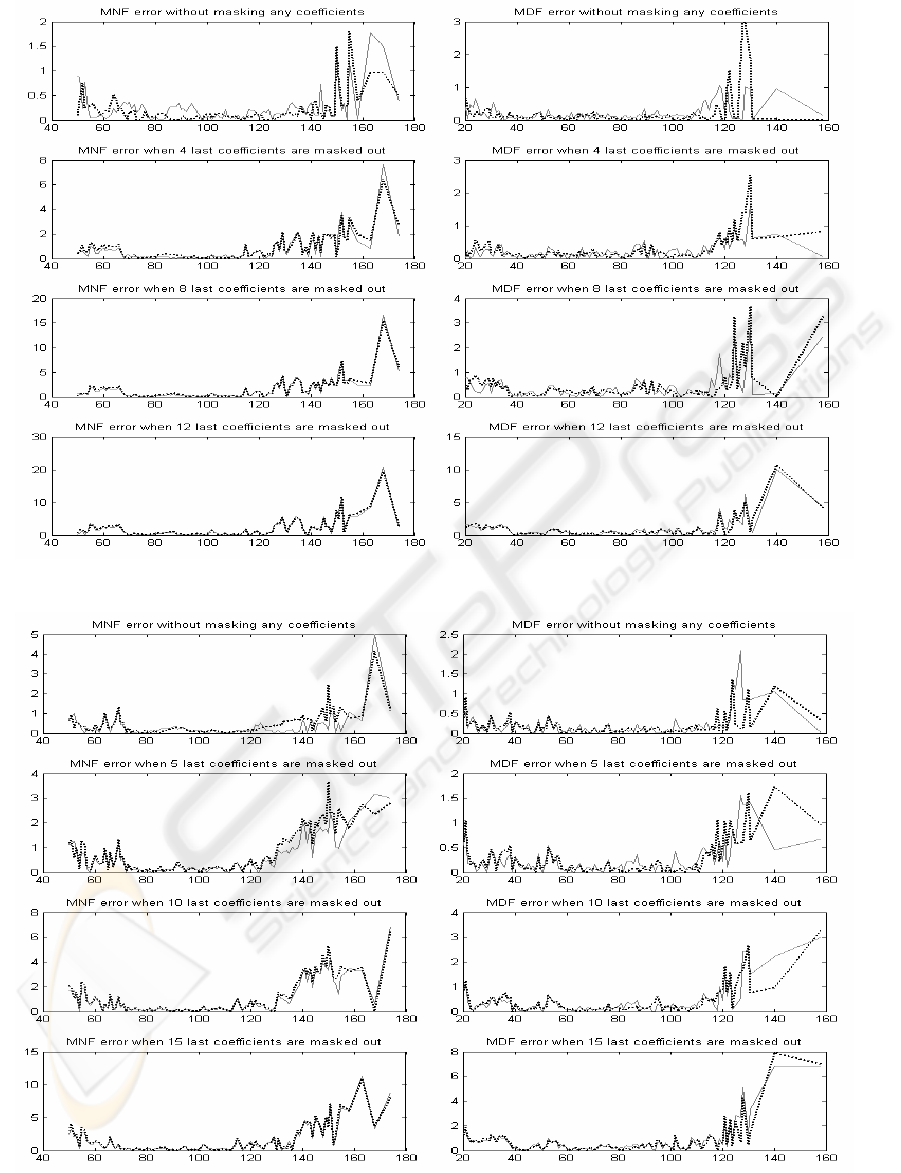
Figure 3: Mean absolute errors of MNF and MDF values for segment length 24. Solid line for codebook size 64 an
d
dotted line for codebook size 256.
Figure 4: Mean absolute errors of MNF and MDF values for segment length 32. Solid line for codebook size 64 an
d
dotted line for codebook size 256.
VERSATILE EVALUATION OF EFFECTS ON DCT-BASED LOSSY COMPRESSION OF EMG SIGNALS ON
MEDICAL PARAMETERS
155

ACKNOWLEDGEMENTS
The authors thank MD PhD Teuvo Sihvonen for his
valuable comments and support in EMG data
collection.
REFERENCES
Berger, P., Nascimento, F., Carmo, J., Rocha, A., dos
Santos, I., 2003. Algorithm for compression of EMG
signals, In Proc. 25th Annual International Conf
IEEE. Engineering in Medicine and Biology society,
Cancun, Mexico, 1299-302
Carotti, E., De Martin, J., Merletti, R., Farina, D., 2006.
Compression of surface EMG signals with algebraic
code exited linear prediction, Medical Engineering &
Physics, Article in press.
Chan, A., Lovely, D., Hudgins, B., 1997. Errors associated
with the use of adaptive differential pulse code
modulation in the compression of isometric and
dynamic myo-electric signals, Medical and
Biological Engineering and Computing, 36, 215-219
Cuerrero, A., Mailhes, C., 1997. On the choice of an
electromyogram data compression method, In Proc.
19th Annual International Conf IEEE. Engineering in
Medicine and Biology society, Chicago, IL, USA,
1558-61
Farina, D., Merletti, R., 2000. Comparison of algorithms
for estimation of EMG variables during voluntary
isometric contractions, Journal of Electromyography
and Kinesiology, 10, 337-349
Filligoi. GD., Felici, F., 1999. Detection of hidden rhytms
in surface EMG signals with a non-linear time-series
tool, Medical Engineering & Physics, 21, 439-448
Grönfors, T., Päivinen, N., 2006, The effect of vector
length and gain quantization level on medical
parameters of EMG signals on lossy compression. In
Proc. 3th International Conference on Advances in
Medical, Signal and Information Processing MEDSIP,
Glasgow, UK.
Grönfors, T., Reinikainen, M., Sihvonen, T., 2006. Vector
quantization as a method for integer EMG signal
compression, Journal of Medical Engineering &
Technology, 30(1), 41-52
Salomon, D., 2004. Data Compression The Complete
Reference, Springer-Verlag, New York
Sihvonen, T., Sihvonen, P., Kuusrainen, S., Grönfors, T.,
2004. Lightweight embedded system for acquiring
simultaneous electromyogenic activity and movement
data, In Proceedings of the 6th Nordic Signal
Processing Symposium - NORSIG 2004, June 9-11,
2004, Espoo, Finland, 177-179.
Wellig, P., Cheng, Z., Semling, M., Moschytz, G., 1998.
Electromyogram data compression using single-tree
and modified zero-tree wavelet encoding, In Proc.
20th Annual International Conf IEEE. Engineering in
Medicine and Biology society, Hong Kong Sar, China,
1303-6.
ICINCO 2007 - International Conference on Informatics in Control, Automation and Robotics
156
