
COMPARISON OF FOCUS MEASURES IN FACE DETECTION
ENVIRONMENTS
J. Lorenzo, O. D
´
eniz, M. Castrill
´
on and C. Guerra
Inst. of Intelligent Systems and Numerical Appl. in Engineering (IUSIANI)
University of Las Palmas de Gran Canaria, Campus Univ. de Tafira, 35017 Las Palmas, Spain
Campus Univ. de Tafira, 35017 LAs Palmas, Spain
Keywords:
Human-Computer Interaction, Computer Vision, Autofocus measures.
Abstract:
This work presents a comparison among different focus measures used in the literature for autofocusing in a
non previously explored application of face detection. This application has different characteristics to those
where traditionally autofocus methods have been applied like microscopy or depth from focus. The aim of the
work is to find if the best focus measures in traditional applications of autofocus have the same performance
in face detection applications. To do that six focus measures has been studied in four different settings from
the oldest to more recent ones.
1 INTRODUCTION
In face detection and face recognition methods (Pent-
land et al., 1994; Rowley et al., 1998; Gross et al.,
2001; Hjelmas and Low, 2001; Yang et al., 2002;
Zhao et al., 2003), borders play an important role be-
cause they define the facial features that appear in the
face such as eyes, mouth and nose, which are needed
to carry out the task. In a blurred image these facial
features are not well defined, and so the detection or
identification can not be done. Blurred images can
be obtained in a defocused camera because defocus-
ing can be modelled as a low-pass filtering process,
opposite to focused images which have a higher fre-
quency content (Nayar, 1994). Thus, it is desirable
that the image acquisition system has an autofocus
mechanism.
Automatic focusing methods fall into two main
categories: active and passive systems. Active meth-
ods are based on emiting a wave in order to estimate
the distance to the object of interest and consequently
adjust the lens position. Passive methods estimate the
position of the lens by means of finding the position
where image sharpness is maximum. Passive focus-
ing methods are normally found in low cost consumer
digital cameras, while active focus is widely used in
professional digital cameras and computer vision ap-
plications such as microscopy or inspection.
As mentioned above, passive autofocusing meth-
ods adjust the focus lens to maximize the high fre-
quency components in the image. Therefore a focus
value is needed to measure the amount of high fre-
quencies in the image. As autofocusing is a long-
standing topic, in the literature a wide variety of focus
algorithms have been proposed each one with an as-
sociated focus measure (Krotkov, 1987; Nayar, 1994;
Lee et al., 1995; Subbarao and Tyan, 1998; Choi and
Ki, 1999; Lee et al., 2001; Nathaniel et al., 2001; Ke-
htarnavaz and Oh, 2003; Kristan and Pernus, 2004;
Shirvaikar, 2004; Park and Kim, 2005; Kristan et al.,
2006).
Most of the published autofocusing algorithms
solve the problem of planar objects like in microscopy
applications (Sun et al., 2004) or single object of
interest like depth from focus applications (Nayar,
1994). In these applications, focus measures exhibit
an ideal curve with a peak with step slopes at the lens
position where the object is focused because there is
only one object in the image or because it is a pla-
nar image. However, in human computer interaction,
people do not always hold the same position in the im-
age and exists more objects in the scene so the focus
measure does not exhibit a clear maximum. In dig-
ital photograhy this drawback is eluded because the
photographer selects the object of interest and centers
it.
418
Lorenzo J., Déniz O., Castrillón M. and Guerra C. (2007).
COMPARISON OF FOCUS MEASURES IN FACE DETECTION ENVIRONMENTS.
In Proceedings of the Fourth International Conference on Informatics in Control, Automation and Robotics, pages 418-423
DOI: 10.5220/0001644604180423
Copyright
c
SciTePress
In this work we analyze the performance of some
focus measures in different scenarios including typi-
cal human computer interaction. These measures are
explained in Section 2. Section 3 describes the exper-
iments and finally in Section 4 the results achieved are
commented.
2 FOCUS ALGORITHMS
As explained in the previous section, many focus
measures have been proposed in the last years to solve
the autofocus problem. All of them rely on the fact
that a focused image has high contents of higher fre-
quencies so any measure which computes these fre-
quencies can be used. In this work, six of these mea-
sures have been chosen to make the comparison. We
have compared well known focus measures with more
recent ones. Below, we briefly describe each one.
The Tenenbaum Gradient (Tenengrad) (Krotkov,
1987) was one of the first proposed focus measures.
This measure convolves the image with vertical (S
x
)
and horizontal (S
y
) Sobel operators. To get a global
measure over the whole image, the square of the gra-
dient vector components are summed.
F
T enengrad
=
XX
S
x
(x, y)
2
+ S
y
(x, y)
2
(1)
The entropy measure proposed by Firestone et al.
(Firestone et al., 1991) is based on the idea that the
histogram of a focused image contains more informa-
tion than the histogram of a defocused one. In this
measure the histogram is normalized to get the prob-
ability p(i) for each gray level i.
F
Entropy
= −
X
intensities
p(i) log p(i) (2)
The Sum of Modified Laplace (SML) (Nayar,
1994) is based on the linear differential operator
Laplacian which has the same properties in all direc-
tions and is therefore invariant to rotation. Thus, the
SML measure sums the absolute values of the convo-
lution of the image with the Laplacian operators.
F
SM L
=
XX
|L
x
(x, y)| + |L
y
(x, y)| (3)
Energy Laplace (Subbarao and Tyan, 1998) is
based on the same idea of the SML mesasure but the
image is convolved with the following mask,
L =
−1 −4 −1
−4 20 −4
−1 −4 −1
which computes the second derivate D(x, y) of the
image. The value of the focus measure is the sum of
the squares of the convolution results.
F
EnergyLaplace
=
XX
D(x, y)
2
(4)
Figure 1: Printed circuit board image.
Figure 2: Box picture.
Nanda and Cutler (Nanda and Cutler, 2001) pro-
posed a focus measure from the contrast of a image as
the absolute difference of a pixel with its eight neigh-
bors, summed over all the pixels of the image.
F
Contrast
=
XX
C(x, y) (5)
where the contrast C(x, y) for each pixel in the gray
image I(x, y) is computed as
C(x, y) =
x+1
X
i=x−1
y+1
X
j=y−1
|(I(x, y) − I(i, j)|
Kristan et al. (Kristan et al., 2006) described
M
Be
, which is one of the most recent focus mea-
sures. It is based on the coefficients of the discrete co-
sine transform obtained after dividing the image into
8x8 non overlapped windows and then averaging over
all the 8x8 windows. It must be noticed that in our
implementation we have no filtered components cor-
responding to high order frequencies as Kristan pro-
poses.
F
M
Be
=
P
M
′
Be
num. of 8x8 windows
(6)
where M
′
Be
is computed from the DCT coefficients
F (ω, ν) as
M
′
Be
= 1 −
P
|F (ω, ν)|
2
(
P
|F (ω, ν)|)
2
COMPARISON OF FOCUS MEASURES IN FACE DETECTION ENVIRONMENTS
419
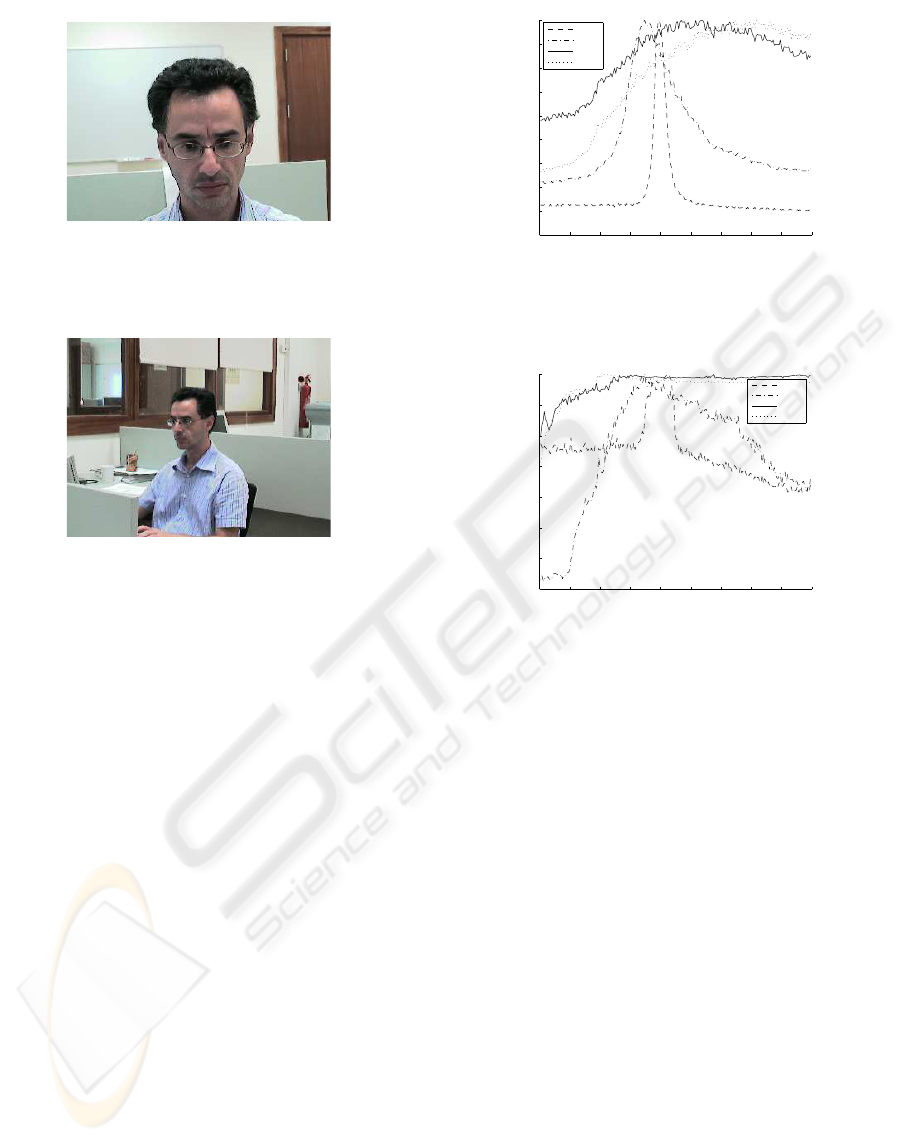
Figure 3: First human computer interaction scenario.
Figure 4: Second human computer interaction scenario.
3 EXPERIMENTAL STUDY
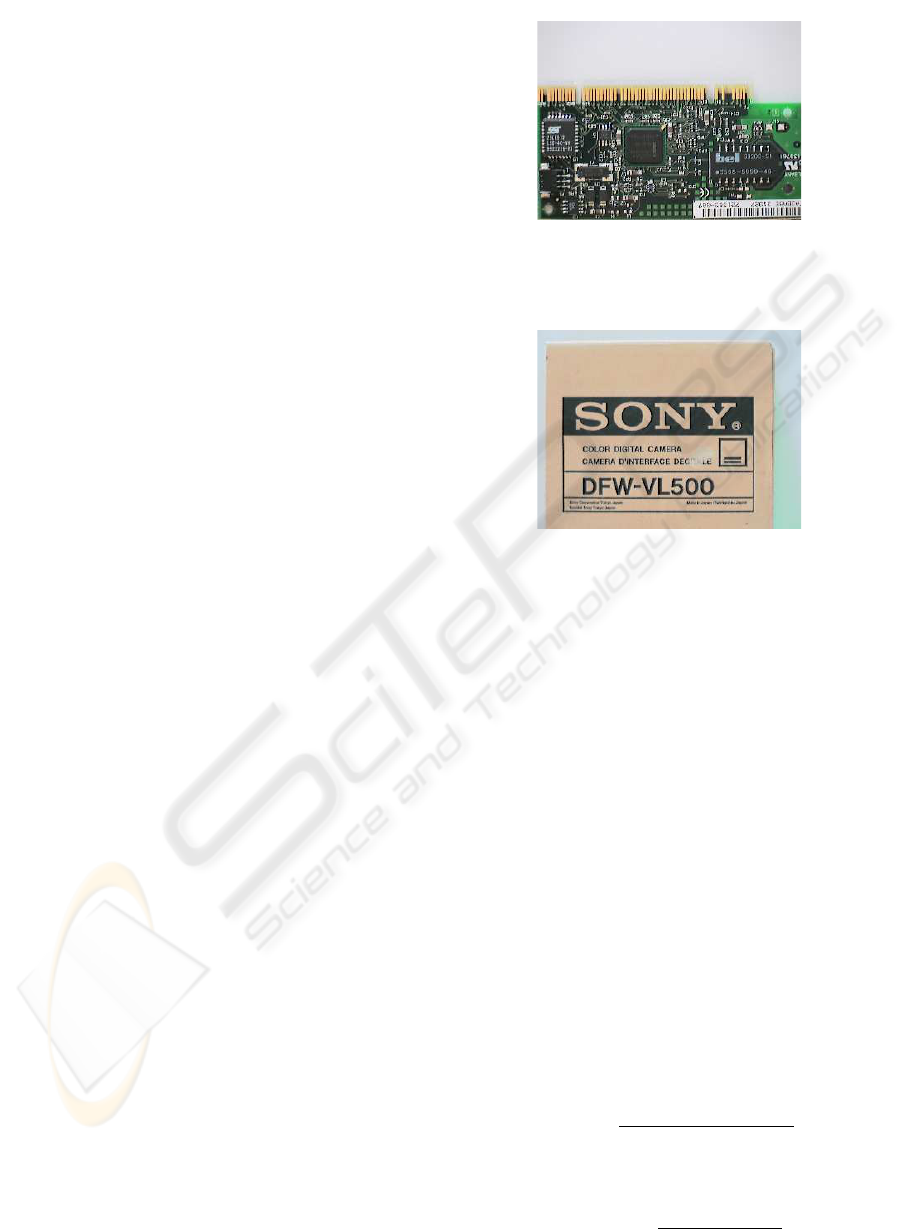
The images were acquired with a Sony DFW-VL500
firewire color camera with a 16x integrated zoom
in an indoor environment and four different settings
were analyzed. The first setting corresponds to a
printed circuit board which yields a planar image with
all the scene elements to the same distance of the cam-
era; we refer to this setting as PCB (Fig. 1). The
second setting is very common in depth from focus
applications where an isolated object appears in the
image, this setting will be refered as Box (Fig. 2).
The third and fourth settings are the ones that we typ-
ically found in a human computer interaction appli-
cation where a person appears either in front of the
camera or in an office enviroment. They will be ref-
ered as Face1 (Fig. 3) and Face2 (Fig. 4).
As the camera has 450 focus positions, 224 im-
ages for each of the previosly described settings were
acquired with a 2 focus position step. For each ac-
quired image the six focus measures were computed
and the criterium to assess the quality of each mea-
sure was the similarity of the resulting curve with an
“ideal” focus curve which exhibits only a sharp peak.
Figure 5 shows the normalized curves of the
Tenengrad focus measure for the four examples. This
0 50 100 150 200 250 300 350 400 450
0.1
0.2
0.3
0.4
0.5
0.6
0.7
0.8
0.9
1
Focus Measure Value
Focus Position
PCB
Box
Face1
Face2
Figure 5: Normalized curves for the Tenengrad focus mea-
sure.
0 50 100 150 200 250 300 350 400 450
0.4
0.5
0.6
0.7
0.8
0.9
1
Focus Measure Value
Focus Position
PCB
Box
Face1
Face2
Figure 6: Normalized curves for the entropy focus measure.
measure gives good results for PCB and Box exam-
ples because in both cases there is a well defined max-
imum at positions 198 and 176 respectively. On the
other hand in the examples Face1 and Face2, the
obtained curve does not show a sharp peak so the
maximum search is more difficult.
Figure 6 shows the normalized curves of the en-
tropy focus measure for the four examples. As it is
shown in the graphics, the behaviour of this measure
is not so good as Tenengrad measure. Entrogy based
measure only gives a good focus curve for the PCB
example with the maximum located at position 216.
For Face1 and Face2 examples the curve increases
its value until it reaches a plateau where a maximum
is really difficult to find.
The results of the SML measure in the four exam-
ples are shown in Figure 7. This measure exhibits a
well defined peak in PCBand Boxwith maxima at po-
sitions 200 and 180 respectively. In relation to Face1
example, we get a curve with with a maximum at 246
although the peak is not so sharp as in PCB and Box
examples. In example Face2 the resulting curve for
the SML measure has a flattened peak with the maxi-
mum located at 368.
ICINCO 2007 - International Conference on Informatics in Control, Automation and Robotics
420
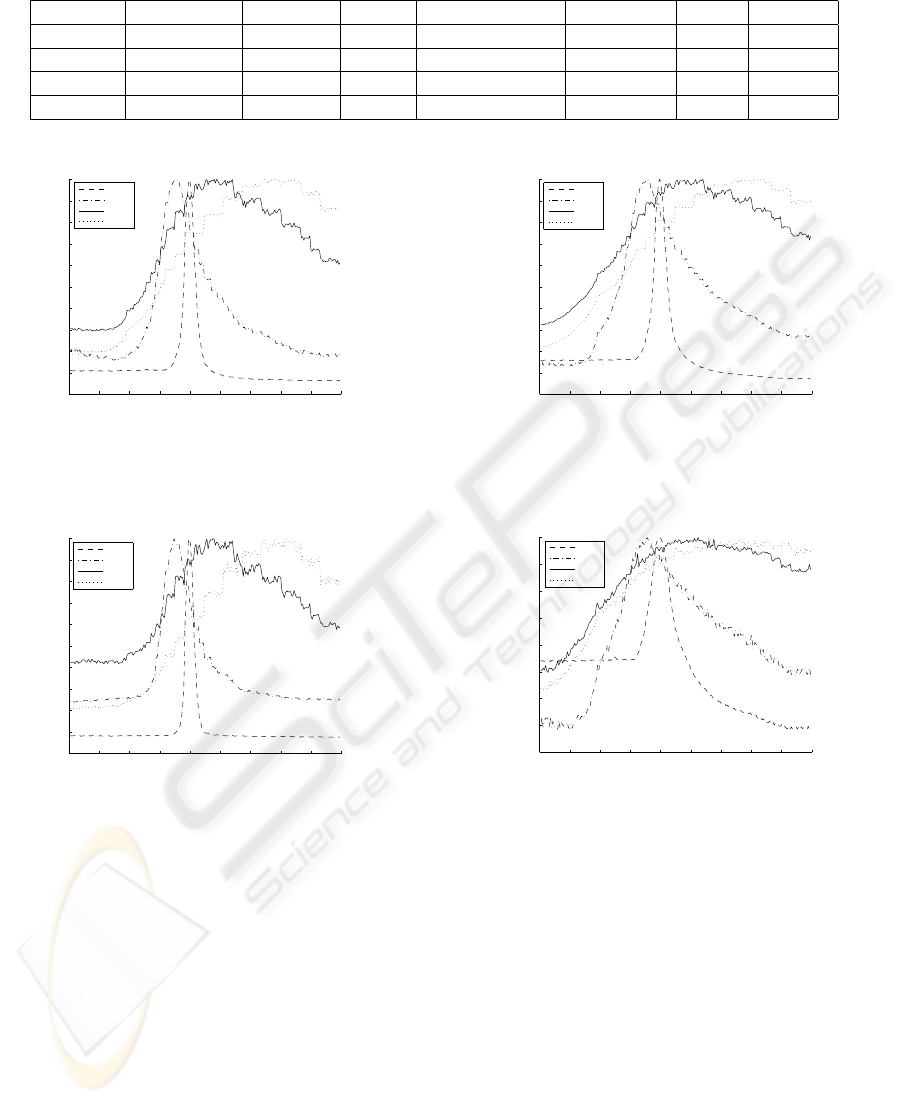
Table 1: Maximum of each focus measure.
Example F
T enengrad
F
Entropy
F
SM L
F
EnergyLaplace
F
Constrast
F
M
Be
Expert
PCB 200 216 200 200 200 200 202
Box 176 176 180 176 280 180 178
Face1 270 290 246 240 272 264 240
Face2 362 108 368 362 334 284 330-370
0 50 100 150 200 250 300 350 400 450
0
0.1
0.2
0.3
0.4
0.5
0.6
0.7
0.8
0.9
1
Focus Measure Value
Focus Position
PCB
Box
Face1
Face2
Figure 7: Normalized curves for the Sum of Modified
Laplacian focus measure.
0 50 100 150 200 250 300 350 400 450
0
0.1
0.2
0.3
0.4
0.5
0.6
0.7
0.8
0.9
1
Focus Measure Value
Focus Position
PCB
Box
Face1
Face2
Figure 8: Normalized curves for the Energy Laplace focus
measure.
Energy Laplace and SML measures are based on
the Laplacian of the image because it gives a high re-
sponse to the higher frequencies in the image. Thus
the results we get with Energy Laplace are very simi-
lar to those obtained with SML measure as it is shown
in Figure 8. For PCB example the position of the max-
imum is the same than in the SML measure. In Box
example the maximum is at position 176 while for the
SML is in position 180, which are very close. The dif-
ference in focus position of this measure and SML in
examples Face1 and Face2 is 6 steps in both cases
that confirms the similar behavior of both measures.
As shown in Figure 9, the measure proposed by
Nanda and Cutler gives similar results to those ob-
0 50 100 150 200 250 300 350 400 450
0
0.1
0.2
0.3
0.4
0.5
0.6
0.7
0.8
0.9
1
Focus Measure Value
Focus Position
PCB
Box
Face1
Face2
Figure 9: Normalized curves for the focus measure pro-
posed by Nanda and Cutler.
0 50 100 150 200 250 300 350 400 450
0.2
0.3
0.4
0.5
0.6
0.7
0.8
0.9
1
Focus Measure Value
Focus Position
PCB
Box
Face1
Face2
Figure 10: Normalized curves for the M
Be
focus measure.
tained with the previously analyzed measures (except
entropy) in examples PCB and Box. For Face1 and
Face2, the results are similar too because in neither
cases a sharpened peak appears at position of maxi-
mum which is located at 272 and 334 respectively.
Finally, the results obtained with the M
Be
mea-
sure are shown in Figure 10. As one of the most re-
cent focus measures it is expected to achieve the best
results in the four settings. However, for the PCB and
Box examples, the obtained results are very similar
to the other measures even worse than more classi-
cal measures as SML or Tenengrad. In Face1 and
Face2, the results are not so good as other measures
because the curves does not exhibit a sharp peak in
the maximum value so more elaborated methods for
COMPARISON OF FOCUS MEASURES IN FACE DETECTION ENVIRONMENTS
421

the maximum location are needed.
The previous analisys only takes into account the
shape of the focus curve but to assess the quality of
the lens position which corresponds to the maximum
it need to be tested by an expert because there is no
possibility to compare with a reference focus mea-
sure. Sun et al. (Sun et al., 2004) propose as reference
to test the accuracy of the compared methods the dif-
ference between the lens position given by the method
and the lens position selected by an expert.
In this work we have followed a similar approach
and for each scenario an expert was asked for getting
the most focused image. The range of focus value
are shown in the column labelled as Expert of ta-
ble 1. To notice that for the Face2 scenario the
range of focus values in which the image is focused is
wider because the person is further and so the depth
of field is larger. Comparing in Table 1, the best focus
value given by each measure and the one selected by
the expert, it is observed that the most accurate mea-
sures are those based on Laplacian as SML and En-
ergy Laplace. The others exhibit a similar accuracy
except Entropy that as in the previous analysis about
the shape of the curve exhibits the worst accuracy.
4 CONCLUSIONS
In this work a comparison of six focus measures have
been carried out to investigate the performance of the
measures in a face detection application. In face de-
tection applications the person, which is the object of
interest, normally is in an office environment so the
obtained curves do not exhibit a sharp peak at one de-
fined focus position. Instead, flattened peaks are ob-
tained which make more difficult to get the best focus
position. From the six compared focus measures, all
of them, except the entropy measure, give very similar
results in non face detection applications. In the two
face detection settings the best results were obtained
with SML and Energy Laplace measures and surpris-
ingly the most recently published measure does not
give as good results as previous ones. So we have
concluded that for face detection applications the best
performance is obtained with Laplacian based mea-
sures but it is necessary to use more elaborated max-
imum finding methods because there does not exist
very sharp peaks in the focus curves. Also, a test
about the accuracy of the focus position was carried
out, using as reference the focus position given by an
expert for each example. The results are very similar
to the previous given as the two most accurate mea-
sures those based on Laplacian and the worst accuracy
the Entropy measure.
ACKNOWLEDGEMENTS
This work has been partially supported by the Spanish
Ministry of Education and Science and FEDER funds
under research project TIN2004-07087.
REFERENCES
Choi, K.-S. and Ki, S.-J. (1999). New autofocusing tech-
nique using the frequency selective weighthed median
filter for video cameras. IEEE Transactions on Con-
sumer Electronics, 45(3):820–827.
Firestone, L., Cook, K., Culp, K., Talsania, N., and Preston,
K. (1991). Comparison of autofocus methods for au-
tomated microscopy. Cytometry, 12:195–206.
Gross, R., Shi, J., and Cohn, J. (2001). Quo vadis face
recognition? - the current state of the art in face
recognition. Technical Report CMU-RI-TR-01-17,
Robotics Institute, Carnegie Mellon University.
Hjelmas, E. and Low, B. K. (2001). Face detection: A
survey. Computer Vision and Image Understanding,
83(3):236–274.
Kehtarnavaz, N. and Oh, H.-J. (2003). Development and
real-time implementation of a rule-based auto-focus
algorithm. Real-Time Imaging, 9:197–203.
Kristan, M. and Pernus, F. (2004). Entropy based measure
of camera focus. In Proceedingsof the thirteenth Elec-
trotechnical and Computer Science Conference ERK,
pages 179–182.
Kristan, M., Pers, J., Perse, M., and Kovacic, S. (2006). A
bayes-spectral-entropy-based measure of camera fo-
cus using a discrete cosine transform. Pattern Recog-
nition Letters, 27(13):1419–1580.
Krotkov, E. (1987). Focusing. International Journal of
Computer Vision, 1:223–237.
Lee, J.-H., Kim, K.-S., and Nam, B.-D. (1995). Implemen-
tation of a passive automatic focusing algorithm for
digital still camera. IEEE Transactions on Consumer
Electronics, 41(3):449–454.
Lee, J.-S., Jung, Y.-Y., Kim, B.-S., and Sung-Jea, K. (2001).
An advanced video camera system with robust AF,AE
and AWB control. IEEE Transactions on Consumer
Electronics, 47(3):694–699.
Nanda, H. and Cutler, R. (2001). Practical calibrations for a
real-time digital onmidirectional camera. In Proceed-
ings of the Computer Vision and Pattern Recognition
Conference (CVPR 2001).
Nathaniel, N., Neow, P., and Ang, M. (2001). Practical is-
sues in pixel-based autofocusing for machine vision.
In Proc. of the 2001 IEEE International Conference
on Robotics and Automation, Seoul, Korea.
Nayar, Shree K.and Nakagawa, Y. (1994). Shape from fo-
cus. IEEE Transactions on Pattern Analysis and Ma-
chine Intelligence, 16(8):824–831.
Park, R. K. and Kim, J. (2005). A real-time focusing algo-
rithms for iris camera recognition. IEEE Transactions
on Systems, Man and Cybernetics, 35(3):441–444.
ICINCO 2007 - International Conference on Informatics in Control, Automation and Robotics
422

Pentland, A., Moghaddam, B., and Starner, T. (1994).
View-based and modular eigenspaces for face recog-
nition. In Proc. of IEEE Conf. on Computer Vision
and Pattern Recognition (CVPR’94), Seattle, WA.
Rowley, H. A., Baluja, S., and Kanade, T. (1998). Neural
network-based face detection. IEEE Transactions on
Pattern Analysis and Machine Intelligence, 20(1):23–
38.
Shirvaikar, M. (2004). An optimal measure for camera fo-
cus and exposure. In Proceedings of the Thirty-Sixth
Southeastern Symposium on System Theory, pages
472– 475.
Subbarao, M. and Tyan, J.-K. (1998). Selecting the optimal
focus measure for autofocusing and depth-from-focus.
IEEE Transactions on Pattern Analysis and Machine
Intelligence, 20(8):864–870.
Sun, Y., Duthaler, S., and Nelson, B. J. (2004). Autofocus-
ing in computer microscopy: Selecting the optimal fo-
cus algorithm. Microscopy Research and Technique,
65:139–149.
Yang, M., Kriegman, D., and Ahuja, N. (2002). Detecting
faces in images: A survey. IEEE Transactions on Pat-
tern Analysis and Machine Intelligence, 24(1):34–58.
Zhao, W., Chellappa, R., Rosenfeld, A., and Phillips, P.
(2003). Face recognition: A literature survey. ACM
Computing Surveys, pages 399–458.
COMPARISON OF FOCUS MEASURES IN FACE DETECTION ENVIRONMENTS
423
