MODELING ON MOLTEN METAL’S PRESSURE IN AN
INNOVATIVE PRESS CASTING PROCESS USING GREENSAND
MOLDING AND SWITCHING CONTROL OF PRESS VELOCITY
Ryosuke Tasaki, Yoshiyuki Noda, Kazuhiko Terashima
Department of Production System Engineering, Toyohashi University of Technology
Hibarigaoka 1-1, Tempaku, Toyohashi, 441-8580, Japan
Kunihiro Hashimoto
∗
, Yuji Suzuki
∗∗
∗
Sintokogio, Ltd., Honohara 3-1, Toyokawa, 442-8505, Japan
∗∗
Aisin Takaoka Co., Ltd., Tennoh 1, Takaokashin-machi, Toyota, 473-8501, Japan
Keywords:
Press casting, Pressure control, Computational fluid dynamics, Modeling, Casting detect.
Abstract:
This paper presents modeling and control of fluid pressure inside a mold in a press casting process using
greensand molding as an innovative casting method. The defect-free manufactures of casting product in the
press process are very important problem. Then, it is made clear that the press velocity control achieves to
reduce the rapid increase of fluid pressure. A mathematical model of the molten metal’s pressure in a casting
mold is built by using a simplified mold and investigated the availability by comparison with the CFD model.
A pattern of the press velocity from the high speed to the lower speed is derived by using the mathematical
model. Finally, the effectiveness of the proposed switching velocity control has been demonstrated through
CFD computer simulations.
1 INTRODUCTION
Recently, an innovative method called the press cast-
ing process using the greensand mold has been ac-
tively developed for improving the productivity by au-
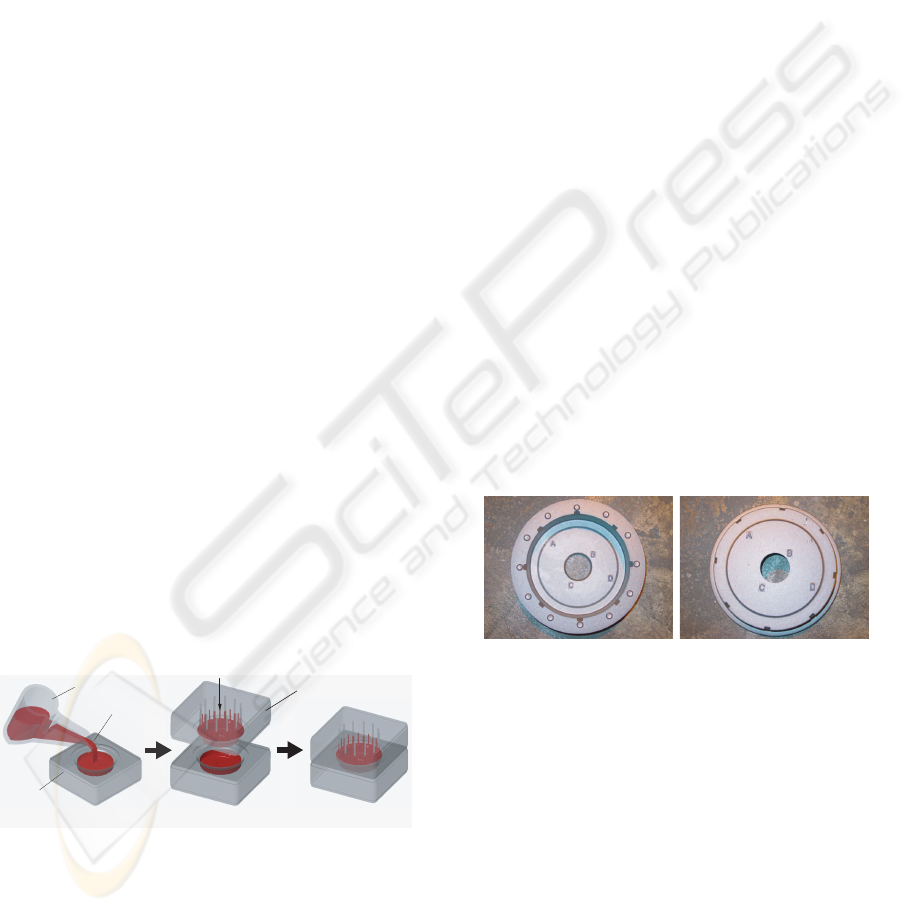
thors group. The casting process is shown in Figure
1. In the casting process, the molten metal is poured
Ladle
Under Mold
Press
Upper Mold
Pouring process
Pressing process
Molten Metal
Figure 1: Press casting process.
into the under mold by tilting the ladle. After pour-
ing, the upper mold is fallen down towards the lower
mold, and pressed. The process enables us to enhance
the production yield rate from 70[%] to over 95[%],
since sprue runner and cup are not required in the cast-
ing plan(Y.Noda et al., 2006). This process is com-
Top surface Under surface
Figure 2: Casting product by an innovative press casting
using greensand mold.
prised of two parts such as a pouring and a pressing
processes. In the pouring part of the casting process,
it is needed to pour the molten metal into the under
mold precisely and quickly, and suppress the splash
of the molten metal in the mold. In the conventional
pouring method, the outflow quantity from the ladle
is larger than the volume required in the actual prod-
uct, and the production yield rate is then decreased.
Pouring controls on the pouring process in the press
casting were studied by past studies(Y.Matsuo et al.,
2006), (Y.Noda et al., 2006).
On the other hand, in the press part, the casting
498
Tasaki R., Noda Y., Terashima K., Hashimoto K. and Suzuk Y. (2007).
MODELING ON MOLTEN METAL’S PRESSURE IN AN INNOVATIVE PRESS CASTING PROCESS USING GREENSAND MOLDING AND SWITCHING
CONTROL OF PRESS VELOCITY.
In Proceedings of the Fourth International Conference on Informatics in Control, Automation and Robotics, pages 498-503
DOI: 10.5220/0001651704980503
Copyright
c
SciTePress
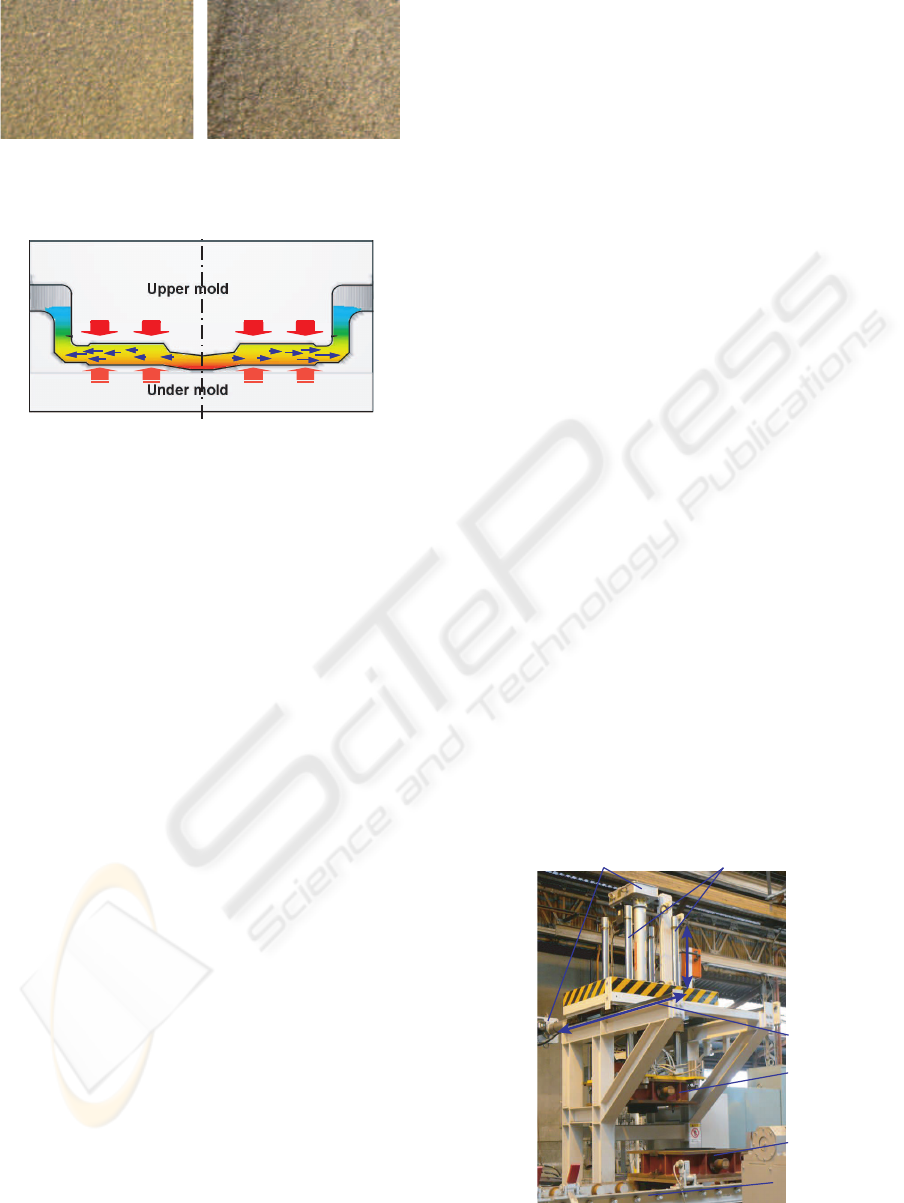
Sound case: v=5[mm/s] Defect case: v=122[mm/s]
Figure 3: Inner surface of products.
Figure 4: Illustrative figure on fluid behavior of molten
metal.
defects are caused by the pattern of press velocity. As
an representative example of casting product with a
press casting process, a brake drum is shown in Fig-
ure 2, where the press velocity is 5[mm/s]. Figure 3
shows the photographs of surface of iron casting pro-
duced by Figure 2. In the high speed press such as
the velocity of v=122[mm/s], a casting product gen-
erates rough surface. This surface defect is called a
metal penetration such that the solidified molten metal
is soaked among the sand particles in the greensand
mold. As seen from Figure 4, this defect is thought to
be the generation of high pressure of fluid in the mold
due to the rapid velocity of press. Whereas, in the case
of slow velocity in the press, a defect of the oxide film
in the surface of products and a defect of void due to
the rapid solidifications are generated. Therefore, the
press velocity control is demanded to adequately sup-
press the fluid pressure in the high speed press.
The pressure control methods have been pro-
posed in the conventional casting method. To re-
alize the high quality product such as spheroidiz-
ing and densification for iron casting, optimal de-
sign of sink head is achieved by using the simulation
analysis on understanding the explicit solidification
property(Louvo et al., 1990). To simulate the fill-
ing behavior of molten metal, the rheological char-
acterization has been experimentally studied by H.
Devaux(H.Devaux, 1986). 3D-visualization technol-
ogy was developed by C. Galaup et al.(C.Galaup and
H.Luehr, 1986), (I.Ohnaka, 2004). In the injection
molding process, the pressure control problem has
been successfully achieved by Hu J, 1994. A model
on PID gain’s selection is proposed for the pressure
control in filling process. Then, the effectiveness of
a mathematical model with the identified the physical
parameters for control performance is verified exper-
imentally(Hu, 1994).
The first keynote on the press casting process
using greensand molding has been published by
Terashima(K.Terashima, 2006). The press casting
process is that the molten metal poured in the un-
der mold is fluidized by the falling down of the up-
per mold(K.Terashima, 2006). The pressure control
by changing the press velocity has not yet been ap-
plied, although its importance has been addressed by
Terashima in the press casting method. Therefore, we
propose to suppress the pressure adequately by con-
trolling the press velocity in the press casting sys-
tem. The pressure of molten metal in the mold must
be detected to control the process adequately. How-
ever, measurement of the fluid pressure is difficult,
and the use of the contact pressure sensor can not
be applied, because the fluid temperature is very high
around about 1400. Then, in this paper, the pressure
is estimated by using the reaction force measured by a
load-cell which is set above the upper mold. A math-
ematical model of the molten metal pressure in a cast-
ing mold is newly given. Based on this mathematical
model, an ideal pattern of press velocity is proposed
to fall down the upper mold rapidly towards the lower
mold with suppressing the fluid pressure.
2 PRESS PROCESS IN PRESS
CASTING SYSTEM
The panoramic photograph of the press casting ma-
Linear guide
Servo motor
Guide cylinder
Under mold
Upper mold
Conveyor line
Figure 5: Press casting machine.
MODELING ON MOLTEN METAL’S PRESSURE IN AN INNOVATIVE PRESS CASTING PROCESS USING
GREENSAND MOLDING AND SWITCHING CONTROL OF PRESS VELOCITY
499
h(t)
Upper mold
Under mold
~
~
M
M
M
U
Load-cell
Guide bar
Molten metal
A
z(t)
M
G
M
U
:Upper mold mass
M
G
:Guide mass
M
M
:Molten metal mass
:Molten metal density
:Molten metal viscosity
g :Gravity acceleration
A :Under surface area of
convex apical part
z(t):Press displacement
gh(t):Pressure head of
convex apical part
Over-flow
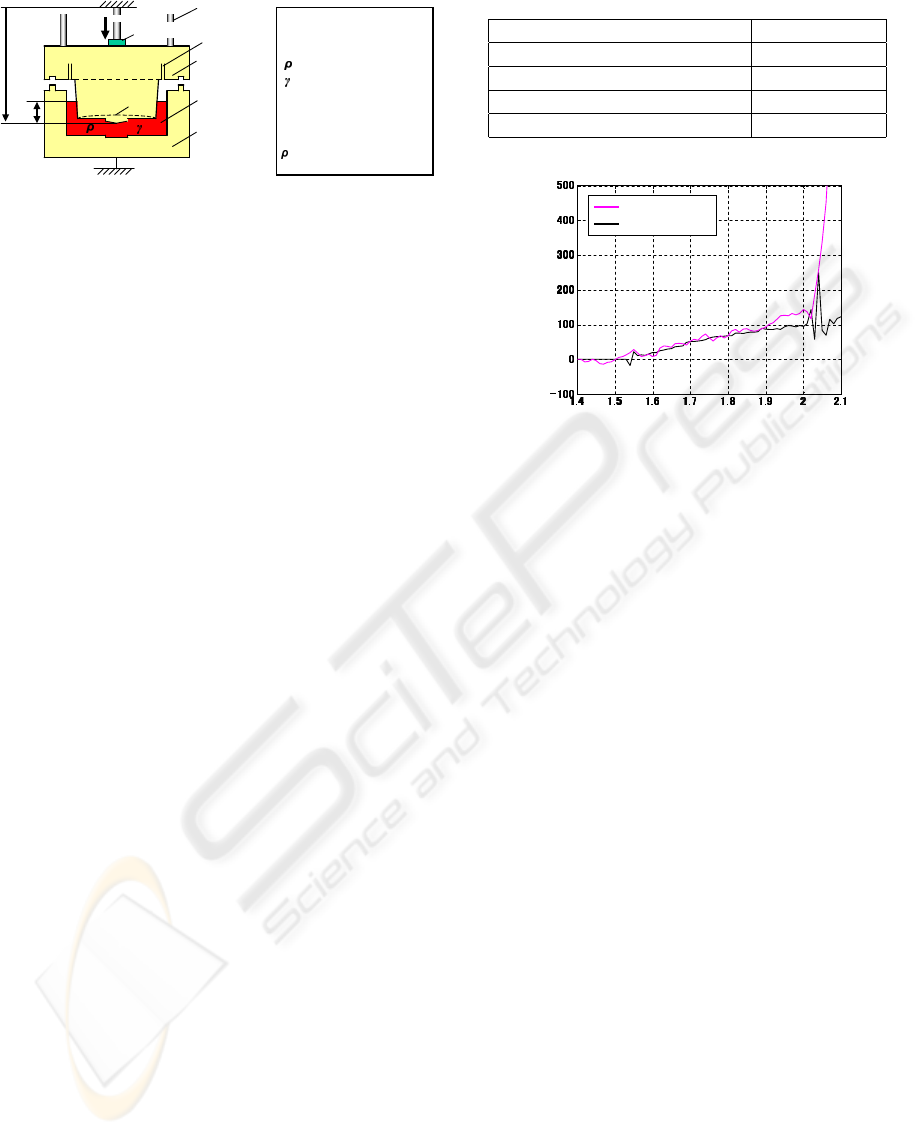
Figure 6: Outline of press process.
chine is shown in Figure 5. Figure 6 shows the il-
lustration diagram of the press casting system. The
molten metal is pressed by making the upper mold
falling down towards the under mold. The upper mold
consists of a greensand mold and a molding box. The
upper mold has several passage parts in the convex
part, which is called the over-flow as shown in Figure
6. The molten metal over the product volume flows
into the over-flow part in the pressing.
The upper mold is moved towards up-and-down
by using the press cylinder. The position of the up-
per mold is continuously measured by an encoder set
in the servo cylinder. The position feedback control
to obtain the desired behavior for the upper mold, is
realized by using the PID controller. Then, the reac-
tion force from molten metal is also measured by the
load-cell installed on the servo cylinder.
3 MODELING OF PRESS
PROCESS
3.1 Pressure Analysis by CFD
Visualization technology for observing time behav-
ior of filling the fluid has been extensively developed.
The pressure of molten metal in the mold during the
press process is investigated by using commercial sci-
entific software of CFD (Computational Fluid Dy-
namics). In this paper, FLOW-3D, a well-known CFD
analysis software designed by FLOW SCIENCE Inc.,
is applied. The filling behavior analysis in press pro-
cess is available by means of an expressive function
of moving obstacle for the fluid.
To investigate the relationship between the load-
cell response in experiments and the pressure behav-
ior of molten metal using CFD, simulations using
CFD and experiments using Figure 6 were conducted.
As an example, simulation and experiment in the con-
ditions of Table 2 were done. Here, the sampling pe-
riod is 0.01[s], and the mesh block width is 2[mm]
in CFD analysis. The relation between the calculated
Table 1: Simulation and experimental condition.
Press velocity; v 30[mm/s]
Pouring fluid mass; M
M
5.37[kg]
Pouring time; T
p
10.1[s]
Pouring fluid temperature; T
M
1405[
◦
C]
Molten metal viscosity; γ 0.00235[Pa·s]
Time [s]
Reaction force [N]
Experiment
CFD simulation
Figure 7: Comparison of reaction force between simulation
and experiment.
pressure P
c
[Pa] and the reaction force F
u
[N] measured
by load-cell is expressed by Eq.(1).
F
u
= AP
c
(1)
, where A[m
2
] in Figure 6 is the under surface area of
upper mold.
The comparative result is shown in Figure 7. In
Figure 7, gray line is experimental result, and black
line is simulation result using CFD. The upper mold
touches at the molten metal in time of 1.52[s]. Con-
cerning the time behaviors, the significant increasing
reaction force appears at the time of about 2.03[s].
This time is approximately equal to the time when the
molten metal flows into the over-flow parts. The high
pressure of molten metal in the mold generates at this
time. Subsequently, in the end period of press, the
feature of the responses is greatly different. This is
due to the gravity release by the upper mold sets on
the under mold.
From Figure 7, the reaction forces measured in
the both of CFD and experiments are thought to be
approximately equal up to the 2.03[s]. Then, it was
confirmed that the pressure calculated by CFD rep-
resented the actual pressure of molten metal in the
mold.
3.2 Modeling with Respect to Pressure
of Molten Metal
The pressure results by CFD analysis in the filling
process well explained experimental results with high
ICINCO 2007 - International Conference on Informatics in Control, Automation and Robotics
500

h(t)
d
1
d
3
d
2
b
1
b
2
b
3
b
4
P
1
d
1
= 0.1970, b
1
= 0.0485,
d
2
= 0.2200, b
2
= 0.0400,
d
3
= 0.2550, b
3
= 0.0590,
d
4
= 0.0080, b
4
= 0.0520. [m]
d
4
P
2
M
h(t)i
(i=1,2,3,4)
h
0
Figure 8: Shape of simplified casting mold shape.
reliability. However, press behavior cannot be calcu-
lated in real-time by the CFD analysis. The online
estimation of pressure in the mold is required in the
press casting system. The CFD is very effective to
analyze the fluid behavior in off-line, and hence it is
useful to predict the behavior and also optimize a cast-
ing plan. However, it is not enough for control design
in real-time, because of calculation time. Therefore,
we need to build a brief model for control design by
using CFD simulation and experiment.
The estimation of the pouring volume is available
by using the position data of the upper mold and es-
timating the contact time between under surface of
the upper mold and the molten metal. They are mea-
sured respectively using the encoder and the load-cell.
Then, to suitably realize the press velocity control
without the excessive pressure, the estimation of pres-
sure behavior is done by using the estimated data of
pouring volume. From this reason, we build a mathe-
matical model of molten metal pressure for the press
velocity.
The mold shape used in authors study has a large
convex parts with cross section of A as shown in Fig-
ure 6. To examine the pressure behavior for the gen-
esis part of defect, a simplified mold shape plumbed
the parts of curve, slope and draft angle for the pri-
mary mold shape. The simplified mold shape is
shown in Figure 8, where b and d mean the height and
the diameter respectively. P
j
(j=1,2) are genesis parts
of defect. The pressure fluctuation in press is repre-
sented by using a pressure model for the ideal fluid
such that the incompressible and nonviscous fluid is
assumed. Here, h(t) in Figure 8 means the fluid level
from under surface of upper mold. The head pressure
P
j
is directly derived from h(t). The press distance
z(t) of upper mold is a downward distance from the
position at the contact time of the poured fluid and
the upper mold. As the press velocity increases, the
dynamical pressure is varied by the effect of the liq-
uidity pressure. Then, the hydrodynamic pressure for
peak fluid height area is involved in P
j
. Therefore,
pressure P
b
in P
j
is consisted of head and hydrody-
namic pressure, and is represented by Eq.(2).
P
b
(t) = ρgh(t) +
ρ
2
˙
h(t)
2
(2)
The flow passage areas have three situations,
case 1: π(d
2
− d
1
)
2
/4, case 2: π(d
3
− d
1
)
2
/4 and
case 3: nπd
2
4
/4, where the number n of the over-flow
as diameter d
4
is equal to twelve. Figure 8 represents
case 2. The following equations represent the fluid
level variation in the each situation, and they are sim-
ply derived by assuming the incompressible fluid.
h(t) =
case 1 : h(t) < h
sw1
,
d
2
2
d
2
2
−d
2
1
z(t)
case 2 : h
sw1
≤ h(t) < b
1
,
1
d
2
3
−d
2
1
(d
2
3
z(t) + d
2
1
h
sw1
)
case 3 : b
1
≤ h(t),
1
nd
2
4
{d
2
3
z(t) + (nd
2
4
− d
2
3
)b
1
}
(3)
, where h
sw1
and b
1
represent the threshold fluid level
of h(t) on case 1case 2, case 2case 3 respectively.
h
sw1
is expressed as follows. And,
h
sw1
=
d
2
2
d
2
1
(b
2
− h
0
) (4)
, where h
0
means the initial fluid height before the
upper mold touches to the molten metal. When the
fluid height h(t) equals to h
sw1
, the equation of h(t)
changes from case 1 to case 2. Then, when h(t)
reaches to the height of b
1
, h(t) of Eq.(3) is changed
from case 2 to case 3. As described the above, the
pressure response for press velocity is determined
from the both of initial fluid height and mold shape.
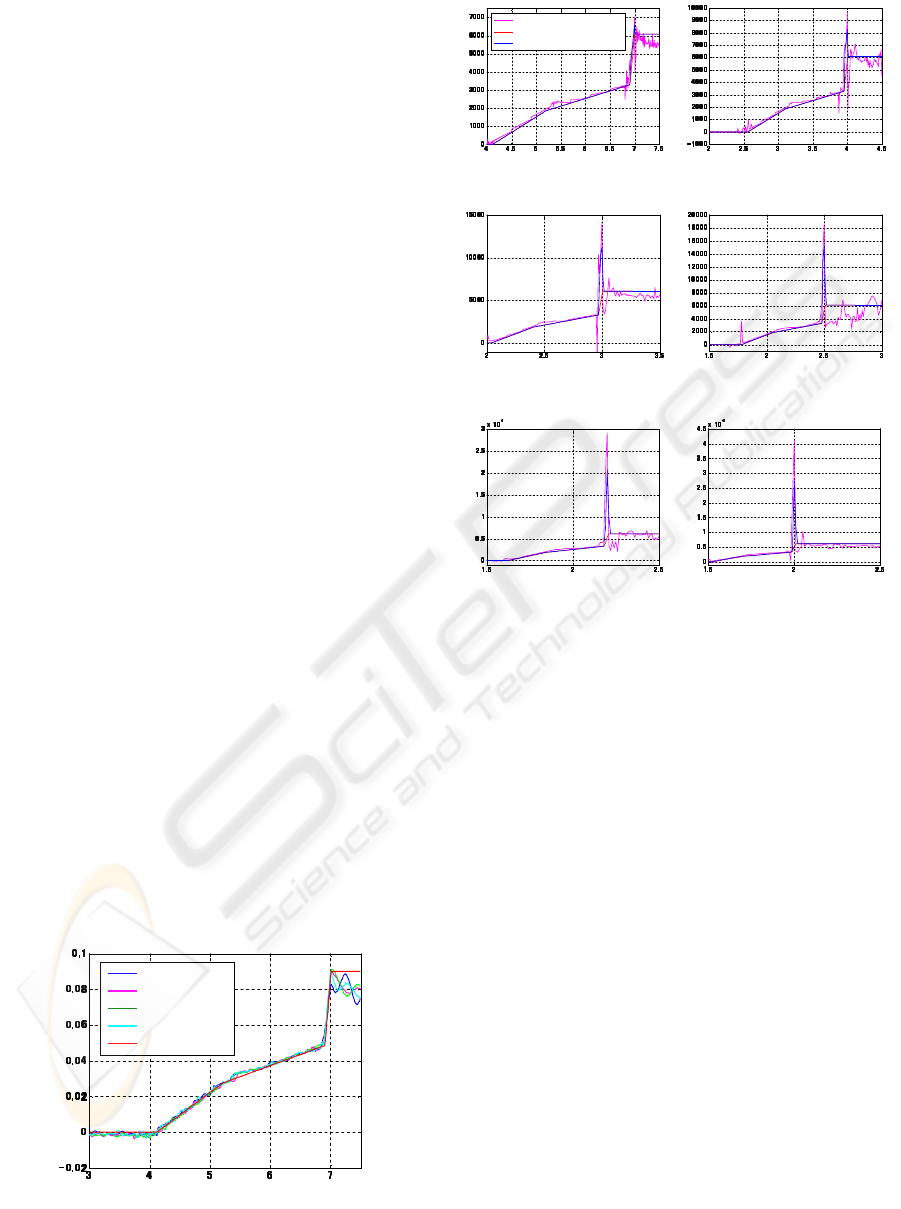
Eq.(2) or the mathematical pressure model of the
molten metal in a mold is validated from the fluid be-
havior analysis by FLOW-3D on the filling in a press.
Comparison of ideal fluid height h(t) in a simplified
mold and h(t) in CFD simulation, is shown in Fig-
ure 9. As the CFD analysis results, height behavior of
M
h(t)
i
(: the measurement points of the over-flow) in
Figure 8. The fluid height h(t) for the parts of over-
flow is obtained. The press velocity is set as 5[mm/s].
When the ideal(incompressible and nonviscous)
fluid height becomes steady-state response, the height
in CFD results show the lower value of h(z) due to
the compression of the fluid by a gravity force. Next,
MODELING ON MOLTEN METAL’S PRESSURE IN AN INNOVATIVE PRESS CASTING PROCESS USING
GREENSAND MOLDING AND SWITCHING CONTROL OF PRESS VELOCITY
501
pressure in the generation area of metal penetration
defect is compared with a simplified mold.
The pressure behavior of P
2
in Figure 8 as the
CFD result is shown, because the pressure response of
P
2
is approximately equal to response of P
1
, and area
of P
2
is generation point of metal penetration defect.
As comparing the results between CFD and a simply
mathematical model, the pressure responses in press
velocities of 5∼30[mm/s](5[mm/s] steps) are shown
in Figure 10. The pressure performances of ideal fluid
in the mathematical model are in excellent agreement
with CFD analysis. Therefore, the pressure expressed
by Eq.(2) is thought to be validated for the pressure of
molten metal.
4 PRESSURE CONTROL
In this section, the simulation for suppression of rapid
increase of pressure is executed using CFD analy-
sis. It is already confirmed that the defect of metal
penetration in a press process appears around over
80[mm/s]. In the case of over 80[mm/s], the de-
fect is caused by rapid increase of pressure, when the
molten metal flows arrives at the over-flow. Then, the
switching action of press velocity at the time of the
over-flow is started. The switching time is derived
by using Eq.(3) and Eq.(4) of a simplified mold. In
this pressure suppression simulation, the initial press
velocity sets at 100[mm/s], and switches to the ve-
locity of 10[mm/s] at the switching time of 1.29[s],
where the initial fluid height of pouring outflow sets
at 0.0192[mm]. Then, the calculated switching time is
0.14[s]. This switching time means the elapsed time,
since the molten metal contacts with the under sur-
face of the upper mold. The temperature of the molten
metal in the mold is assumed to be about 1300[s].
The simulation results for pressure suppression in
press process is shown in Figure 11. As seen from
Time [s]
Level of Fluid [m]
Math. model
CFD:M
h(t)4
CFD:M
h(t)3
CFD:M
h(t)2
CFD:M
h(t)1
Figure 9: Fluid level in the case of v=5[mm/s].
Time [s] Time [s]
Pressure [Pa]
Pressure [Pa]
Head Pressure of ideal fluid
CFD Simulation
Eq.1: Math. model
(i) v=5[mm/s] (ii) v=10[mm/s]
Time [s]
Pressure [Pa]
Time [s]
Pressure [Pa]
(iii) v=15[mm/s] (iv) v=20[mm/s]
Time [s]
Pressure [Pa]
Time [s]
Pressure [Pa]
(v) v=25[mm/s] (vi) v=30[mm/s]
Figure 10: Simulation Results of pressure behavior.
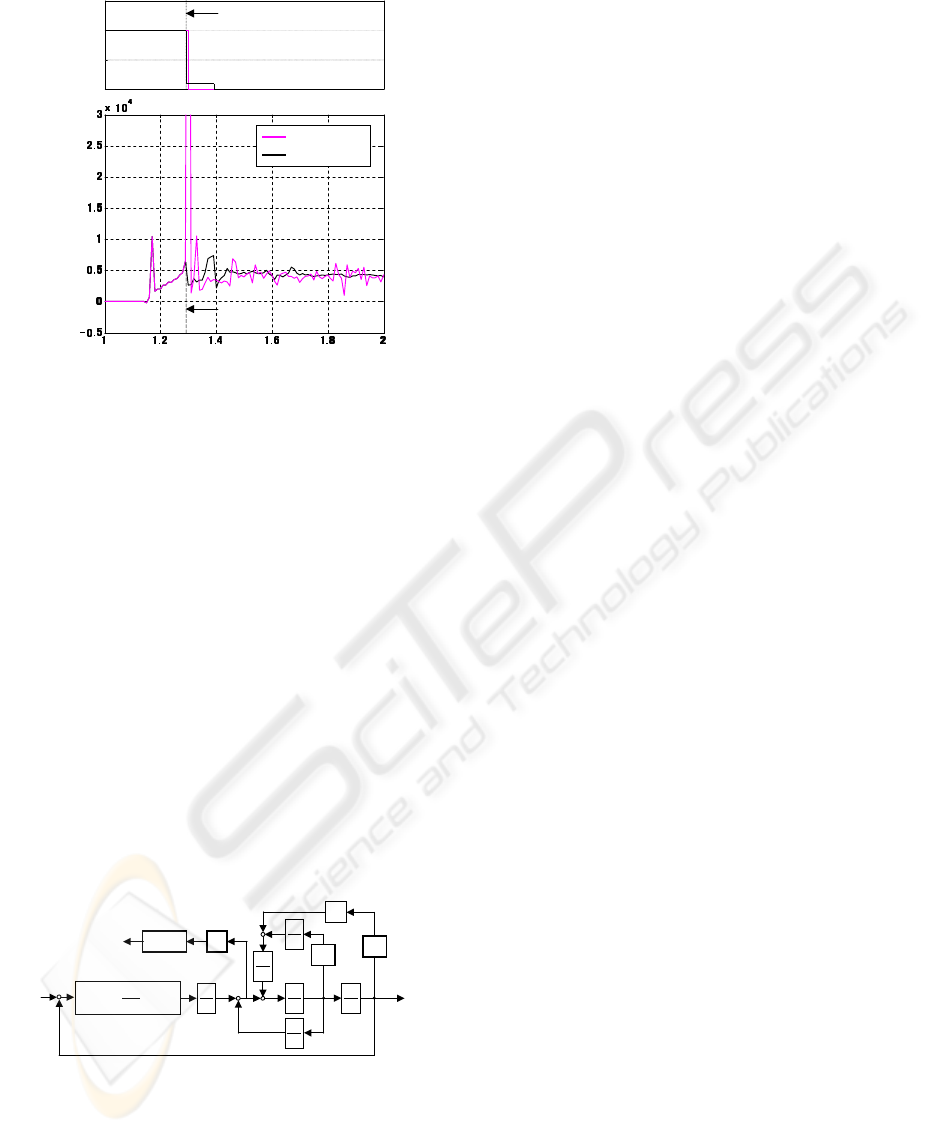
Figure 11, the fluctuation of pressure behavior us-
ing the switching control of velocity is dramatically
smaller than that of non-switching case. In the time
of 1.17[s], rapid excessive rise pressure is caused by
the contact of molten metal with upper mold.
In the case of the constant velocity of 100[mm/s],
the pressure peak value of 304080[Pa] is observed at
the time of the over-flow. As seen from Figure 11, us-
ing the velocity switch from high-speed to low-speed
at the specified time, rapid increase of pressure was
drastically reduced. Then, press process time on this
switch velocity is approximately equal to the time in
press velocity of 80[mm/s] (time lag +0.015[s]). Ve-
locity of 80[mm/s] is high speed press, and the defect
of metal penetration is caused by high pressure due
to this press velocity. By using the velocity switch
from high speed to low speed, the press process of
suppressing the pressure is realized in short time.
At this time, the control of press velocity pattern
is decided by switching velocity obtained using tried
and error method. In the near future, the newly pro-
posed pattern of press velocity must be obtained by
the optimal decision for the switching velocity. Fur-
thermore, its validity must be demonstrated by actual
ICINCO 2007 - International Conference on Informatics in Control, Automation and Robotics
502
Time [s]
Pressure [Pa]
Non-control
Controlled
Switching time of velocity
0
00
0
50
5050
50
100
100100
100
150
150150
150
v
[mm/s]
high speed
low speed
Switching time
Figure 11: FLOW-3D simulation results of pressure control
using switching of velocity.
experiments.
The molten metal in a mold is pressed by the upper
mold by means of the position feedback control sys-
tem using PID controller. The dynamical and static
pressures are added as the disturbance elements in the
middle of press process. In the near future, we ad-
vance the implementation using this pressure control
system. Here, Figure 12 shows the block diagram of
press casting system, where R
Fout
means the reaction
force from a load-cell. And, z
in
and z
out
are respec-
tively reference and output position of the upper mold.
M is total mass of the upper mold mass and the cylin-
der guide mass. W
1
and W
2
show the relation as fol-
lows.
W
1
: z(t) −→ h(t), W
2
: ˙z(t) −→
˙
h(t)
2
(5)
K
P
(1+ +T
D
s)
1
T
1
s
1
s
1
T
R
Fout
+
-
+
-
+
+
z
in
z
out
M
1
T
i
s
Filter
Moving-average
-
-
Z
・
・・
・
Z
・
・・
・・
・・
・
W
1
PID controller
A
M
ρ
ρρ
ρ
g
W
2
2
ρ
ρρ
ρ
Position
reference
Position
output
Reaction
force
Figure 12: Block diagram of press control system in a press
casting method using greensand molding.
5 CONCLUSION
In this paper, in order to realize the pressure control by
controlling a press velocity, a design method of press
velocity pattern for high speed press control with the
reduction of rapid increase of pressure inside a mold
has been proposed. Then, a mathematical model for
the pressure of the molten metal in a mold was built.
This model showed its effectiveness by using CFD
analysis. Next, a switching pattern of press velocity
from the high speed to low speed was derived from the
simplified mold obtained to reduce the rapid increase
of pressure. Using the obtained velocity pattern, the
press control simulation has been done by CFD anal-
ysis. Good control results have been performed by the
proposed method.
REFERENCES
C.Galaup, U. and H.Luehr (1986). 3d visualization of
foundry molds filling. In Proc. of 53rd International
Foundry Congress, Prague (Czech), sep., pp. 107-115.
H.Devaux (1986). Refining of melts by filtration. a water
model study. In Proc. of 53rd International Foundry
Congress, Prague (Czech.), pp. 107-115.
Hu, J, V. J. H. (1994). Dynamic modeling and control of
packing pressure in injection molding. In Journal of
Engineering Materials and Technology, vol. 116, No.
2, pp. 244-249.
I.Ohnaka (2004). Development of the innovative foundry
simulation technology. In Jornal of the Materials Pro-
cess Thchnology,’SOKEIZAI’, vol. 45, No. 9, pp. 37-
44.
K.Terashima (2006). Development of press casting process
using green sand molding for an innovative casting
production. In Proc. of the 148th Japan foundry Engi-
neering Society meeting, Osaka (Japan), No. 141, pp.
146.
Louvo, A., Kalavainen, P., Berry, J. T., and Stefanescu,
D. M. (1990). Methods for ensuring sounds sg iron
castins. In Trans. of American Foundry Society, vol.
98, pp. 273-279.
Y.Matsuo, Y.Noda, and K.Terashima (2006). Modeling
and identification of pouring flow process with tilting-
type ladle for an innovative press casting method us-
ing greensand mold. In Proc. of 67th World Foundry
Congress, Harrogate (United Kingdom), pp. 210/1-
10.
Y.Noda, S.Makio, and K.Terashima (2006). Optimal se-
quence control of automatic pouring system in press
casting process by using greensand mold. In Proc.
of SICE-ICASE International Joint Conference, Busan
(Korea), pp. FE06-4.
MODELING ON MOLTEN METAL’S PRESSURE IN AN INNOVATIVE PRESS CASTING PROCESS USING
GREENSAND MOLDING AND SWITCHING CONTROL OF PRESS VELOCITY
503
