
FAST SPOT HYPOTHESIZER FOR 2-DE RESEARCH
Peter Peer and Luis Galo Corzo
CEIT and Tecnun (University of Navarra), Manuel de Lardizabal 15, 20018 San Sebastian, Spain
(P.P. is now with the Faculty of Computer and Information Science, University of Ljubljana
Slovenia, and L.G.C. is with the Asiris Vision Technologies, Astigarraga, Spain)
Keywords:
Image analysis, two-dimensional gel electrophoresis, segmentation.
Abstract:
Two-dimensional gel electrophoresis (2-DE) images show the expression levels of several hundred of proteins
where each protein is represented as a blob shaped spot of grey level values. The spot detection, i.e. segmen-
tation process has to be efficient as it is the first step in the gel processing. Such extraction of information is
a very complex task. In this paper we propose a real time spot detector that is basically a morphology based
method with use of seeded region growing as a central paradigm and which relies on the spot correlation
information. The method is tested on gels with human samples in SWISS-2DPAGE (two-dimensional poly-
acrylamide gel electrophoresis) database. The average time to process the image is less than a second, while
the results are very intuitive for human perception and as such they help the user to focus on important parts
of the gel in the subsequent processing. In gels with less than 50 identified spots as proteins (proteins that
compose a proteome) in the mentioned database, the algorithm detects all obvious spots.
1 INTRODUCTION
Computer vision is a research line which tries to ex-
tract as much information from images as possible.
Biomedical image analysis continues to be an active
area of research, with many encouraging results, but
also with a number of difficult problems still to be ad-
dressed (Duncan and Ayache, 2000).
Two-dimensional gel electrophoresis (2-DE) is
one of the methods able to separate thousands of pro-
teins (Ong and Pandey, 2001). Different cell sam-
ples can exhibit even more than 2,000 proteins. On
such a 2-D gel image, two coordinates character-
ize each protein: its isoelectric point and its mole-
cular weight. Along one dimension, proteins are
sorted electrophoretically according to their pH gra-
dient. They stabilize at points where their net charge
is zero. Along the other dimension, proteins sepa-
rate according to their molecular weight. Thus, the
isoelectric point and the molecular weight uniquely
identify a protein spot in a gel. The separated pro-
teins can be stained with different dyes so that they
are amenable to imaging. The gels are scanned and
normally stored in a database. The process, though
lengthy and subject to enormous experimental un-
certainty, is still much cheaper than other competing
technologies.
The first image in Figure 1 (neglect the annotated
crosses) shows a typical image of a 2-D gel. Just by
glancing at it, the reader can imagine how hard a task
it is for any automated algorithm to accurately iden-
tify hundredsof protein spots among the various kinds
of noise, and also to compare and match proteins over
several gels when presented with multiple copies of
gels made from similar cell samples.
There is a critical need for image analysis that
will enable accurate, rapid and reliable spot detec-
tion (Mahon and Dupree, 2001). The spot detection,
i.e. segmentation, process has to be efficient as it is
the first step in the gel processing. Namely, inaccu-
rate spot detection has clear ramifications for the spot
matching process. The segmentation process is par-
ticularly dependent on the staining process (Cutler et
al, 2003). Therefore, a spot detection algorithm with
generic applicability must be capable of effectively
processing a wide range of gels.
In this paper we present a fast spot hypothesizer
for 2-DE research. The user does not have to set any
284
Peer P. and Galo Corzo L. (2007).
FAST SPOT HYPOTHESIZER FOR 2-DE RESEARCH.
In Proceedings of the Second International Conference on Computer Vision Theory and Applications - IFP/IA, pages 284-289
Copyright
c
SciTePress

parameters in order to segment the image. All the
parameters are automatically evaluated from the input
image itself. The goal of the algorithm is to present to
the user possible spot hypotheses (each spot detection
algorithm actually tries to do exactly this) and in this
way help the user in subsequent gel processing steps.
Before we go to the explanation of our algorithm,
let us first take a look at the basic approaches to spot
detection: Edge detection algorithms are traditionally
used in such scenarios (Appel et al, 1997; Lemkin
and Lipkin, 1983). Mathematical morphology based
methods are also widely used (Cutler et al, 2003;
Horgan and Glasbey, 1995; Vincent, 1993). Popu-
lar methods include watersheds by immersion (Vin-
cent and Soille, 1991), marker based watersheds (Vin-
cent, 1993) and H-domes method (Horgan and Glas-
bey, 1995). The scale space blob detection method
can helps us to select the markers (Lindeberg, 1998;
Sporring et al, 1997), which is seldom trivial. Our al-
gorithm is basically a morphology based method with
use of seeded region growing as a central paradigm,
which is a version of a watershed technique (Russ,
1995).
2 MATERIALS AND METHODS
2.1 Algorithm
In a recognition system a preprocessing step to seg-
ment the pattern of interest from the background,
noise etc. usually precedes (Jain et al, 2000) the ac-
tual recognition process and for the current task this
is no exception. 2-DE images show the expression
levels of several hundred of proteins where each pro-
tein is represented as a blob shaped spot of grey level
values. The segmentation task at hand consists of a
separation of the image into what is background and
what are spots and the challenging part are the cases
of overlapping spots, varying background and a high
level of noise in the images.
Namely, gel images are normally very noisy, so
the first step in the algorithm is to reduce the influ-
ence of noise on the subsequent processing. The in-
put image is thus first processed with a Median filter
(Russ, 1995). The 3×3 window that is used inside
its implementation successfully removes salt and pep-
per noise (Russ, 1995) and only softly smooths the
image, while preserving edge information. In other
words, it eliminates isolated pixels and gently blurs
spot shapes, but enhances edges. Filtering is one way
to address the problem of noise. The second one is
by reducing the image size. By testing our algorithm
on our developmental set of images (different image
size, different dye etc. as in the testing set, which con-
sist of gels with human samples in SWISS-2DPAGE
(2-D polyacrylamide gel electrophoresis) database;
http://www.expasy.org/ch2d/ (Hoogland et al, 2000)),
we noticed that processing of first filtered and then
downsized images gave the best results. Therefore,
after filtering, the input image is downsized to the
approximate width of 500 pixels (with maintained
aspect ratio). In this way we smooth the spots a
bit more, eliminate some remaining Gaussian noise
(Russ, 1995) and also speed-up next steps of the algo-
rithm. In the process of noise reduction we conform
to the rule that in any fitting or smoothing operation
the window size has to be smaller than the features of
interest (Russ, 1995). Thus, in this step we reduce the
noise and end up with more compact representation
of spots.
The next step is to dynamically identify the back-
ground. This is achieved by applying a two-step Otsu
thresholding technique (Otsu, 1979). The input to
Otsu thresholding technique is a histogram of the in-
put image, which is then divided in two classes and
the inter-class variance is minimized. Since a num-
ber of spots in the gel image are weakly expressed,
we soften the border between the two classes, namely,
spots and background, by applying Otsu technique in
two steps. First we calculate the basic threshold and
then this value is used to calculate the new, soften
threshold based only on pixels in the image that are
lighter then the calculated threshold. This dynami-
cally obtained global threshold is then used to elimi-
nate the background. For more details about the tech-
nique is (Otsu, 1979).
To identify spot hypotheses, we interpret the in-
tensity as the third dimension information in the in-
put image. We employ another operator in the 3×3
window size to identify local peaks. The peak is es-
tablished if the pixel in the middle has the same or
darker value as all surrounding, neighboring pixels.
Generally, this operator is called 8-neighborhood fil-
ter (Russ, 1995). Giving the pixel the possibility to be
of the same value as the neighboring pixel has two
advantages. First, saturated spot peaks, i.e. spots
with flattened peaks, are detected. The second one ad-
dresses a common problem in the spot detection – a so
called shoulder problem. A shoulder in the context of
spot detection can be described as two merged spots
with one peak higher then the other and no lighter
pixel values in comparison to the small peak between
the peaks in question. In our case, if there are at least
two pixels of the same intensity in this small peak,
this so called shoulder, we detect it and treat it as a
possible spot. Note that this definition of a shoul-
der is a simplification of a generic definition, while

one spot can also be integrated inside the other spot.
Such problems are normally addressed by paramet-
ric spot modeling with Gaussian, diffusion or mixture
spot model (Bettens, 1996; Rogers et al, 2003).
Now that we have the information about peaks, we
can correlate them in order to investigate spot sizes.
But first we have to find the center of mass of each
peak as they could be saturated, i.e. a region big-
ger than one pixel can be labeled as peak. Normally,
each spot is, among other information, represented
by its x and y coordinate of the peak (Taylor et al,
2003). In order to do this, we employ seeded region
growing, a version of a watershed technique (Russ,
1995). A seed can be the first pixel in the peak and
we recursively visit all the pixels in the peak region.
In this way we calculate for each peak its center of
mass. While visiting all the pixels in the region, we
also gather other information, i.e. moments, like the
size of the bounding box and the number of pixels in-
side the region. This information will be used after
the spot detection to make the hypotheses about spots
and their relations on the higher level. We get back to
this in the continuation of the paper. For more details
about the seeded region growing method see (Russ,
1995).
The first step towards establishing correlation of
spots is to find the nearest neighbor for each iden-
tified peak. For this task Euclidean distance (Russ,
1995) seems the most logical choice. For each near-
est neighbor we also calculate its direction, which is
again something that can be used in the subsequent
processing.
The basic correlation information suggests the re-
gion for each peak in which the whole spot should
lie. The distance between the peak in question and
its nearest neighbor determines the radius around the
peak in which the spot should appear. Inside of each
of such regions we basically do the following: we use
two-step Otsu technique locally in the region (on the
image from which we eliminated noise) to determine
the local sub-region of the spot and then grow the spot
inside obtained sub-region from the peak with a shape
constraint (the details are given in the continuation).
To determine the sub-region of the spot, we in
this case employ only the second step of our two-step
Otsu technique, as the peak value is used instead of
the threshold that we would obtain in the first step.
In this way we eliminate the influence of the nearest
neighbor that is darker than the peak. After the lo-
cal threshold is obtained, only the pixels with darker
intensity than the threshold and pixels with lighter or
equal intensity than the peak in the region are kept.
Thus, we define a sub-region, which should contain
the spot. For subsequent processing, i.e. for steps af-
ter spot detection, after establishing spot hypotheses,
we can collect similar information about this region
as for the peak region, plus other moments, like the
power of the region, its orientation and semi-major
axis (Russ, 1995).
One of the commonly used descriptors of the spot
suggested in PEDRo (Proteomics Experiment Data
Repository) model (Taylor et al, 2003) is also spot
radius. Fact is also that the radius is the ideal 2D de-
scriptor for the ideal spot and it enables better visu-
alization and interpretation for humans. In the light
of this, we grow the spot from the peak in the calcu-
lated sub-region with a circular constraint. Thus, we
again use seeded region growing, a version of water-
shed technique, but now the implementation is done
in the iterative manner, each time adding a circle of
pixels around the peak until all the pixels are in the
defined sub-region (Russ, 1995).
The pseudo-code for the steps in the proposed al-
gorithm are as follows:
begin
RemoveNoise();
FindBackground();
FindPeakRegions();
CalculatePeakMoments();
FindNearestNeighbors();
for each peak in its neighborhood do
FindLocalBackground();
GrowSpot();
end
When all the peaks are processed in this way, we
end up with the segmented image and a linked list of
information about each spot. For subsequent process-
ing we add one more information: the difference be-
tween the peak intensity and the average intensity of
pixels on the border of the circular description of the
spot. This gives us a perspective on the height of the
spot and could be a valuable information for instance
in the elimination of non-spots. The segmented im-
age can now be superimposed over the original im-
age with different degree of blending in order to help
the user to focus on important parts of the gel for its
subsequent processing. Blending can be implemented
with a slider that blends the images based on the po-
sition of the handle on the slider, where each extreme
of the slider represents one image, original and seg-
mented. In this way the segmentation results become
even more intuitive for human perception (see Figure
1).
2.2 Evaluation Methodology
In order to build a system that can succeed in a realis-
tic environment, certain simplifications and assump-

tions about the environment and the problem domain
are generally made. The use of a priori information is
critical. Thus, the algorithm was first sketched based
on the gel properties. Then designed, with no internal
parameter tuning as the ability of the system to dy-
namically adapt to the changing environment is also
important, and then tested! At the design time only
two small crops from one differential proteomics ex-
periment were used to visually contrast the results
to our expectations. Our expectations were actually
a ground truth manually marked spots to which we
contrasted the results of each step of the algorithm.
This was done in order to prove the correctness of our
sketch of the algorithm. The crops were from the gels
in which a mouse liver sample was run with comassie
blue staining.
Different laboratories have somewhat different
opinions about different dyes. What we normally do
is use fluorescent dye for visualization. We see co-
massie blue as a very useful dye for spectrometry
analysis but worse for image analysis, because some-
times there are discrepancies to select a correct spot.
On the other hand, the normal process in SWISS-
2DPAGE database, on which our algorithm is tested,
is to produce a silver stained gel as the reference.
They use Melanie software (Appel et al, 1997) to
detect spots and before counting the spots they also
manually edit them with the software. Note that this
is quite a normal procedure after the spot detection to
eliminate/add certain spots for subsequent processing
of gels. Then successive experiments provide some
spot identifications after spot cutting. In their case,
protein visualization is generally with comassie blue
dye. That is why some spots may have been iden-
tified and seen in the comassie blue stained gel, but
not visible in the reference silver stained gel. This re-
flects in the fact that some crosses that mark identified
proteins in the database are superimposed on the im-
age where there is ’nothing’ beneath them in the ref-
erence gel. The matching between both images (silver
versus comassie) is again done with Melanie software
after manual correction, thus positions should be al-
most ‘exact’.
Unfortunately, we cannot simply count true posi-
tives (real spots), false positives etc., since the ground
truth information is not available. Moreover, when it
comes to the human factor such information is very
subjective and varies even if the same person tries to
provide this information at different occasions (e.g.
try to mark the same image after one month and com-
pare the markings).
Based on these facts we shaped our expectations,
criteria and wishes for the evaluation of the algo-
rithm: To be as objective as possible, we contrasted
our results with the results published about the
content of SWISS-2DPAGE database. Namely,
we compared our results, obtained with applying
our method to the gels with human samples in the
database, with the reported number of detected
spots and the number of identified spots in the gels
with less than 50 identified spots (Hoogland et al,
2000) (http://www.expasy.org/ch2d/relnotes.html).
We knew that our algorithm should be very fast
on nowadays standard personal computer; that we
don’t manually edit the results, while they did; that a
different dye will be used as in the design examples;
that some crosses that mark identified proteins in the
database are superimposed on the image where there
is ’nothing’ beneath them in the reference gel.
In the light of this, we expected that the number of
detected spots would vary from the published num-
bers, even drastically in some cases. But we hoped
that the difference will be as small as possible, that
we will detect more spots in average, revealing more
possible spot hypotheses and, most importantly, that
we will detect all obvious identified spots as this in-
formation is the best ground truth available, giving the
real proteins, the proteome.
3 RESULTS AND DISCUSSION
The average speed of processing a gel in the data-
base was really high. It took only 0.855 of a second
per gel on a single processor personal computer (In-
tel Pentium IV 3.0GHz). The tests were performed
in MS Visual Studio C++ Debug mode, which is ap-
proximately 2.3 times slower than Release mode. In
SWISS-2DPAGE database there are 17 2-DE images
with quite a big pH range: from approximately 3.5–
10 on the big end to 3.9–7.5 on the small end. Most of
them have the range of the former. This informationis
very important since with bigger range we get lower
resolution of proteins and consequently the detection
of spots is harder.
Table 1 gives the details about the algorithm per-
formance on each gel. The abbreviations used in the
table are the same as in SWISS-2DPAGE database:
CEC, colorectal epithelia cells; CSF, cerebrospinal
fluid; DLD1, colorectal adenocarcinoma cell line;
ELC, erythroleukemia cell line; HEPG2, hepatoblas-
toma carcinoma derived cells; HEPG2SP, hepatoblas-
toma carcinoma derived cell line secreted proteins;
HL60, promyelocytic leukemia derived cells; RBC,
red blood cells; U937, macrophage like cell line. In
11 out of 17 cases we detected more spots as reported
on SWISS-2DPAGE web portal and also in (Hoog-
land et al, 2000). This is exactly as we expected and

Table 1: Evaluation of the proposed method on the gels
with human samples in SWISS-2DPAGE database: N gives
the number of detected spots with our method and M − N
gives its difference with the number of detected and, be-
fore counting, manually edited spots with Melanie software.
M is published on SWISS-2DPAGE web portal and also in
(Hoogland et al, 2000).
Gel N M-N (M-N)/N
[%]
CEC 3136 -62 -2
CSF 2220 -556 -25
DLD1 2898 542 18.7
ELC 2709 -565 -20.9
HEPG2 2242 620 27.7
HEPG2SP 1686 48 2.8
HL60 2718 446 16.4
KIDNEY 2914 -18 -0.6
LIVER 2427 -14 -0.6
LYMPHOCYTE 1175 -249 -21.2
LYMPHOMA 2013 -123 -6.1
NUCLEI LIVER 3584 -2587 -72.2
NUCLEOLI H. 2826 -1555 -55
PLASMA 1694 -272 -16.1
PLATELET 1931 262 13.6
RBC 1307 493 37.7
U937 1998 -1103 -55.2
hoped for as we are presenting spot hypotheses in or-
der to help the user to focus on important parts of the
gel. Only in 4 cases this number was much bigger
than expected; the difference between the number of
detected spots with our method and the reported num-
ber of detected and, before counting, manually edited
spots with Melanie software was more than 30% of
the number of detected spots with our method (see
the fourth column in Table 1). On the other hand, in 4
cases the number was almost identical to the reported
one; the difference was less than 3% of the number
of detected spots. Note also that since our results are
contrasted to the results obtained with Melanie soft-
ware after manual editing, the latter results about the
number of spots are less objective than we would like.
In general, we were quite satisfied with the ob-
tained results but, based on presented observations,
still not completely convinced in the method effi-
ciency. Thus, we looked at another reported infor-
mation, which should be more objective: the number
of identified spots. These are identified proteins that
compose a proteome. We looked at the gels with the
number of identified spots less than 50 and made the
following hypothesis: If the algorithm can detect all
obvious identified spots, especially in the cases where
the number of detected spots is smaller than the re-
ported one, then we can say that the algorithm is ef-
ficient in revealing spot hypotheses. What is an ob-
vious spot for a human observer? An obvious spot is
a spot that does not have a property of a shoulder, as
described before, or that it is not missing in a given
gel, because of the procedure how the spot was ob-
tained and then projected into the reference gel, also
as described before.
Table 2: Evaluation of the proposed method on the gels
with human samples in SWISS-2DPAGE database, where
the number of reported identified spots is less than 50: P
gives the number of detected spots with our method that
overlap with marked spots in the database and R − P gives
its difference with the number of reported identified spots.
R is published on SWISS-2DPAGE web portal and also in
(Hoogland et al, 2000).
Gel P R-P Reason
ELC 34 1 shoulder
HL60 26 0 /
KIDNEY 43 1 not visible
PLATELET 40 1 shoulder
U937 41 1 shoulder
The results are presented in Table 2. From them
we can see that with our method we obtain all ob-
vious identified spots, even in the case of HL60 and
PLATELET, where we detected many spots less than
reported by SWISS-2DPAGE project. Based on these
results and our hypothesis expressed in the previous
paragraph, we can now conclude that our algorithm is
efficient in revealing spot hypotheses.
In contrast to the numerical, quantitative results
presented in Tables 1 and 2, Figure 1 gives visual,
qualitative insight into the method’s efficiency. For
better visualization the segmented image is superim-
posed over the original and annotated image with dif-
ferent degree of blending, as described before. The
figure shows a crop from the LIVER gel, where the
identified spots, i.e. spots corresponding to known
proteins, are marked with crosses.
4 CONCLUDING REMARKS
The paper presents a novel algorithm, a sequence of
steps, which leads to the spot segmentation of 2-DE
images. We cannot expect that it will be equally ef-
ficient in all possible cases, on all possible gels, but
it gives us a good starting point for the subsequent
processing. The fact is that its results, the spot hy-
potheses, are very intuitive for human perception and
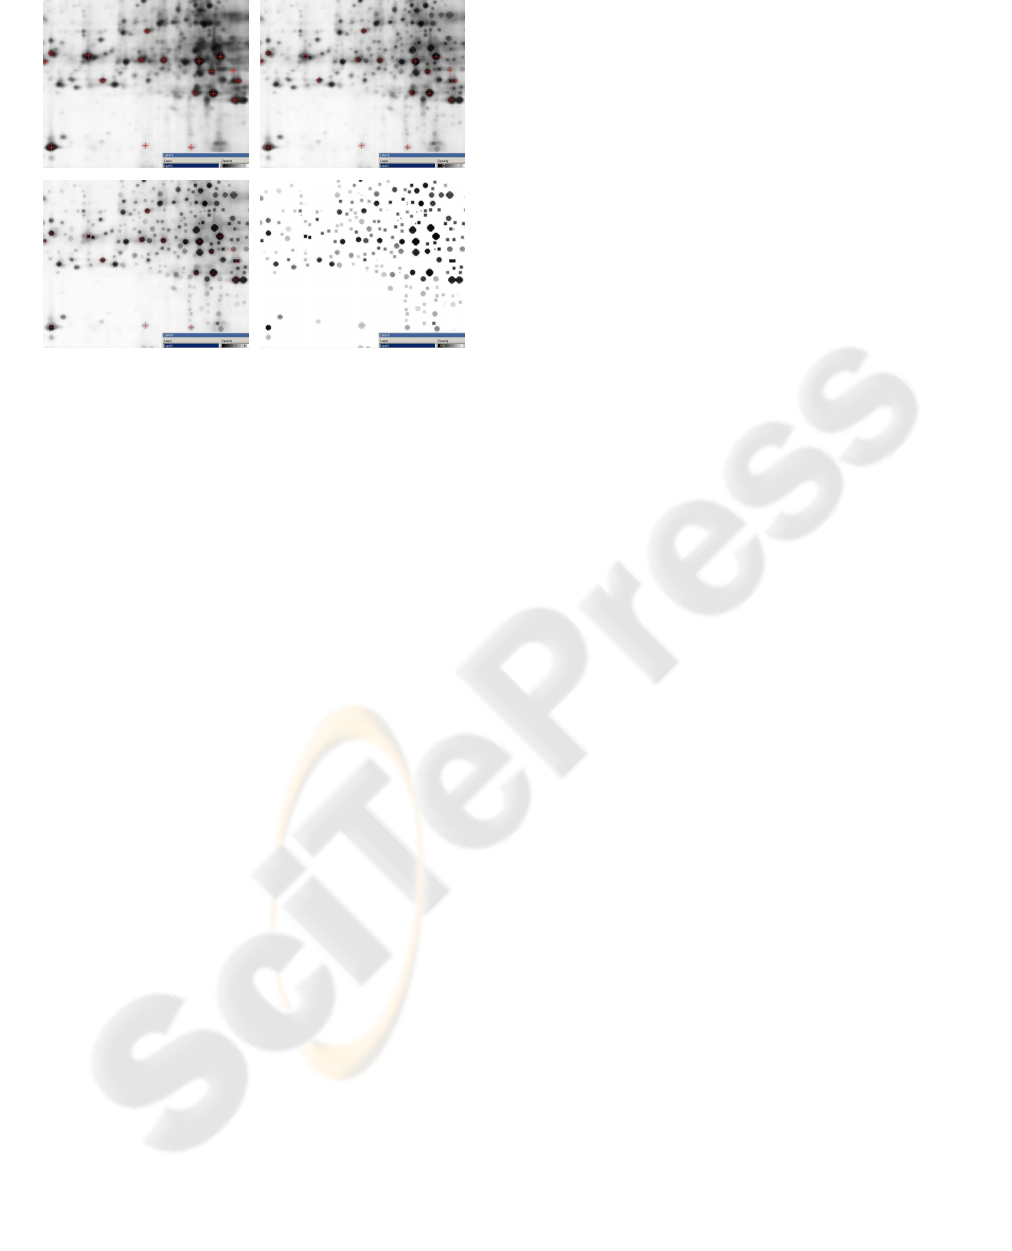
Figure 1: Visual example of results; a crop from the LIVER
gel: the segmented image is superimposed over the orig-
inal and annotated image with different degree of blend-
ing: from the original image to 22%. blended image, 46%
blended image and the segmented image.
us such they help the user to focus on important parts
of the gel.
A lot of work is still in front of us: the use of col-
lected information for automatic elimination of spot
hypotheses, for addressing over-segmentation prob-
lems and for establishing the hypotheses for trains of
spots, the use of other shape constraints to redefine
the spot boundaries, addressing the shoulder prob-
lem, identification and regrowing of overlapped spots
(to their actual size) and/or manual editing or interac-
tive refinement (adding, deleting, merging, splitting)
of results etc.
ACKNOWLEDGEMENTS
Special thanks go to Victor Segura, Enrique Santa-
mar´ıa and Fernando J. Corrales for valuable discus-
sions about the 2-DE, the spot detector and its appli-
cation. We would also like to express our gratitude to
Christine Hoogland for valuable discussions about the
ExPASy (expert protein analysis system) proteomics
server, SWISS-2DPAGE and Melanie software.
REFERENCES
Duncan, J. S., Ayache, N., Medical image analysis:
Progress over two decades and the challenges ahead,
IEEE Trans. Pattern Anal. Mach. Intell. 2000, 22, 85–
106.
Ong, S.-E., Pandey, A., An evaluation of the use of two-
dimensional gel electrophoresis in proteomics, Bio-
mol. Eng. 2001, 18, 195–205.
Mahon, P., Dupree, P., Quantitative and reproducible two-
dimensional gel analysis using Phoretix 2D Full, Elec-
trophoresis 2001, 22, 2075–2085.
Cutler, P., Heald, G., White, I. R., Ruan, J., A novel ap-
proach to spot detection for two-dimensional gel elec-
trophoresis images using pixel value collection, Pro-
teomics 2003, 3, 392–401.
Appel, R. D., Vargas, J., Palagi, P. M., Walther, D.,
Hochstrasser, D. F., Melanie II – a third-generation
software package for analysis of two-dimensional
electrophoresis images: II. Algorithms, Electrophore-
sis 1997, 18, 2735–2748.
Lemkin, P. F., Lipkin, L. E., 2D electrophoresis gel data
base analysis: Aspects of data structures and search
strategies in GELLAB, Electrophoresis 1983, 4, 71–
81.
Horgan, G. W., Glasbey, C. A., Uses of digital image analy-
sis in electrophoresis, Electrophoresis 1995, 16, 298–
305.
Vincent, L., Morphological grayscale reconstruction in im-
age analysis: Applications and efficient algorithms,
IEEE Trans. Image Process. 1993, 2, 176–201.
Vincent, L., Soille, P., Watersheds in Digital Spaces: An
Efficient Algorithm Based on Immersion Simulations,
IEEE Trans. Pattern Anal. Mach. Intell. 1991, 13,
583–598.
Lindeberg, T., Feature Detection with Automatic Scale Se-
lection, Int. J. Comput. Vision 1998, 30, 79–116.
Sporring, J., Nielsen, M., Florack, L., Johansen, P. (Eds.),
Gaussian Scale-Space Theory, Kluwer Academic
Publishers, Norwell 1997.
Russ, J. C., The Image Processing Handbook, CRC Press,
Boca Raton 1995.
Jain, A. K., Duin, R. P. W., Mao, J., Statistical pattern recog-
nition: A review, IEEE Trans. Pattern Anal. Mach. In-
tell. 2000, 22, 4–37.
Otsu, N., A threshold selection method from gray-level his-
tograms, IEEE Trans. Syst. Man Cybern. 1979, 9, 62–
66.
Bettens, E., Scheunders, P., Sijbers, J., Van Dyck, D.,
Moens, L., Automatic segmentation and modelling of
two-dimensional electrophoresis-gels, Int. Conf. Im-
age Process. 1996, 2, 665–668.
Rogers, M., Graham, J., Tonge, R. P., Statistical mod-
els of shape for the analysis of protein spots in two-
dimensional electrophoresis gel images, Proteomics
2003, 3, 887–896.
Taylor, C. F., Paton, N. W., Garwood, K. L., Kirby, P. D.
et al., A systematic approach to modeling, capturing,
and disseminating proteomics experimental data, Nat.
Biotechnol. 2003, 21, 247–254.
Hoogland, C., Sanchez, J.-C., Tonella, L., Binz, P.-A. et al.,
The 1999 SWISS-2DPAGE database update, Nucleic
Acids Res. 2000, 28, 286–288.
