
DISTINGUISHING LIQUID AND VISCOUS BLACK INKS USING
RGB COLOUR SPACE
Dasari Haritha and Chakravarthy Bhagvati
Dept. of Computer and Information Sciences, University of Hyderabad, Hyderabad, India 500046
Keywords:
Questioned Document Examination, Black inks, Image processing, MLR.
Abstract:
Analysis of inks on Questioned documents is often required in the field of document examination. This paper
provides a novel approach for ink type recognition for black inks. Ink types Liquid ink or Viscous ink will
be derived from the colour properties of ink, by extracting its amount of blackness. This classification helps
in distinguishing Gel and Roller pens versus Ball pens. Different types of inks exhibit different absorption
characteristics that causes colour and distribution of colour pixels to change. We observed that the RGB
colour space is useful to reveal the differences in ink types. We used multiple linear regression to model the
RGB data points of the writings to a plane. The distance from the origin (pure black) to that plane is calculated
to classify inks i.e. liquid inks and viscous inks. The distance measures in RGB and HSV colour spaces are
used to identify the particular ink. The accuracy of identification is analysed using Type I and Type II errors.
1 INTRODUCTION
Forensic examination of documents is fast emerging
as a challenging field of research with the prolifera-
tion of fake documents using computers or computer-
based technologies. A document is labeled ques-
tioned document if its authenticity is in doubt. The
main goal of examining questioned documents is to
determine whether they are genuine or fake by detect-
ing alterations if any. Alterations occur primarily in
three forms: addition of new text, obliterations, and
erasures.
The conventional methods used by expert ques-
tioned document examiners are varied and sophisti-
cated involving both destructive and non-destructive
means. References (Brunelle, 1982), (Ellen, 1997)
and (Hilton, 1993) offer excellent overviews. Mi-
croscopy, study of colour variations under chang-
ing illumination (Hilton, 1993), filters for improv-
ing colour contrasts (Bauer, 1966), ultraviolet fluores-
cence, infrared absorbance (Godown, 1964), infrared
luminescence (Hardcastle, 1978) and Fourier trans-
form infrared spectrometry (Brunelle, 1982) have all
been used for examining questioned documents. A
special instrument, called the video spectral compara-
tor, is often used for the above non-destructive test-
ing methods. The destructive chemical procedures
include solubility tests, thin layer chromatography
and high performanceliquid chromatography(HPLC)
(Tappolet, 1983).
The use of image processing techniques in foren-
sic document examination is relatively new (Ellen,
1997). Image processing techniques offer significant
cost benefits by eliminating or at least minimizing the
need for expensive instruments and destructive test-
ing methods. A majority of image processing tech-
niques applied to forensic examination of documents
thus far are quite primitive and usually imply some
form of contrast enhancement. For the image process-
ing community,the forensic domain opens a new area
of research where new operations need to be defined
and developed.
Of particular importance in document examina-
tion is identifying the writing instrument and the type
of ink used in writing. Viscous ink (a thick pastelike
material) is used in ball pens and liquid ink (water
soluble) is used in fountain, gel and roller pens. In
this paper, we study the problem of identifying dif-
ferent ink types using colour image processing tech-
niques. The underlying principle is to detect colour
394
Haritha D. and Bhagvati C. (2007).
DISTINGUISHING LIQUID AND VISCOUS BLACK INKS USING RGB COLOUR SPACE.
In Proceedings of the Second International Conference on Computer Vision Theory and Applications - IFP/IA, pages 394-397
Copyright
c
SciTePress

differences that correspond to the varying absorption
and colour characteristics of different ink types. For
example, a gel black ink appears more blacker than
black viscous ink. In our previous analysis, we show
that the HSV colour space is especially useful as ab-
sorption is revealed in the saturation values in bring-
ing out the differences in blue and blueblack pens
(Haritha, 2005). For black writings, hue is distrib-
uted over the entire range (0, 360
◦
) and hence HSV
colour space is not suitable. In this paper, we use
RGB colour space to reveal the differences in colour
characteristics of black inks.
The rest of the paper is organized as follows. Sec-
tion 2 is a brief description of Multiple Linear regres-
sion and modeling black writings using MLR. Section
3 describes different distance measures in RGB and
HSV colour spaces. Section 4 explains our methodol-
ogy used for fitting the RGB data into a plane in cubi-
cal space and use of distance measures to distinguish
different inks. Results are presented and discussed in
Section 5 with conclusions in Section 6.
2 MODELING BLACK WRITINGS
USING MLR
Multiple Linear Regression model (MLR) is the most
commonly applied statistical technique for relating a
dependent variable and a set of two or more indepen-
dent variables (Siegel, 1996). Using MLR, the RGB
data of black writings is fitted into the plane given by
b
0
+ b
1
×red + b
2
×blue+ b
3
×green = 0
It is very interesting to know how much black is
a black writing. To quantify the blackness of a black
writing, the distance of the fitted plane of the data of
a black writing to pure black point (0,0,0) i.e. the
center of RGB cube is calculated. The distance is
b
0
√
b
2
1
+b
2
2
+b
2
3
. It is observed that this distance of the
fitted plane from the pure black (0,0,0) can be used
to classify the viscous black inks versus liquid black
inks. We know that the ball pens use viscous ink
where as gel/roller pens use liquid ink. Several re-
gression statistics are computed as functions of the
sums-of-squares terms. The explanatory power of re-
gression is summarized by its “R −squared” value,
also called the coefficient of determination, is often
described as the proportion of variance “described”
by regression. If the regression is “perfect”, R
2
is 1.
If the regression is failure, R
2
equals zero.
3 DISTANCE MEASURES IN RGB
AND HSV COLOUR SPACES
Identification of the particular ink/writing instrument
used is the next step to classification in forensic
examination of documents. We use distance mea-
sures to identify the particular ink/writing instrument
used. Black colour can be treated as a dark shade
of any colour. Two black colours can be distin-
guished by their mean R, G, B colour vectors. This
section describes various distance measures existing
for discriminating two colours and the two new de-
rived distance measures namely WeightedL1 HSV
distance measure and Geodesic HSV distance mea-
sure (Chakravarthy, 2005).
In Table 1 the expressions for RGB distance mea-
sures and new HSV distance measures between two
colour vectors are given. The expressions for L1
HSV, L2 HSV, Canberra HSV, Cosine Angle HSV
and Czekanowski HSV distances are similar to that
of RGB distances except that r is to be replaced by h,
g by s and b by v.
Table 1: Distance Measures in RGB and HSV colour
spaces.
DISTANCE
MEASURE
EXPRESSION FOR D(X,Y)
L1 RGB ((|r
1
−r
2
|)+(|g
1
−g
2
|)+(|b
1
−b
2
|))
L2 RGB ((r
1
− r
2
)
2
+ (g
1
− g
2
)
2
+ (b
1
−
b
2
)
2
)
1
2
Canberra
RGB
|r
1
−r
2
|
r
1
+r
2
+
|g
1
−g
2
|
g
1
+g
2
+
|b
1
−b
2
|
b
1
+b
2
Cosine An-
gle RGB
cos
−1
(
r
1
r
2
+g
1
g
2
+b
1
b
2
√
r
2
1
+g
2
1
+b
2
1
√
r
2
2
+g
2
2
+b
2
2
)
Czeknowski
RGB
1−
2(min(r
1
,r
2
)+min(g
1
,g
2
)+min(b
1
,b
2
))
r
1
+r
2
+g
1
+g
2
+b
1
+b
2
Weighted
Euclidean
HSV
q
(v
1
−v
2
)
2
+ s
2
1
+ s
2
2
−2s
1
s
2
cos(h
di f f
)
Weighted
L1 HSV
S×h
di f f
+ |s
2
−s
1
|+ |v
2
−v
1
|
Geodesic
HSV
q
(s
2
−s
1
)
2
+ s
2
1
(h
2
−h
1
)
2
+ (v
2
−v
1
)
2
Statistical evaluation The validity of performance
of the distance measures in identification of writing

instrument is analyzed on statistical basis. We take
the distance of feature vectors between writings of
the same writing instrument and call it as a within
writing instrument distance denoted by d
w
. The be-
tween writing instrument distance d
b
is obtained by
measuring the distance between two different writing
instruments.
d
w
= d(f
ij
− f
ik
) where i = 1 to n and j, k=1 to m.
d
b
= d(f
ij
− f
kl
) where i, k= 1 to n and j, l=1 to m.
where n is the number of writing instruments, m
is the number of sample images written by each writ-
ing instrument, f
ij
etc. are the feature vectors of the
corresponding images, and d is the distance between
two feature vectors of an image. Let n
w
and n
b
are the
sizes of within and between writing instrument dis-
tance classes respectively. If n writing instruments
provide m writings, there are n
w
= m
C
2
×n within
writing instrument distance data and n
b
= m×m×n
C
2
.
In our data collection we have taken 15 ball pens and
15 gel and roller pens. For each pen 15 images are
taken.
n
w
= 30 x 15
C
2
= 3150 data.
n
b
= 15 x 15 x 30
C
2
= 97,875 data.
A good descriptive way to represent the relation-
ship between two classes is calculating overlaps be-
tween two distributions. It can be done with two types
of errors. Type I error occurs when the images of
same writing instrument are identified as of different
writing instruments. The type II error occurs when the
images of different writing instruments is classified as
of same writing instrument.
4 METHODOLOGY
Twenty Five black pens including ball,roller,gel and
fountain pens with different manufactures were taken.
A page containing 100 words was written by each of
these pens on A4 size white xerox paper and from that
page selected samples (20) were scanned at high opti-
cal resolution i.e,1200 dpi. Algorithm for classifying
inks is comprising of the following steps.
1. Select suitable threshold values of R, G and B
from the RGB histograms to seperate background
and foreground pixels.
2. Fit the foreground data into a plane in the RGB
cube.
3. Find the distance d from the fitted plane to the
pure black point (0,0,0). Find R
2
coefficient of
determination and MSE.
4. Classify liquid and Viscous Inks using the dis-
tance from the pure black (if d is ≥ 15, it is vis-
cous ink otherwise it is liquid ink) .
Figure 1: Writings of sample image of cello ball and Add
roller pens.
Algorithm for identification of inks comprises the fol-
lowing steps.
1. Seperate background and foreground pixels.
2. Find the feature vector (mean colour) (r,g,b) of the
foreground pixels. Find its equivalent h, s, v val-
ues. Find the distance d between the mean colour
vectors of two images.
3. Label the distance as within writing instrument
distance, if the two images belong to the same pen
or as between writing instrument distance, if two
images belong to different pens.
4. Repeat the above step for all the images of the
database. Find the Type I and II errors from the
distributions of within and between writing instru-
ment distances.
5 RESULTS AND DISCUSSION
Figure 1 shows the sample images taken using Cello
ball, Add roller pen. The data from the sample writ-
ings of different pens is fitted into a corresponding
plane in the RGB cube. Figure 2 shows the fitted data
of ball pen, actual data in to the corresponding planes
in the RGB cubic space. The green coloured plane in-
dicates the fitted plane of the data. The red coloured
pixels indicate actual data of the scanned image. The
blue coloured pixels indicated the estimated pixels.
The coefficient of determination ”R-Squared ratio” in
fitting the data of Cello ballpen image using regres-
sion is 0.999268 and MSE is 14.7248. The R
2
ratio in
fitting the data of Add roller pen image using regres-
sion is 0.999586 and MSE is 7.6987. We can observe
that R
2
ratio is closure to 1 indicating that regression
is ”good”.
We have taken two datasets, one for training and
analysis and another for testing purpose.The first
dataset comprises of 15 ball pens and 10 roller/gel
pens each of 20 sample images. The second dataset
testset comprises of 10 ball pens and 10 gel/roller
pens each of 10 sample images. The results were
analysed using False Acception Ratio (FAR) and
False Rejection Ratio (FRR). The FAR and FRR are
calculated for classification of liquid inks and viscous
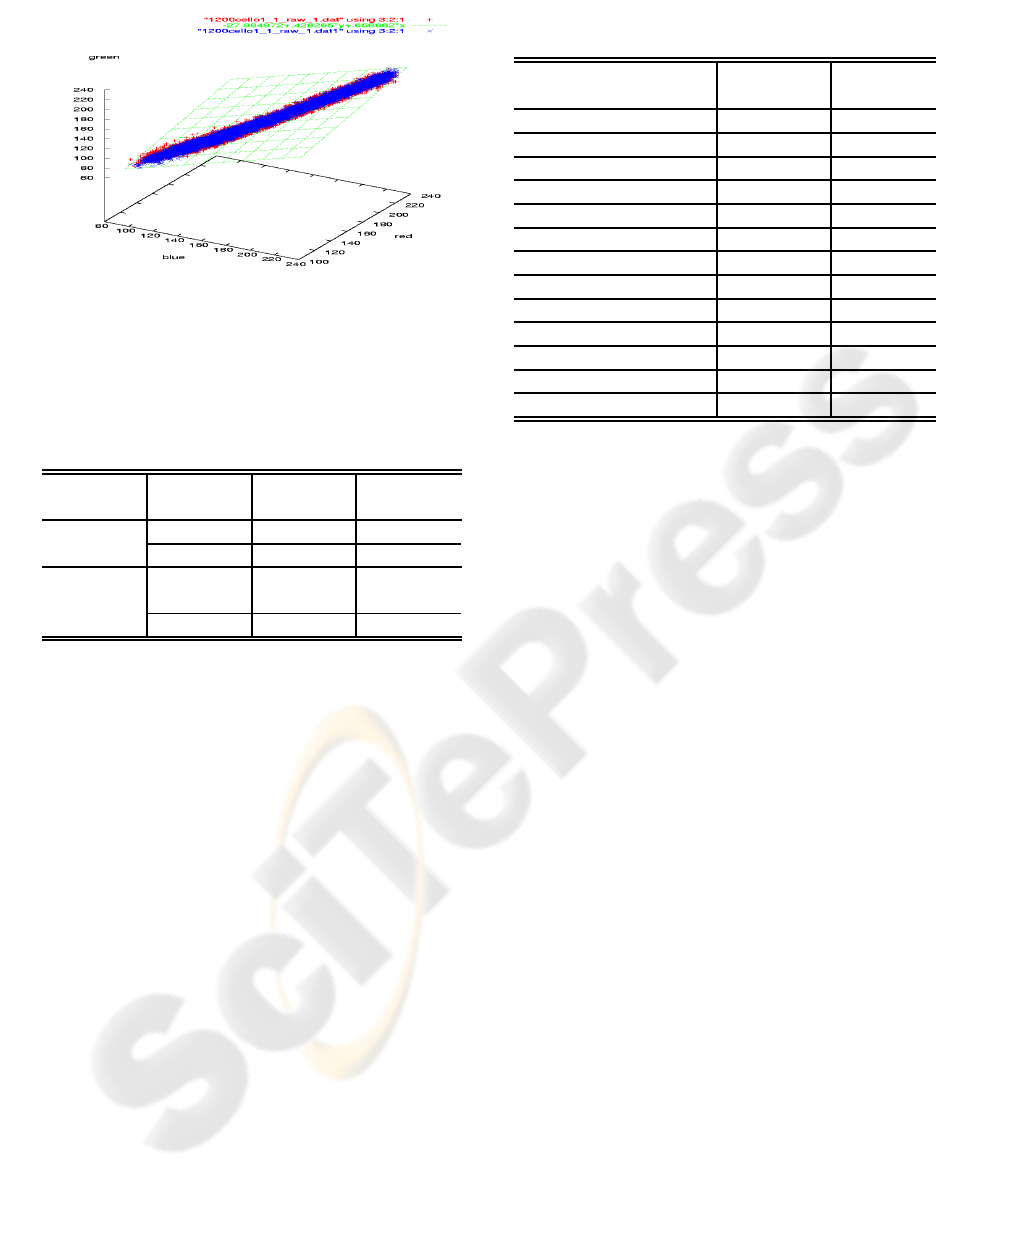
Figure 2: Data fitting of Cello ball pen using MLR.
inks based on distance of the fitted plane from pure
black and is shown in Table 2.
Table 2: FAR and FRR errors for Ballpens and Gel/Roller
pens training and test sets.
PEN
TYPE
DATA
SET
FAR % FRR %
Ball pens training 02.34 1.35
test 1.87 1.09
Gel/Roller
pens
training 01.35 02.34
test 1.09 1.87
After classifying the inks, we must be able to iden-
tify the writing instrument. For each handwritten
image, the mean vector of foreground pixels is ob-
tained. The distance between these mean vectors of
two images is calculated. For analysis the distribu-
tions of within the same writing instrument distance,
between different writing instrument distances is plot-
ted. We have taken 15 ball pens and 15 gel/roller
pens and each pen with 15 images. Table 3 shows
the TYPE I and TYPE II errors of identification.
Type I error is minimum for our two new distance
measures Weighted L1 HSV and Geodesic HSV dis-
tances. However, the overall accuracy is more for L1
HSV and L2 HSV distances.
6 CONCLUSIONS
In this paper, we have shown the use of RGB colour
space in classification of black inks. An approach for
fitting the black writings into a plane in RGB space,
using MLR is given. This work is useful as the first
step in identification of alterations in forged docu-
ments. The use of distance measures in identifica-
tion of particular writing instrument is explored. This
work can be further extended to distinguish gel ver-
Table 3: Type I and II errors for HSV and RGB distance
measures.
DISTANCE MEASURE TYPE I
ERROR
TYPE II
ERROR
L1 HSV 7.176 6.595
L2 HSV 6.82 08.33
Cosine HSV 12.16 11.94
Canberra HSV 14.04 7.15
CzeknowskiHSV 8.432 11.28
Euclidean HSV 10.608 10.067
WeightedL1 HSV 6.55 11.59
Geodesic HSV 5.46 16.767
L1 RGB 16.22 14.71
L2 RGB 12.16 15.27
Canberra RGB 9.929 21.47
Cosine RGB 16.802 17.39
CzeknowskiRGB 9.672 22.6
sus roller pens and to classify printed documents. It
can also be further extended to develop a system that
can be used to classify and identify black writings or
printings for forensic examination of documents.
REFERENCES
Bauer B, 1966, The Use of Partially Transparent Plates to
Increase the Contrast of images, Applied Optical Jour-
nal.
Brunelle R., 1982, Questioned Document Examination in
Forensic Science Handbook, Prentice Hall.
Chakravarthy B., Haritha D., 2005, Distance Measures in
RGB and HSV colour spaces, ICATA.
David Ellen, 1997, The Scientific Examination of Docu-
ments, Taylor & Francis, 2nd Edition.
Godown L., 1964, New Non Destructive Testing Methods,
Journal of Criminal Law, Criminology and Police Sci-
ence.
Hardcastle R., Hall M., 1978, A Technique for the Enhance-
ment of the Infrared Luminescence of Inks, Journal of
Forensic Science Society.
Haritha D., Chakravarthy B., 2005, Classification of Liquid
and Viscous inks using HSV colour space, ICDAR.
Ordway Hilton, 1993, Scientific Examination of Questioned
Documents, CRC Press.
Siegel F.A., Morgan C.J., 1996, Statistics and Data Analyis
an Introduction, 2nd Edition, John Wiley & Sons, New
York.
Tappolet J.A, 1983, The High Performance Thin Layer
Chromatography, its Application to the Examination
of Writing Inks, Forensic Science International.
