EXTRACTION OF WHEAT EARS WITH STATISTICAL
METHODS BASED ON TEXTURE ANALYSIS
M. Bakhouche, F. Cointault
Enesad, UP GAP, 21, Bd Olivier de Serres, F21800 Quétigny, France
P. Gouton
LE2I, UMR-CNRS 5158, University of Burgundy, BP 47870, 21078, Dijon Cédex, France
Keywords: Image processing, texture analysis, pattern recognition, agronomy.
Abstract: In the agronomic domain, the simplification of crop counting is a very important and fastidious step for
technical institutes such as Arvalis
1
, which has then proposed us to use image processing to detect the
number of wheat ears in images acquired directly in a field. Texture image segmentation techniques based
on feature extraction by first and higher order statistical methods have been developped for unsupervised
pixel classification. The K-Means algorithm is implemented before the choice of a threshold to highlight the
ears. Three methods have been tested with very heterogeneous results, except the run length technique for
which the results are closed to the visual counting with an average error of 6%. Although the evaluation of
the quality of the detection is visually done, automatic evaluation algorithms are currently implementing.
Moreover, other statistical methods of higher order must be implemented in the future jointly with methods
based on spatio-frequential transforms and specific filtering.
1 INTRODUCTION
Manual wheat ear counting for yield prediction
requires high labor cost in addition to the time that
needs to be achieved. Recently many works have
been carried out on the agriculture domain (remote
sensing, weed detection…) by using image
processing techniques, but little research has been
done on wheat ear detection and counting (Germain
et al., 1995), which are however two important steps
for yield evaluation or prediction. Since Arvalis
wants to replace the manual counting by an
automatic one, a feasibility study on the use of
image processing techniques has been proposed in
2004 (Guérin et al., 2005). The way explored in this
study combines information jointly provided by
texture and colour analysis, which allow to represent
each image in a color-texture hybrid space. This
study showed that the use of image processing
techniques directly in the field is an interesting
solution, but, although the results obtained are
satisfactory, the different algorithms must be
validated on numerous images, and contain some
disadvantages mainly in detection phase due to no
recurrent hybrid space. Consequently Arvalis
decided to continue this project with a first objective
based on the improvement of the detection step. It
appears that the combination of texture and color
analysis is not clearly evident for our application.
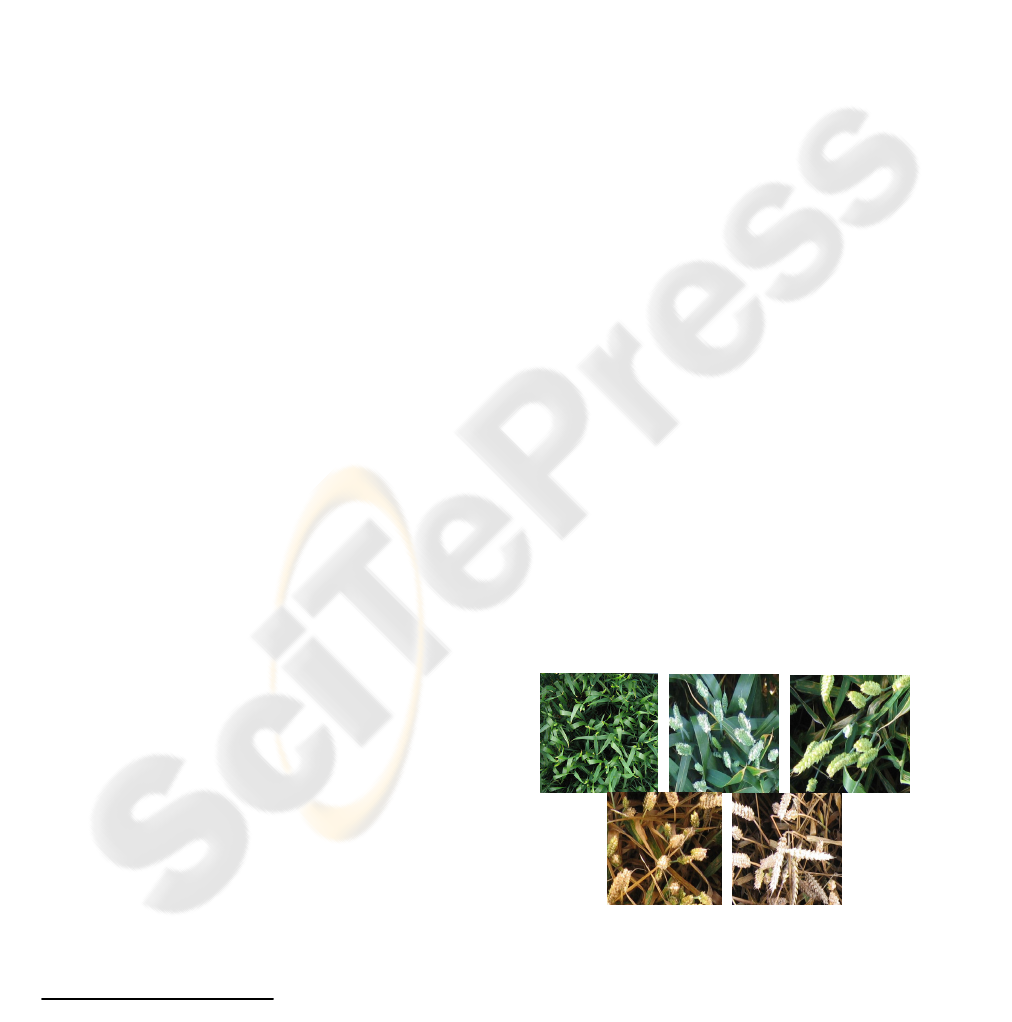
Particularly, the color and the shape of ears (figure
1) depend on the wheat growth stage and the
illumination conditions.
Figure 1: Wheat images acquired in field at different
growth stages (from flowering (April-top left) to harvest
(July-bottom)).
1
French plant and feed-grain research institute.
276
Bakhouche M., Cointault F. and Gouton P. (2007).
EXTRACTION OF WHEAT EARS WITH STATISTICAL METHODS BASED ON TEXTURE ANALYSIS.
In Proceedings of the Second International Conference on Computer Vision Theory and Applications - IU/MTSV, pages 276-280
Copyright
c
SciTePress
In order to avoid this problem, we decided to focus
our approach on the development of texture analysis
before associating the color information because
texture is very rich in information.
2 IN-FIELD IMAGE
ACQUISITION SYSTEM
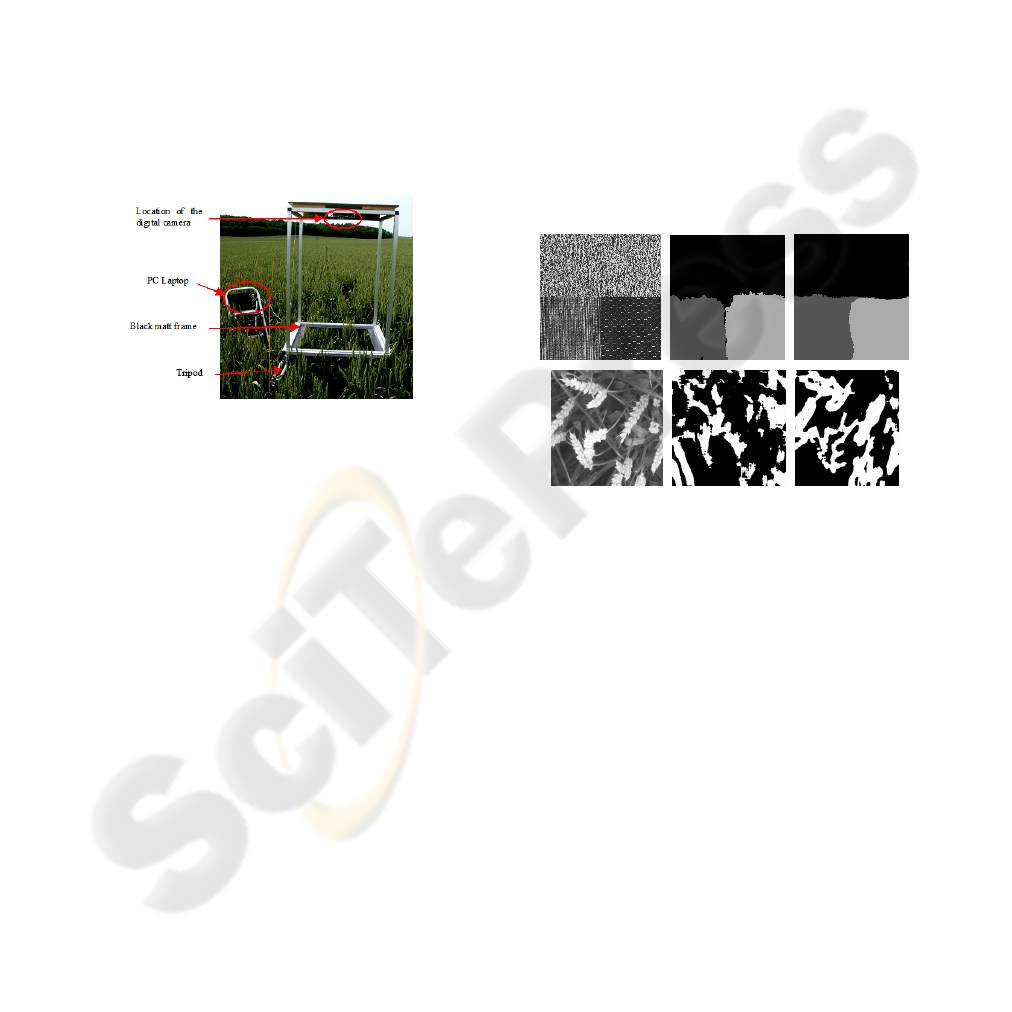
The acquisition system must allow to take
photographs at different wheat growth stages with a
good resolution. We use a Canon digital camera (5
Mpixels) which takes images on an 0.5*0.5 m²
homogeneous test area of wheat delimited by a black
matt frame as shown in figure 2. The digital CCD
camera is controlled by a PC laptop and is located
vertically above the field of view at a height of 0.93
m.
Figure 2: In Field image acquisition system.
Taking photographs directly in the field needs to
control the illumination of the scene. Because we
take images under different lighting conditions, due
to variable cloud cover and solar illumination, we
use some screen protection system (not shown in the
figure 2) to limit the light in the area of study.
3 WHEAT EAR EXTRACTION BY
PIXEL CLASSIFICATION
All the acquired images contain three important
classes: wheat ears, stems and leaves, and soil. Their
extraction can be done using texture and/or color
image analysis techniques. The current approach
proposed in this paper is only based on texture
analysis techniques because texture and color seem
to be independent phenomena that should be treated
separately (Mäenpää and Pietikäinen, 2004) (even if
some recent works (Foucherot et al., 2004) have
shown that the color of an image can slightly modify
the texture) and the information obtained with
texture analysis are available for each wheat growth
stage.
3.1 Statistical Methods of Feature
Extraction
The non-periodicity of the position of the ears in
each image conducted us to use statistical methods
for feature extraction. These methods study the
interaction between a pixel and its neighbours in
term of intensity. In literature, many methods are
proposed but none of them is generally applicable to
all kinds of images and different algorithms are not
equally suitable for a particular application. This can
be proved in figure 4 in which we tested the method
based on Cross-Diagonal Texture Matrix, defined by
Al-Janobi in 2001 and the method based on grey
level differences defined by Weska et al. in 1976 to
discriminate Brodatz textures (Brodatz, 1966) and
wheat ears.
Figure 3: Results of classification with cross-diagonal
texture matrix and grey level differences. (a) and (a’): test
images. (b) and (b’): segmentation with cross-diagonal. (c)
and (c’): segmentation with grey level differences.
The two previous methods do not allow a well
recognition of the wheat ears, which can be due to
the aspect of the textures (local grey scale
variations), texture orientation, non-homogeneous
objects to detect, … For these different reasons, we
decided to study other statistical methods of first and
higher-order. The first order method implemented is
based on the computation of a mono-dimensional
histogram of the intensity (Pratt, 1991) from which 7
features are extracted: Mean, Variance, Energy,
Entropy, Contrast, Skewness, Kurtosis.
Nevertheless, this technique does not consider the
correlation between pixels in the processing. This
drawback is resolved by the study of a bi-
dimensional histogram based on the computation of
the co-occurrence matrix defined by Haralick et al.
in 1973. From this matrix, we extract some Haralick
a
b
c
a’
b
’c’
EXTRACTION OF WHEAT EARS WITH STATISTICAL METHODS BASED ON TEXTURE ANALYSIS
277

features that allow a better texture discrimination
(Conners and Harlow, 1980) and also three others
features (cluster shade, cluster prominence and
diagonal moment) (Unser, 1986):
1
max 1 max 1
2
00
1
(* *(,,,))
2
NN
ij
Dmoment i j P i j d
θ
−−
==
=−
∑∑
11
3
00
(2*)(,,,)
θ
−−
==
=+−
∑∑
gg
NN
ij
CShade i j moy P i j d
max max
11
4
00
(2*)(,,,)
θ
−−
==
=+−
∑∑
NN
ij
CProminance i j moy P i j d
where (i,j) represents the grey scale of the current
pixel, P(i,j) designs the probability to find the grey
scale i with neighbour j in the considered region, and
max
N is the maximum intensity in this region.
Despite the good results obtained by this
method, it depends on the choice of direction and
need an important computing time although it can be
reduced by decreasing the quantification to the
detriment of the loss of information. For a better
description of the texture, statistical methods of
higher-order seem to be more suitable (according to
the obtained results). One of the most popular
methods is the run length matrix defined by
Galloway in 1975. This method is based on the
determination of the runs of grey levels that are
present in the image or an area of the image. To
summarize the information brought by run length,
we define a matrix in which we can extract 11
features among which the Short and Long Run
Emphasis, the Grey Level Distribution, the Run
Length Distribution and the Run Percentage.
3.2 Unsupervised Pixel Classification
by K-Means Algorithm
In literature, a great number of classification
algorithms based on distance measurement, K-
nearest-neighbours, Support Vector Machine
(Burges, 1998), … have been developped. The K-
Means algorithm is one of the most used in several
works due to its simplicity of implementation and
the good results that it provides in texture
classification. First, the features are normalised and
the class centres are randomly initialised. Then each
pixel k is assigned to a class C
i
if the Euclidian
distance between its attributes and the centre of the
class is minimal. Finally, the centres are updated by
calculating the mean of each attribute given by the
equation (1) and the process is iterated until
stabilisation fixed by a criteria given by the formula
(2):
,
1
k
kij
zC
k
t
n
μ
∈
=
∑
(1)
0
1
0
1
0
1
→−=
∑∑
−
=
−
=
Nc
i
Np
j
ijUUijcrt (2)
Where:
k
μ
: centre of gravity of the class C
k,
,ij
t : attribute j of considered pixel i,
n
k
: number of pixels at the class C
k.
Uij : class centre updated at the step k-1,
U
1
ij: new class centre updated at the step k,
Nc: number of classes considered in the processing,
Np: number of parameters.
Other algorithms of classification have also been
applied in agriculture, such as neural network, which
are used to evaluate, for instance, the quality of
apple surface combined with knn and Bayesian
classification (Kavdir and Guyer, 2004). However
our application depends of a lot of parameters,
which give us numerous different images, and the
learning seems to be quite difficult.
3.3 Evaluation of the Detection and
Segmentation
Although numerous segmentation algorithms have
been developed these last years, none of them can be
universally used. To evaluate these methods the
visual evaluation is always used as the reference
method. However, evaluation criteria have been
defined in literature and can be divided into
categories: with or without ground truth. According
to Laurent et al. in 2003, the most suitable criteria
for uniform or less textured images are those defined
by Zeboudj in 1988 and Borsotti et al. in 1998,
whereas Rosenberger criteria (Rosenberger, 1999) is
more suitable for texture images.
Here the evaluation of the different results is
visually done but some unsupervised criteria of
detection evaluation are currently implemented.
Moreover, results obtained from agronomists on
numerous images took at different wheat growth
stages and for different illumination conditions will
be compared in a few days with automatic counting.
4 RESULTS AND DISCUSSION
To put across our study, some in-field images have
been tested by the different statistical techniques
VISAPP 2007 - International Conference on Computer Vision Theory and Applications
278
implemented. The figure 4 shows the results of the
wheat ear detection obtained for one image among
the in-field acquired images done by Arvalis.
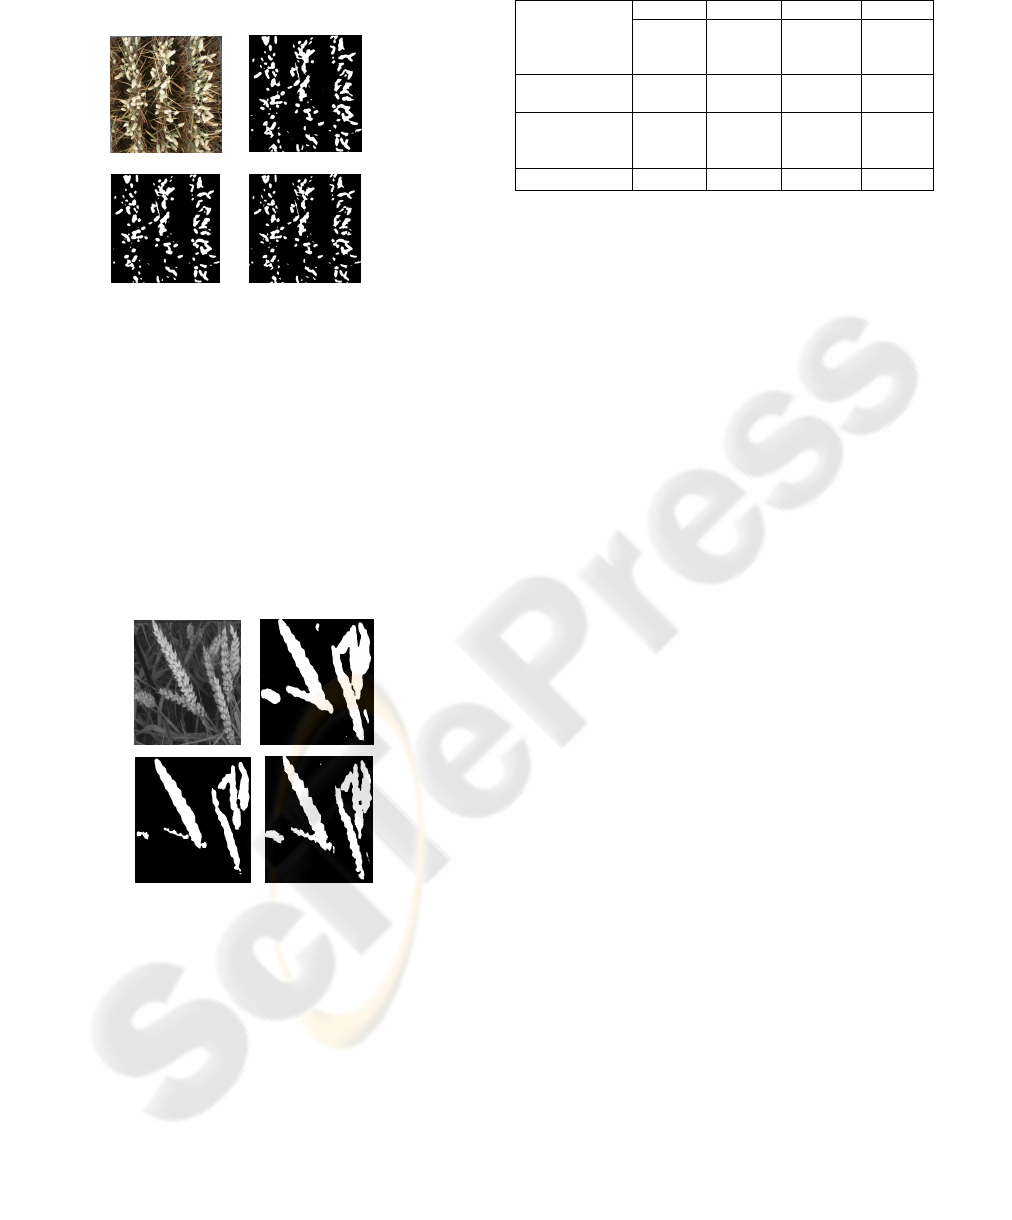
Figure 4: Results of segmentation obtained by the different
techniques implemented for a whole image: (a) Test
image. (b) with 1
st
order statistic. (c) with co-occurrence
matrix. (d) with run length.
The previous results seem to be good, but visual
evaluation is too long to be done on numerous
images.
Taking into account the different tests carried out
until now, it appears in this case that the three
methods give good results, even if run length
method reproduces nearly the real shape of the ears
as it is shown in the figure 5.
Figure 5: Wheat ear detection with the three different
methods implemented for a part of an image. (a) Test
image. (b) with 1
st
order statistic. (c) with co-occurrence
matrix. (d) with run length.
These last results are very instructive because the
second step of our project will be focused on the
counting of the number of grains per wheat ears, and
it appears that the Run Length method could be
interesting. Although the results are given for a few
number of images, the table 1 confirms that run
length method is the most appropriated method for
our application, according to the other methods.
Table 1: Detection of wheat ears by the different methods.
Image 1 Image 2 Image 3 Image 4
Visual
detection
(‘true’ value in
bold)
184 179 128 150
With 1
st
order
statistics
190 156 116 134
With co-
occurrence
matrix
174 139 119 131
With run length
182 159 123 141
The evaluation of the detection quality is actually
done visually and by comparison of the results of
automatic counting with those done manually by
Arvalis. A comparison will be provided soon, jointly
with other results tied to a visual evaluation done by
agronomist experts.
Finally, in order to test a lot of images in one
step, wheat ear simulated images will be interesting
and constitutes another step of our application.
These images will be able to accurately represent the
different wheat growth stages, the different
illumination conditions, the different shapes, …
4 CONCLUSION
In this paper, we presented automatic wheat ear
detection based on textural feature extraction. Three
statistical methods of first and higher-order have
been used in an unsupervised pixel classification
algorithm based on K-means. The results of the
detection with the Run Length method are quite
close to visual detection but all the methods need to
be validated on numerous images, took in different
lighting and wheather conditions, and must be
evaluated by the quality of the detection they allow.
As previously mentionned, this work is also
part of a more global project to facilitate the
countings for the agronomist technicians, but also to
give in final an evaluation of the wheat yield before
the harvest. In terms of image acquisition, an
autonomous mobile robot used for different
applications is under construction, simultaneaoulsy
with the development of other texture analysis
methods based on orthogonal transforms and
specific filtering.
REFERENCES
Al-Janobi A. 2001. Performance evaluation of cross-
diagonal texture matrix method. Pattern Recognition,
vol. 34, pp-171-180.
a
c
b
d
a
c
b
d
EXTRACTION OF WHEAT EARS WITH STATISTICAL METHODS BASED ON TEXTURE ANALYSIS
279

Borsotti M., Campadelli P. and Schettini R. 1998.
Quantitative evaluation of color image segmentation
results. Pattern Recognition Letters, 19:741-747.
Brodatz P. Textures. 1966. A photograph Album For
Artists and designer. Dover, New York.
Burges C.J. 1998. A tutorial on support vector machines
for pattern recognition. Data Mining and Knowledge
Discovery, 2:121-167.
Conners R.W. and Harlow C.A. 1980. A Thoerical
Comparison of Texture algorithms, IEEE Trans. On
PAMI, Vol.2, N°3, pp. 204-222.
Foucherot I., Gouton P., Devaux J.C. and Truchetet
F. 2004. New method for analysing colour texture
based on the Karhunen-Loeve transform and
quantification. Pattern Recognition, 37 (8), pp. 1661-
1674.
Galloway M.M. 1975. Texture analysis using gray level
run lengths. Computer Graphics and Image
Processing, vol.4, pp-172-179.
Germain C., Rousseau R. and Grenier G. 1995. Non
destructive counting of wheatears with picture
analysis. Image Processing and its application, pp.
453-439.
Guérin D., Cointault F., Gée C. and Guillemin J.P. 2005.
Étude de faisabilité d’un système de comptage d’épis
de blé par vision (Feasibility study of a wheatears
counting system per vision) – Traitement du Signal,
Special Session Colour Imaging, Vol. 21, n°5, pp.
549-560.
Haralick R.M., Shanmugam K. and Dinstein I.H. 1973.
Textural features for image classification. IEEE Trans.
On sys. Han and cybernetics, Vol. SMC-3, n°6.
Kavdir I. and Guyer D.E. 2004. Comparison of artificial
neural networks and statistical classifiers in apple
sorting using textural features. Biosystem Engineering
89 (3), pp 331-334.
Laurent H., Chabrier S., Rosenberger C., Emile B. and
Marché P. Etude comparative de critères d’évaluation
de la segmentation, In Gretsi 2003.
Mäenpää T. and Pietikäinen M. 2004. Classification with
colour and texture: jointly or separately. Pattern
Recognition, vol 37, pp 1629-1640.
Pratt W.K. 1991. Digital image processing. Willey
Interscience, New York.
Rosenberger C. 1999. Mise en Oeuvre d’un Système
Adaptatif de segmentation d’images. PhD thesis,
Université de Rennes 1.
Unser M. 1986. Sum and difference histograms for texture
classification. IEEE Trans, Patterrn Anal, Mach. Intel.
8, pp. 118-125.
Weska J. S., Dyer C. R. and Rosenfeld A. 1976. A
comparative Study of texture measures for terrain
classification. IEEE Trans. On sys, Man. And
cybernetic, vol. 6, n°4, pp. 269- 285.
Zeboudj R. 1988. Filtrage, Seuillage Automatique,
Contraste et Contours: du Pré-Traitement à l'analyse
d'image.
PhD thesis, Université de Saint Etienne.
VISAPP 2007 - International Conference on Computer Vision Theory and Applications
280
