
IMAGE ENHANCEMENT BY REGION DETECTION ON CFA
DATA IMAGES
S. Battiato, S. Cariolo, G. Gallo
D.M.I. – University of Catania - Viale A. Doria 6, 95125, Catania, Italy
G. Di Blasi
Department of Linguistics, University of Calabria, Ponte Pietro Bucci, Cubo 17b, Rende, Italy
Keywords: Image enhancement, Principal Component Analysis, Expected color rendition.
Abstract: The paper proposes a new method devoted to identify specific semantic regions on CFA (Color Filtering
Array) data images representing natural scenes. Making use of collected statistics over a large dataset of
high quality natural images, the method uses spatial features and the Principal Component Analysis (PCA)
in the HSL and normalized-RG color spaces. The classes considered, taking into account “visual
significance”, are skin, vegetation, blue sky and sea. Semantic information are obtained on pixel basis
leading to meaningful regions although not spatially coherent. Such information is used for automatic color
rendition of natural digital images based on adaptive color correction. The overall method outperforms
previous results providing reliable information validated by measured and subjective experiments.
1 INTRODUCTION
Usually typical consumer devices acquire image on
CFA data format: each input pixel contains a single
chromatic channel, according to some specific
pattern (e.g. Bayer Pattern (Bayer, 1976). It has been
shown like low-level processing can be effectively
performed on CFA domain (Bosco et al, 2002),
(Lukac et al, 2004). In this paper we propose to
engage a high level processing devoted to detect, on
pixel basis, semantic regions related to a few classes
having the most perceptive impact on the human
visual system (Lee et al, 1998), (Yendrikhovskij et
al, 1998): skin, vegetation, blue sky and sea. The
overall results can be effectively used to further
refine demosaicing process and/or implementing on-
board an image classification scheme able to
properly tune successive processing steps (e.g. JPEG
compression (Battiato et al, 2001).
The proposed technique definitively improves
the region classifier described in (Naccari et al,
2004), (Naccari et al, 2005) introducing some spatial
features together with a more detailed color data
analysis. The enhancement technique for
unsupervised automatic color rendition of natural
digital images is based on adaptive color correction
properly driven by a natural region classifier pixel-
based (see (Naccari et al, 2004) for major details).
Differently than in (Luo et al, 2003) where a
physical model-based approach was used, our
semantic extraction is mainly derived making use of
a sort of “regularity” measured in the HSL and
normalized-RG color spaces over a large dataset of
real-scene photographic images taken by non
professional. In particular, the image classes under
investigation have been naturally clustered, taking
into account their color distribution using a PCA-
based approach. For each input image the final
output is a false-color image where the semantic
regions considered are properly marked, as proposed
both in Dominant Color in Lab based on the Mpeg-7
guidelines (MPEG Requirement Group, 2001) and in
(Luo et al, 2003). A series of subjective experiments
confirm the effectiveness of the proposed algorithm.
The paper is structured as follows. The next
Section describes the overall methodology of the
proposed classification strategies. Section 3 explains
in detail each single processing step. Section 4
briefly summarizes the enhancement strategy
whereas Section 5 reports the experimental results.
A brief conclusive Section pointing to future
evolutions is also included.
200
Battiato S., Cariolo S., Gallo G. and Di Blasi G. (2007).
IMAGE ENHANCEMENT BY REGION DETECTION ON CFA DATA IMAGES.
In Proceedings of the Second International Conference on Computer Vision Theory and Applications - IU/MTSV, pages 200-207
DOI: 10.5220/0002067402000207
Copyright
c
SciTePress
2 STATISTICAL ANALYSIS
The semantic extraction analyzes the input image
and identifies the various classes. As previously
mentioned main classes for natural scenes are: skin,
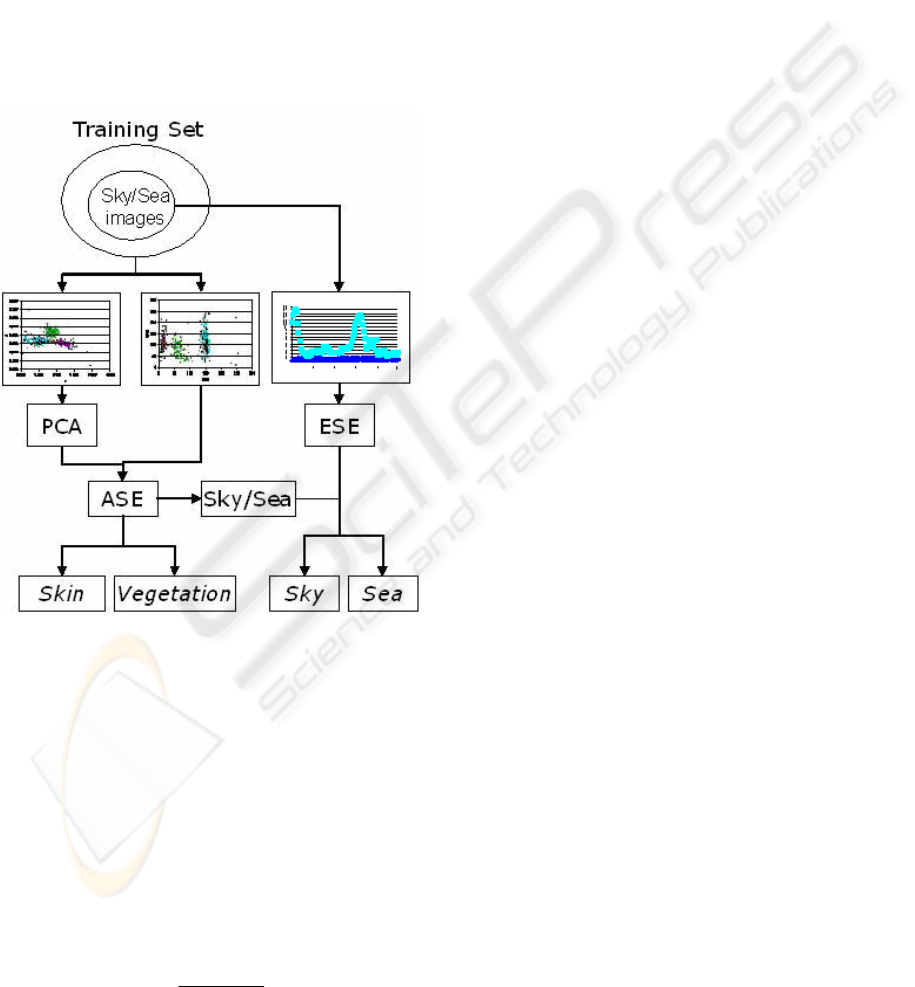
vegetation, blue sky and sea. Figure 1 shows the
overall pipeline of the proposed method. Initially,
both color and edge analysis are performed
according to some measured statistical inference on
the input training set. After that, the main processing
steps Automatic Semantic Extraction (ASE) and
Edge Semantic Extraction (ESE) based on collected
statistics and PCA are used to derive a reliable
region identifier.
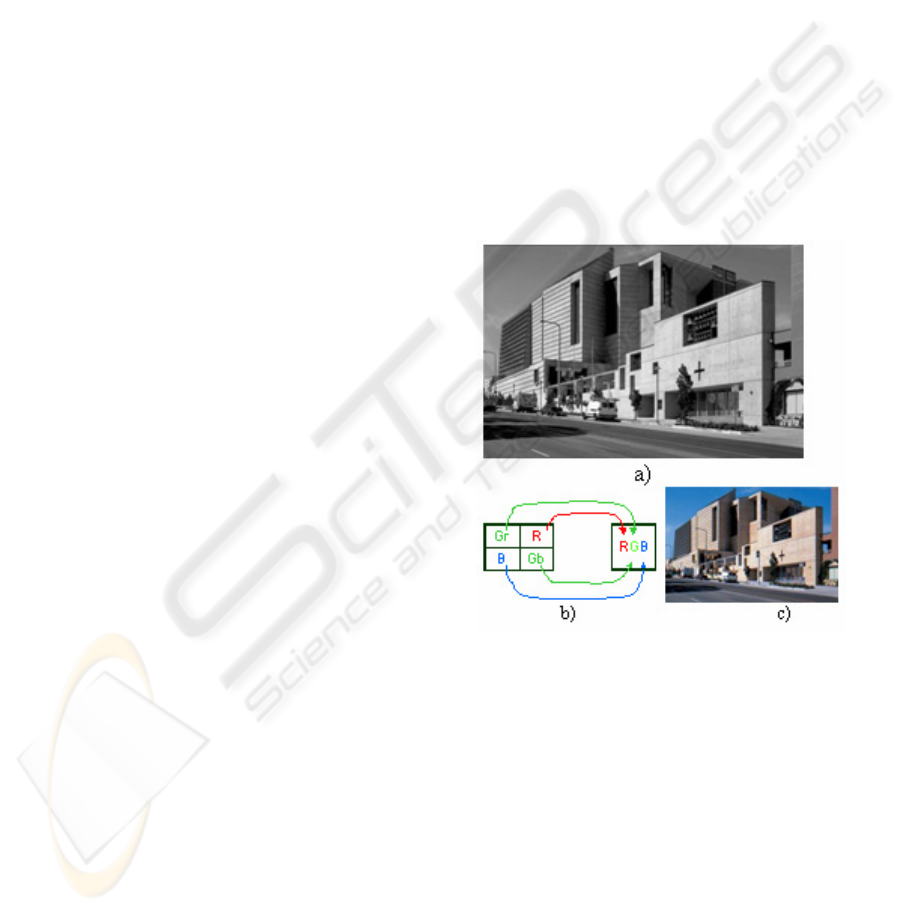
2.1 Macropixel Bayer to RGB Color
Conversion
Acquiring images by digital CCD/CMOS sensor, in
Bayer CFA format, the final chromatic components
of the image have to be reconstructed by some color
reconstruction technique. For our purposes, using
low computational resources, an RGB images is
generated converting 2x2 blocks of the input CFA
data into a RGB pixel, in the following way (Figure
2). The green value is obtained as
G
i
=
G
R
i
+
G
B
i
2
(1)
where G
Ri
and G
Bi
are the green values in the i-th
2x2 block. The red and the blue values are simply
retained. This color conversion technique leads to a
RGB image with reduced dimensions respect to the
original image. The chromatic information are
however enough to proceed with the successive
steps.
2.2 Color Statistics and Features
Extraction
A large database of “high-quality” natural scene
images have been used as the training set in order to
characterize the chromatic properties of the color
classes under investigation. All images have to be
chosen according to perceived naturalness principle
(Yendrikhovskij et al, 1998). Images affected by
severe color cast and/or anomalous color distortions
(according to a common sense of expected
color/scene pairing) have not been considered. To
avoid collecting statistics on excessively scattered
color samples, we used an automatic segmentation
algorithm (Comaniciu et al, 1997) to initially extract
homogeneous chromatic regions related to the basic
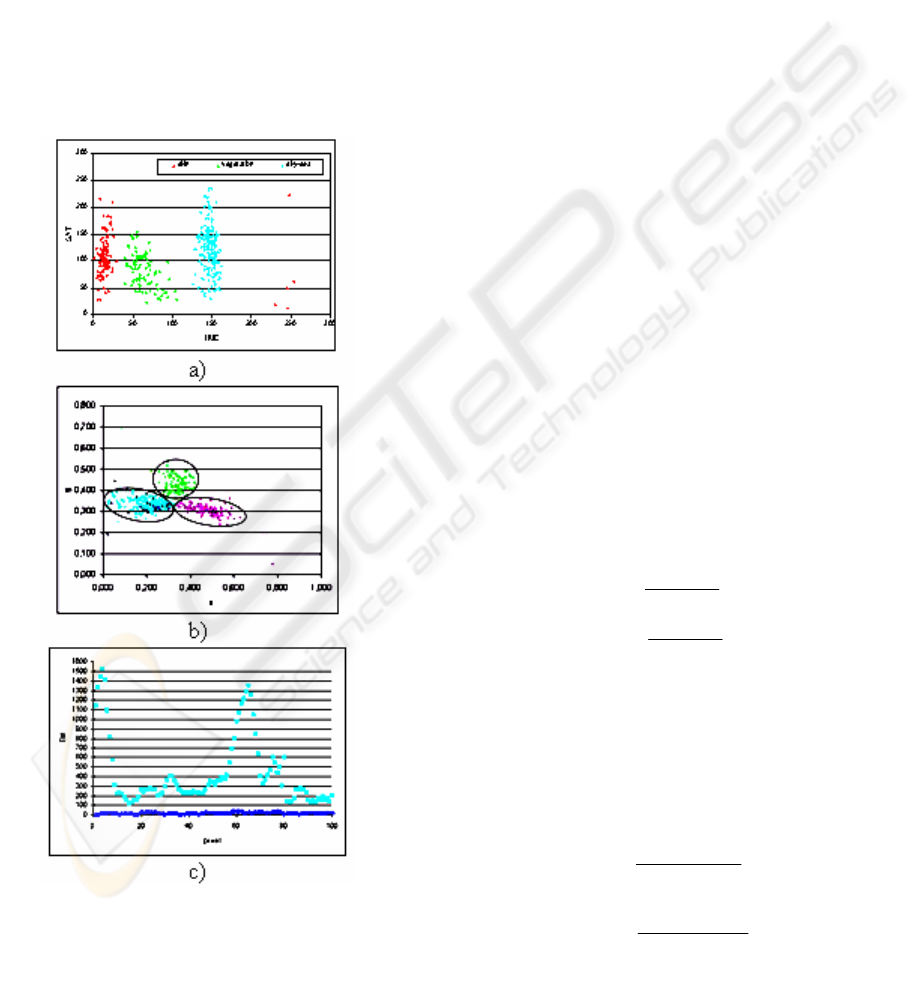
color classes. Collected statistics show that the HSL
and normalized-RG color space mapping are well
suited for reliable chromatic classification (Figure
3). The “luminance” channel in HSL color space is
not used to have a “luminance independence”
strategy. The training set has been used to properly
derive the corresponding parameters devoted to
discriminate between the various classes. As can be
noted in Figure 3, the input data can be clustered
according to the vertical clustering depicted in
Figure 3a and the ellipses in Figure 3b. Following
this strategy a simple punctual H-rg based selection
can be performed over the pixels in order to
establish the belonging to the chromatic classes
under detection. While vertical threshold can be
manually tuned, ellipses parameters require a
computation performed using the PCA as explained
later. A “draft” region identifier is then obtained
although it is not yet capable to discriminate
between sky and sea. These two classes cannot be
discriminated by simply using color information: a
deeper strategy is definitively needed.
The principal component analysis (PCA) is a
standard technique to remap a dataset defined over a
vector space into another one in which meaningful
components are aligned to the vector basis. PCA is
typically used to reduce the overall number of
components. In our case we use PCA for a different
purpose: we remap the normalized-RG color space
dataset (see Figure 3b) to infer the canonical
Figure 1: The pipeline of the proposed method.
IMAGE ENHANCEMENT BY REGION DETECTION ON CFA DATA IMAGES
201
equation of the best fitting ellipse. Once these
ellipses are obtained, normalized-RG color space is
divided into four regions (skin, vegetation, sky/sea
and other) that can be directly used for region
identification.
The sea is often indistinguishable from the sky
(Luo et al, 2003), but other information can be used
to properly discriminate between them. Clearly, if a
correct image orientation is known, the knowledge
of possible spatial configurations could be utilized to
resolve the ambiguities between sky and sea bodies.
A different approach has been used here, taking into
account the different magnitude of the high
frequency content of the two classes as shown in
Figure 3c. Using some heuristic analysis, edge
detection rules have been added to reinforce
classification relying on pure chromatic principles.
The learning phase has used a subset of the original
training set containing sky and sea (the sky/sea
training set) to properly characterize and tune the
involved parameters.
3 SEMANTIC EXTRACTION
3.1 Automatic Semantic Extraction
(ASE)
This step analyzes the input color image in order to
identify regions belonging to specific, real world
classes. Once such regions have been identified, a
mask M, properly coding the belonging to a specific
class c of each underlying pixel is pointed out. Thus,
given a pixel in position k we denote with c
k
the
class it belongs to. In our implementation the
classification is limited to the classes: skin,
vegetation, sky and sea. Of course, using the same
techniques, the ASE could be easily extended to
accommodate an arbitrary number of classes
depending on the specific environment within they
are intended to be used. Indeed, it is worth noting
that once an image has been properly classified, the
pseudo image could be used to support several kinds
of applications (e.g. color enhancement (Battiato et
al, 2004), (Naccari et al, 2004) and image
classification (Fredembach et al, 2004). The image is
classified on pixel basis using rules that have been
easily derived from the collected statistics. In order
to avoid dealing with ambiguous values coming
from the saturated and/or low-lit pixels, only that
ones satisfying the following condition are
considered:
S
k
> T
S
(
)
∧
L
k
> T
L
(
)
(2)
where S
k
and L
k
are respectively saturation and
lightness values for pixel in position k, and T
S
and T
L
are experimentally fixed thresholds. The assignment
of each pixel P
k
to the available classes is handled
by three mutual exclusive rules:
(
)
(
)
(
)
(
)
{}
seaskyvegskinc
classPgrRHL
ckc
k
ckc
/,,
,
∈
∈→∈∧≤≤
α
(3)
where H
k
and (r, g)
k
are respectively hue and rg
values for pixel in position k, L
c
and R
c
are the hue
vertical bounds for class c and α
c
is the ellipse for
class c.
Figure shows an output of our method where
for sake of clarity the detected classes are identified
properly choosing RGB triplets: (255,0,0) for skin,
(0,255,0) for vegetation, (0,0,255) for sky/sea,
coding with (0,0,0) the unclassified pixels.
3.2 Edge Statistic Extraction (ESE)
As clearly depicted in Figure 3b some further step is
needed to discriminate between sky and sea classes.
The feature chosen to overcome this limitation is the
edge magnitude referred to the input resolution size.
Figure 3c shows the mapping obtained considering
the statistic of magnitude of the sky/sea pixels, after
a convolution with an edge detection kernel. The
plot in Figure 3c shows how two obvious bounds to
discriminate among sky, sea and unclassifiable
pixels are clearly present. Two different kernels
have been used: the 3x3 Laplacian filter to detect
Figure 2: Bayer Pattern image a); Macropixel
interpolation b); RGB image after color recovery c).
VISAPP 2007 - International Conference on Computer Vision Theory and Applications
202
edges in low-resolution images (images lower than
2000x1500 pixels) and the 7x7 Abdou filter (Abdou
et al, 1979) for high-resolution images.
Following the same above notation, the
assignment of each pixel P
k
to the sky or sea class is
handled by two mutual exclusive rules:
()
{}
seaskyc
classPUEMD
ckckc
,∈
∈→≤≤
(4)
where EM
k
is the edge magnitude for pixel in
position k, D
c
and U
c
are the edge magnitude
horizontal bounds for class c. Figure 3c shows how
this simple heuristic rule is able to improve the
discrimination power of the method.
4 ENHANCEMENT STRATEGY
The overall enhancement strategy (Naccari et al,
2004), (Naccari et al, 2005) requires to properly
filter the mask of each class by using a standard low
pass Gaussian kernel. The filtering is performed on a
down-sampled mask image followed by successive
up sampling by means of bilinear interpolation. The
sampling ratio and the kernel size where chosen to
be proportional to input image resolution. The final
mask M = {c
k
, w
k
}, indicating for each pixel in
position k the class c
k
to which it belongs, and the
degree of membership w
k
. Since the filtering step
will cause the results of the punctual classification to
overlap (e.g. multiple assignments will be available
for the same pixel), a max rule is used to obtain one
class and one degree of membership for each pixel.
(
)
{
}
)_,_,_,_max(
_,_,_,_max:
kkkkk
kkkkck
seawskywvegetationwskinww
seawskywvegwskinwcclassc
=
=
=
(5)
The enhancement is aimed to reduce the distance
of colors belonging to the various classes from the
target values by means of proper, lightness
preserving, color shifting. The mask M = {c
k
, w
k
} is
used to guide this process, by assigning a class
related target to the classified pixels, and by
modulating the amount of color correction. For each
class (skin, vegetation, sky, sea) the targets were
obtained by mapping the centroids of the collected
statistics on the rg (RGB normalized) chromaticity
plane. Given an RGB color, the mapping on the rg
plane can be defined as:
BGR
G
g
BGR
R
r
++
=
++
=
(6)
The computed color targets for each class c will
be indicated as (r
c
, g
c
). After converting the input
image into the rg color space employing, the mean
value on the color plane of each identified color
class is computed as follows:
(
)
()
c
k
kk
gc
c
k
kk
rc
card
ccg
card
ccr
∑
∑
=
=
=
=
:
:
μ
μ
(7)
Figure 3: Natural images database mapping in HS plane
a), normalized-RG plane b), and Edge Magnitude plane c).
Vertical H clusters in a) and ellipses in b) identify the
investigated chromatic classes. Horizontal clusters in c)
discriminate between sk
y
and sea.
IMAGE ENHANCEMENT BY REGION DETECTION ON CFA DATA IMAGES
203

with card
c
representing the cardinality of class c.
For each class, the offset from the target color is
defined as:
gccgc
rccrc
g
r
μ
μ
−=Δ
−
=Δ
(8)
The color enhancement is carried out by shifting
each pixel value (r
k
, g
k
) by the computed offset and
then converting back in the standard RGB color
space. The ambiguity, due to the “one to many”
mapping, of the inverse of Eq. (6) can be
advantageously used to define a lightness
preserving, constrained linear system:
⎪
⎪
⎪
⎪
⎩
⎪
⎪
⎪
⎪
⎨
⎧
++
=
++
Δ+=
++
Δ+=
++
33
'''
'''
'
'''
'
kkkkkk
gck
kkk
k
rck
kkk
k
BGRBGR
g
BGR
G
r
BGR
R
(9)
where (R
k
, G
k
, B
k
) is the input color for pixel k,
and (R’
k
, G’
k
, B’
k
) its output value. In order to avoid
the appearance of unpleasant artifacts and/or
excessive color distortions, the final color correction
is modulated by using the computed membership
values w
k
of the mask M, and two modifiable
parameters a and b. The final values (R’’
k
, G’’
k
, B’’
k
)
are thus defined as follows:
()
[
]
()
[]
()
[]
ba
BwBwbaB
B
ba
GwGwbaG
G
ba
RwRwbaR
R
kkkkk
k
kkkkk
k
kkkkk
k
+
−++
=
+
−++
=
+
−++
=
1
1
1
'
"
'
"
'
"
(10)
Parameters a and b allow to perform a linear
combination between original and color corrected
pixel values, while weights w
k
decrease or increase
the amount of correction depending on the reliability
of the classification. This approach allows us to
preserve the dynamic range of the classified regions
avoiding also a naturalness modification.
Table 1: The overall preference when the input and the
detected semantic region were simultaneously presented to
the subject.
Preference Percentage %
Very Accurate 17
Accurate 39
Acceptable 32
Inaccurate 7
Wrong 5
Table 2: Comparative preference between our method and
segmentation method.
Preference Percentage %
Our Method 63
Segmentation Method 37
5 EXPERIMENTAL RESULTS
The overall method has been tuned using as training
set a large dataset of real-scene photographic images
taken by non professional. As previously mentioned
all images are acquired by using “high quality”
settings both in terms of resolution and compression
size, according to perceived naturalness principle
(Yendrikhovskij et al, 1998) excluding images
affected by severe color cast and/or anomalous color
distortions. The training set is obtained, generating
the corresponding bayer data, properly subsampling
input data; the effectiveness of the method is not
affected by this approximation.
The method has been implemented in ANSI C
and the overall complexity could be considered
negligible mainly in the detection steps; indeed it
could be easily embedded in imaging devices where
usually limited resources are available. To validate
the proposed region detection strategy, we use a
database of 1000 images acquired at different
resolution size, taken also with low-cost imaging
devices. In the verification step, all images have
been acquired in CFA format and the analysis
process is applied after color matrixing process, just
before demosaicing. Just for comparison,
Figure
shows the improvement obtained in the region
extraction with respect to the results presented in
(Naccari et al, 2004). The overall quality
enhancement, is clearly improved. We remind that
enhancement is aimed to reduce the distance of
colors belonging to the various classes from the
target values by means of proper, lightness
preserving, color shifting. The mask of pseudo-color
is used to guide this process, by assigning a class
related target to the classified pixels, and by
VISAPP 2007 - International Conference on Computer Vision Theory and Applications
204

modulating the amount of color correction (Naccari
et al, 2004), (Naccari et al, 2005). For sake of
comparison some subjective tests were performed. A
data set of 800 natural scenes, which did no belong
to our statistic class sample, was used to perform
visual assessment. 50 subjects, with no particular
visual defects on color perception and without
experience in digital image or color processing,
expressed their opinion in a light control
environment and on a CRT monitor with a standard
sRGB profile. Two types of visual tests were
performed: an overall preference and a comparative
judgment between the original and a segmented
images obtained using (Comaniciu et al, 1997).
Table
1 reports the overall preference when the input and
the detected semantic region were simultaneously
presented to the subject. This index represents the
average in terms of percentage referred to the
subject choices (2 - Very Accurate, 1 - Accurate, 0 -
Acceptable, -1 - Inaccurate, -2 - Wrong) with respect
to the final result. The proposed strategy has
obtained an effective good score.
Table 2 reports the
comparative tests results performed by showing to
each subject in random order a couple of images
containing the original, the corresponding
segmented one and our result. For each comparison
(original vs. segmented/classified) a quality score
was assigned. Also in this case the proposed
enhancement has obtained effective performances.
These results confirm the effective detection of
semantic regions with respect to a simple
segmentation.
A further example of global color enhancement
is showed in Figure 7.
6 CONCLUSION AND FUTURE
WORKS
A novel approach able to detect semantic regions, on
pixel basis, relative to natural scene (vegetation, sky,
sea, and skin) has been presented. The overall
enhancement obtained by making use of such
regions is able to reproduce the “expected color
appearance”.
Future works will include the possibility to
further extend the region classifier, just introducing
metadata and spatial consideration. Major details,
links and demo can be found at
http://www.dmi.unict.it/~iplab.
REFERENCES
Abdou, I.E., Pratt, W.K., 1979. Qualitative Design and
Evaluation of Enhancement/Thresholding Edge
Detector, Proceedings of IEEE, vol. 67, No. 5, pp.
753-763.
Battiato, S., Mancuso, M., Bosco, A., Guarnera, M., 2001.
Psychovisual and Statistical Optimization of
Quantization Tables for DCT Compression Engines.
International Conference on Image Analysis and
Processing 2001, pp. 602-606.
Battiato, S., Bosco, A., Castorina, A., Messina, G., 2004.
Automatic Image Enhancement by Content Dependent
Exposure Correction. EURASIP Journal on Applied
Signal Processing, Vol. 12, pp. 1849-1860.
Bayer, B.E, 1976. Color Imaging Array. U.S. Patent
3971065.
Bosco, A., Mancuso, M., Battiato, S., Spampinato, G.,
2002. Temporal Noise Reduction of Bayer Matrixed
Video Data. International Conference on Multimedia
and Expo 2002, pp.681-684.
Comaniciu, D., Meer, D., 1997. Robust Analysis of
Feature Spaces: Color Image Segmentation. Conf.
Computer Vision and Pattern Recognition, pp. 750-
755.
Fredembach, C., Schröder, M., Süsstrunk, S., 2004.
Eigenregions for Image Classification. IEEE
Transactions on Pattern Analysis and Machine
Intelligence (PAMI), Vol. 26 (12), pp. 1645-1649.
Lukac, R., Martin, K., Platanoitis, K.N., 2004. Digital
Camera Zooming Based on Unified CFA image
Processing Steps. IEEE Trans. on Cons. Electronics,
Vol.50, (1), pp. 15-24.
Luo, J., Etz, S.P., 2003. A Physical Model-based
Approach to Detecting Sky in Photographic Images.
IEEE Transactions on Image Processing, Vol. 3 (11).
Lee, E.J., Ha, Y.H., 1998. Favorite Color Correction for
Favorite Colors. IEEE Trans. On Consumer
Electronics, Vol. 44 (1), pp. 10-15.
MPEG Requirements Group, 2001. Description of MPEG-
7 Content Set, ISO/IEC/JTC1/SC29/WG11/N2467.
Naccari, F., Battiato, S., Bruna, A., Cariolo, S., Castorina,
A., 2004. Natural Scenes Enhancement by Adaptive
Color Correction. IEEE ISCE International
Symposium on Consumer Electronic, pp. 320-323.
Naccari, F., Battiato, S., Bruna, A., Capra, A., Castorina,
A., 2005. Natural Scene Classification for Color
Enhancement. IEEE Trans. on Cons. Electronics,
Vol. 5 (1), pp.234-239.
Yendrikhovskij, S.N., Blommaert, F.J.J , De Ridder, H.,
1998. Optimizing color reproduction of natural
images. Sixth Color Imaging Conference: Color
Science, Systems, and Applications, pp. 140 145.
IMAGE ENHANCEMENT BY REGION DETECTION ON CFA DATA IMAGES
205
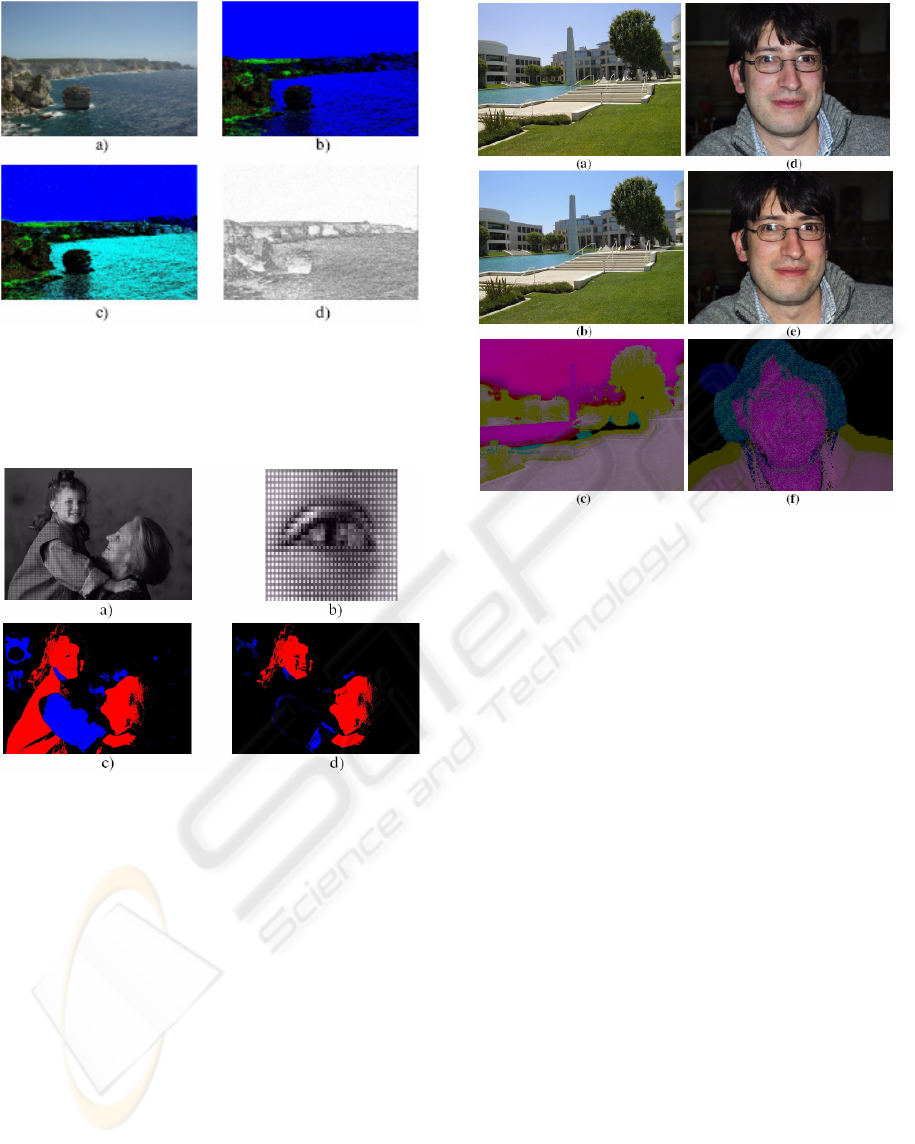
Figure 4: An example of the proposed method. a) The
original image (1280 x960 pixels), b) the detection using
ASE, c) the detection using ASE+ESE, d) the detecte
d
edges.
Figure 5: Examples of visual comparison betwee
n
semantic regions detection applied on an input image a),
obtained with our method d) and using the technique
described in [Naccari et al, 2005] c). The blue and re
d
areas of the dress in c) are now almost discarded. In b) a
magnified detail of the input image showing the typical
Bayer pattern.
Figure 6: A landscape image (a), its enhanced version (b)
and the difference image (c). A portrait image (d) its
enhanced version (e) and the difference image (f).
VISAPP 2007 - International Conference on Computer Vision Theory and Applications
206
a)
b)
c)
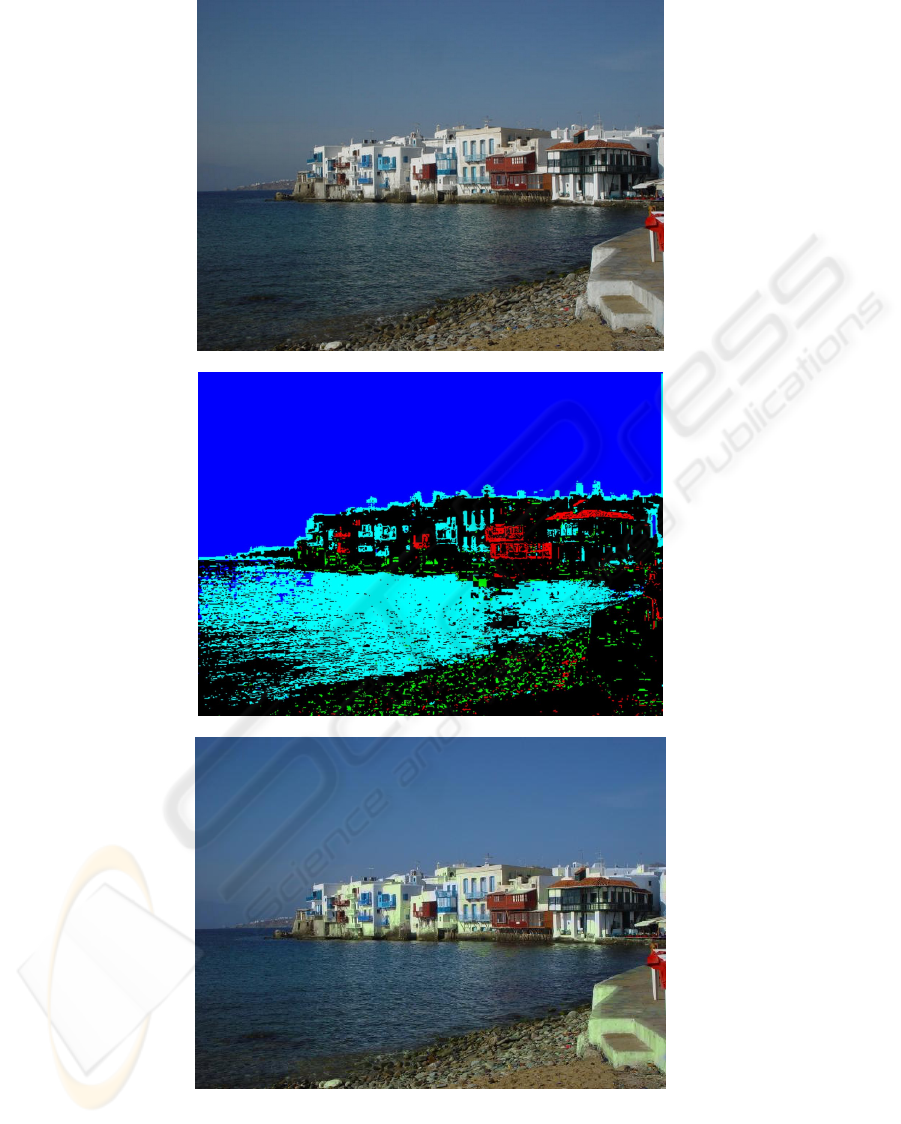
Figure 7: The input image a) and its enhanced version c). The mask obtained by the proposed system b).
IMAGE ENHANCEMENT BY REGION DETECTION ON CFA DATA IMAGES
207
