
USING AUGMENTED REALITY FOR REAL-TIME
VISUALIZATION OF TACTILE HEALTH EXAMINATION
Gennadiy Nikishkov and Tomokazu Tsuchimoto
University of Aizu, Aizu-Wakamatsu 965-8580, Japan
Keywords:
Augmented reality, visualization, tactile measurements.
Abstract:
An augmented-reality approach to real-time visualization of tactile data with projection on a human organ is
presented. A target procedure is breast cancer examination with a tactile sensor. The special tactile sensor is
used to measure tissue stiffness values at discrete points of the examined organ. We developed an augmented
reality system which integrates the tactile sensor, a head-mounted display with a small video camera, and a
notebook computer. Tracking of the human organ and the tactile sensor is based on optical markers. One
marker is attached to the patient’s body and is used to track the spatial position of the human organ. Another
marker is placed on the tactile sensor. Registering space positions of this marker with respect to the first
marker allows determination of the shape of the human organ for subsequent data visualization. Results of
stiffness measurements are depicted as semi-transparent three-dimensional objects projected on the patient’s
body. Different visualization techniques are employed depending on the amount of data and user preference.
Experiments with sensing tactile data and its visualization for a variety of objects, including a silicon breast
model and animals organs, have been performed. It was found that the developed augmented-reality system is
useful in medical-physics measurements.
1 INTRODUCTION
Most breast cancers are detected by tactile investiga-
tion. The most common method of breast cancer de-
tection is palpation. A health care professional em-
ploys palpation to feel the size and firmness of a le-
sion. Human fingers are sensitive tools for determin-
ing stiff areas. However, rigorous training and exten-
sive experience of a person performing palpation are
necessary. Even in the case of correct diagnosis, it is
impossible to register results of palpation in quantita-
tive form.
Physical measurements of tactile information can
be done with tactile sensors (Omata and Terunuma,
1992), (Srikanchana et al., 2002), (Kearney et al.,
2004), (Girnyk et al., 2006). Different tactile sensors
are based on different physical principles for measur-
ing information that helps to discover lesions. The
main advantage of tactile sensors over hand palpation
is the possibility of registering quantitative informa-
tion which can be stored and used in the future for
comparison purposes. In addition to archiving of tac-
tile information it is important to develop methods
of visual representation and digital documentation of
the physical examination (Kaufman et al., 2006). It
is also important to get real-time visual information
on measurements during medical examination proce-
dure.
To provide real-time support for breast tactile
measurements we selected the augmented reality (AR)
approach (Azuma, 1997). The AR approach augments
a real view of an object with additional graphical in-
formation generated by computer. The purpose of our
research is to develop an AR system for real-time vi-
sualization of tactile data directly on the surface of a
human organ (in this case, breast) under examination.
Augmented reality has been used in medical appli-
cations for more than a decade (Bajura et al., 1992).
Currently, usage of augmented reality in medical ap-
plications is characterized by a three-dimensional ap-
proach to visualization (Sakas, 2002) and by em-
ploying augmented-realitysystems in clinical practice
91
Nikishkov G. and Tsuchimoto T. (2007).
USING AUGMENTED REALITY FOR REAL-TIME VISUALIZATION OF TACTILE HEALTH EXAMINATION.
In Proceedings of the Second International Conference on Computer Graphics Theory and Applications - AS/IE, pages 91-97
DOI: 10.5220/0002074800910097
Copyright
c
SciTePress

Tactile
censor
Camera
Video
Frequency
Voltage
Frequency
counter
Artoolkit
Sensor
position
Projection
matrix
Tactile
data
Visualizer
Video
Display
Camera
Sensor
HMD
Object
PC
Markers
a b
Figure 1: Augmented-reality system for measurement and visualization of human tissue stiffness: a) main system components
and software modules with data flow; b) use of the system by the physician.
(Konishi et al., 2005).
Related research (Balasingham et al., 2003),
(Birkfellner et al., 2002) and (Das et al., 2006) is de-
voted to augmented reality visualization in operating
environments. Typically, AR is used to overlap cross-
sectional medical images onto patient space, thereby
allowing a physician to see under the surface. Rosen-
thal et al. (Rosenthal et al., 2002) performed projec-
tion of a cross-sectional image of a tumor into patient
space. An invasive instrument, such as a biopsy nee-
dle, is simultaneously tracked and projected into the
same patient space. Watching the whole picture, the
physician operates the needle with AR guidance.
The goal of the work that we present in this arti-
cle is an augmented reality system which performs
real-time visualization of tactile information during
breast cancer examination: picture representing mea-
sured tactile information projected on the patient’s
body, which moves and has complicated shape. To
perform AR visualization of tactile data, two mark-
ers are used. One marker serves for tracking the pa-
tient’s body position. The other marker, placed on the
tactile sensor is used to determine three-dimensional
shape of the organ where tactile measurements are
performed. Visual information – in the form of bars,
contours, or contoursurfaces – is superimposed on the
patient’s body, taking into account the actual organ
shape. To observe AR visualization a doctor wears a
head-mounted display (HMD) with a small video cam-
era. The AR visualization can be also viewed on a
computer screen.
Contributions of this paper in medical visualiza-
tion are: real-time integration with a measurement
device; use of a second marker for determining the
shape of the human’s organ; and AR visualization of
tactile data projected on the patient’s body.
2 AR SYSTEM DESCRIPTION
A system for measurement and visualization of tactile
information should fulfill the following requirements:
• The system should integrate real-time measure-
ments and visualization;
• Visualization image should be projected on the
patient’s organ, which is not flat;
• Depending on the amount of data, different types
of visual data representation should be available;
• The system should be based on common and in-
expensive hardware components.
2.1 System Design
The main system components and software modules
with data flow in our prototype are shown in Fig. 1a.
The system consists of a tactile sensor, an HMD, a
video camera, and a notebook computer. Two markers
are used for tracking the human organ (measurement
object) and for determining its shape.
The tactile sensor in combination with the fre-
quency counter produces tactile data in the form of
tissue stiffness values at discrete points. Frames from
video camera are analyzed using ARToolkit (AR-
Toolkit, 2006) software. Two markers are identified
and the position and orientation of the object and the
tactile sensor are established. Visible appearance of
the object marker is used for estimating a projection
matrix. A visualizer software module creates con-
tours or other visualization elements for the tactile
data and makes their proper superposition with frames
produced by the video camera. The result is real-time
AR visualization of the tactile data projected on the
patient’s body. The use of the AR system by a physi-
cian is illustrated by Fig.1b.
GRAPP 2007 - International Conference on Computer Graphics Theory and Applications
92

2.2 Hardware
The following hardware is used to implement the AR
system for real-time visualization of tactile data:
• Tactile sensor with a piezoelectric transducer
(PZT) developed at Nihon University (Omata and
Terunuma, 1992).
• Head-mounted display i-glasses PC/SVGA with
two miniature screens of SVGA (800×600) reso-
lution (i-O Display Systems).
• Video camera PYRO 1394 WebCam with VGA
(640×480) resolution and 30 frames per second
output through IEEE 1394 (FireWire) interface
(ADS Technologies).
• Notebook computer with 3.20 GHz Intel Pentium
4 and 1 GB memory.
• Rectangular paper markers.
The main part of the tactile sensor is a piezoelec-
tric transducer, which helps to estimate stiffness val-
ues of tissue near the surface of the skin. The mea-
surement principle is based on the phenomenon of
changing resonant frequency of the vibrating PZT as
it comes into contact with a material surface. The
changes in frequency are evaluated by the frequency
counter and transmitted to a computer through USB
interface. The tactile sensor produces single values of
tissue stiffness at each contact point. Since the mea-
surement act is immediate, it is not difficult to perform
numerous measurements at different points.
Two square markers of known size are utilized for
optical tracking. Tracking of the target object is per-
formed with the help of an object marker. A sensor
marker is used to determine location of the tactile sen-
sor tip and orientation of the sensor axis. In practice,
we used three markers attached to the top and sides
of the tactile sensor. Usually it is possible to discover
two of three markers and to use both for sensor tip
position determination with subsequent averaging.
3 TRANSFORMATIONS AND
SHAPE DETERMINATION
In order to apply AR to visualization of tactile data,
it is necessary to estimate camera parameters, space
orientation of the organ, and space locations of the
tactile sensor tip at measurement moments. Mathe-
matically these requirements are equivalent to deter-
mination of perspective transformation and rigid body
transformation matrices for the target object and for
the tactile sensor.
Camera
Sensor
T
s
To
ps
Sensor
marker
Object marker
p
o
Figure 2: Object, camera, sensor, and markers. The object
marker yields transformation matrices for projection. The
sensor marker is used for registration of sensor spacial po-
sitions.
3.1 Projection Matrix
The relationship between a projected (video) image
and a three-dimensional object is described by a 4
× 4 projection matrix. Using this matrix, computer-
generated objects can be overlaid on real-world ob-
jects. We use the open-source library ARToolkit to
track small square markers and to determine their
transformation matrices in real time. The relationship
between a camera screen coordinate system and an
object marker coordinate system (see Fig. 2) can be
expressed as
hx
c
hy
c
h
1
= P
X
c
Y
c
Z
c
1
= PT
o
X
o
Y
o
Z
o
1
, (1)
where h is a scale factor; (x
c
, y
c
) are the camera
screen coordinates ; (X
c
, Y
c
, Z
c
) are the camera co-
ordinates; (X
o
, Y
o
, Z
o
) are the object marker coordi-
nates; P is a perspective projection matrix, and T
o
is
a rigid transformation matrix from the object coordi-
nate system to the camera coordinate system.
The perspective projection matrix P is predeter-
mined by a camera calibration procedure with the
use of four vertices of the object marker. The rigid
transformation matrix T
o
for the object is calculated
in real-time. These matrices are specified inside the
usual computer graphics pipeline for drawing three-
dimensional objects correctly superimposed on video
frames.
3.2 Sensor Space Positions
To determine three-dimensional positions of points
where measurements of tissue stiffness are per-
formed, images of the sensor and object markers are
USING AUGMENTED REALITY FOR REAL-TIME VISUALIZATION OF TACTILE HEALTH EXAMINATION
93
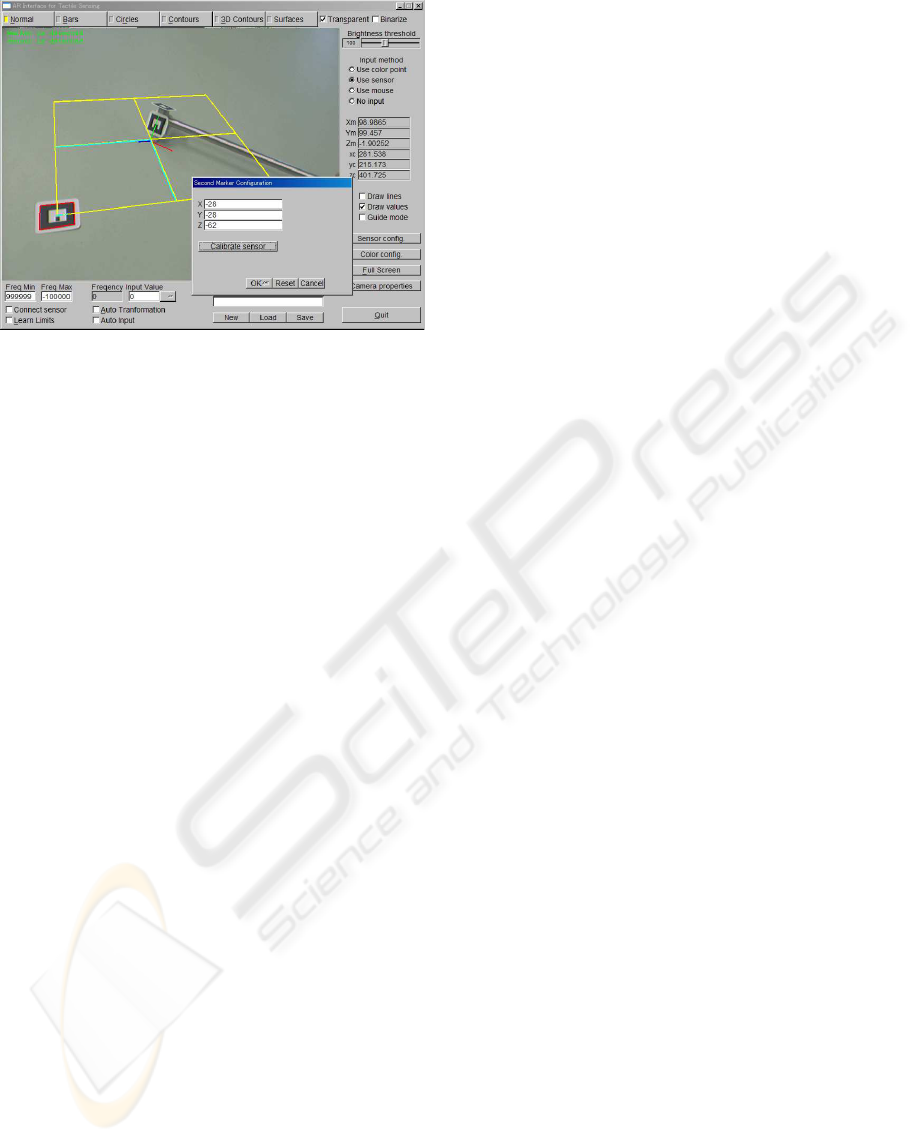
Figure 3: Estimating tip position p
s
for the tactile sensor.
For calibration, it is necessary to place the sensor tip at the
line intersection.
used. The measurement procedure with the use of two
markers is illustrated by Fig.2.
Let p
s
be a sensor tip position in the sensor marker
coordinate system. The same measurement position
in the object marker coordinate system p
o
is calcu-
lated as
p
o
= T
o
T
−1
s
p
s
. (2)
Here T
o
and T
s
are rigid body transformations from
the object coordinate system and from the sensor co-
ordinate system to the camera coordinate system, re-
spectively.
Since the sensor tip and the sensor marker do not
occupy same space position, a calibration procedure
is used to establish additional transformation from the
sensor marker to the sensor tip. The user interface for
calibrating the sensor is shown in Fig. 3. The object
marker is placed on a plane surface. Two lines in-
tersecting at z = 0 of the object marker plane are
drawn in video image. For calibration, the user puts
the sensor tip at the line intersection. The position p
s
is estimated as
p
s
= T
s
T
−1
o
p
i
, (3)
where p
i
is the position of line intersection in the ob-
ject marker coordinate system.
4 VISUALIZATION PROCEDURE
Our AR system provides real-time visualization of
tactile data in several forms depending on the amount
of data and user preference. New measurements of
stiffness values are immediately incorporated into the
graphical presentation. In the beginning of a mea-
suring process, when the number of measurements is
small, simple visualization like drawing points with
numerical values can be appropriate. As the number
of points accumulates, it is desirable to use more so-
phisticated visualization technique like contour maps.
During compositing of visualization pictures com-
bined with real-world video,the non-flat shape of
the target object (human organ under examination)
should be accommodated. Using sensor spatial po-
sitions, the surface of the human organ is constructed
and the visualization image is projected onto this sur-
face.
4.1 Surface and Data Approximation
During measurement process, spatial positions of the
tactile sensor tip are determined and recorded. These
positions are directly used in simple point-wise visu-
alization techniques like bars. For drawing smooth
contour graphs, it is necessary to derive smooth sur-
face approximations and possibly smooth data ap-
proximations. We have selected a multi-level B-
splines approximation (MBA) approach (Lee et al.,
1997). The B-spline surface is defined by a con-
trol lattice Φ over the approximation domain. Let
φ
ij
be the value at the ij-th control point on the lat-
tice Φ, where (i, j) for i = −1, 0, ..., m + 1 and
j = −1, 0, ..., n + 1, and m, n are numbers of control
points in x and y directions. Coordinates x and y are
normalized in such a way that 0 ≤ x < 1, 0 ≤ y < 1.
The B-spline approximation f is defined by
f(x, y) =
3
X
k=0
3
X
l=0
B
k
(s)B
l
(t)φ
(i+k)(j+l)
, (4)
where i = ⌊x⌋ − 1; j = ⌊y⌋ − 1:, s = x − ⌊x⌋;
t = y − ⌊y⌋; and B
k
and B
l
are the uniform cubic
B-spline basis functions. It is necessary to find values
for φ
ij
that yield the value z
c
at (x
c
, y
c
) as
z
c
=
3
X
k=0
3
X
l=0
B
k
(x
c
− ⌊x
c
⌋)B
l
(y
c
− ⌊ y
c
⌋)φ
kl
. (5)
Pseudo-inversion is used to find the values φ
ij
at the
control points. The approximation domain is sub-
divided hierarchically up to a specified level. The
surface created by the MBA is controlled by initial
(m
0
, n
0
) and final grid sizes (m
h
, n
h
). We use the
MBA approach for approximating both the shape of
the object and the tactile data with m
0
= n
0
= 1
and m
h
= n
h
= 256. The MBA approximation can
be done in real time since each new additional point
affects only 16 surrounding control points.
GRAPP 2007 - International Conference on Computer Graphics Theory and Applications
94
4.2 Visualization Techniques
Our graphical user interfaceenables several visualiza-
tion techniques. Switching among these visualization
techniques can be easily done at any time.
The visualization techniques of the AR system for
tactile data visualization include the following:
• Raw data. Tactile data is shown as points and
numbers, which represent measurement spatial lo-
cations and measured values.
• Circles. Circle centers correspond to the measure-
ment locations; circle areas are proportional to the
stiffness values; different circle colors are used for
different values.
• Bars. Measurement results are represented by
bars, drawn normal to the object marker. Bar
heights are proportional to result values. Colors
from magenta to red are used to draw bars for dif-
ferent measured values.
• Contours. Tactile data is presented as color con-
tours. Contour borders correspond to constant
stiffness values.
The first three techniques are useful for visual-
ization of small amounts of data. When more data
points are accumulated, the contour technique pro-
vides better visualization of measurements. For all
visualization techniques, it is possible to toggle and
adjust transparency of computer-generated objects in
order to avoid occlusion of the real-world objects.
Generation of contours is based on a texture inter-
polation algorithm. A triangular mesh with vertices
at the measurement points is created using Delaunay
triangulation. Coordinates of a one-dimensional color
texture (gradation strip) are specified at vertices of the
triangular mesh. A contour picture is formed by tex-
ture interpolation inside each triangle. If B-spline ap-
proximation is used, then a triangular mesh is gener-
ated on the basis of control points, and geometry and
stiffness values are interpolated for triangle vertices.
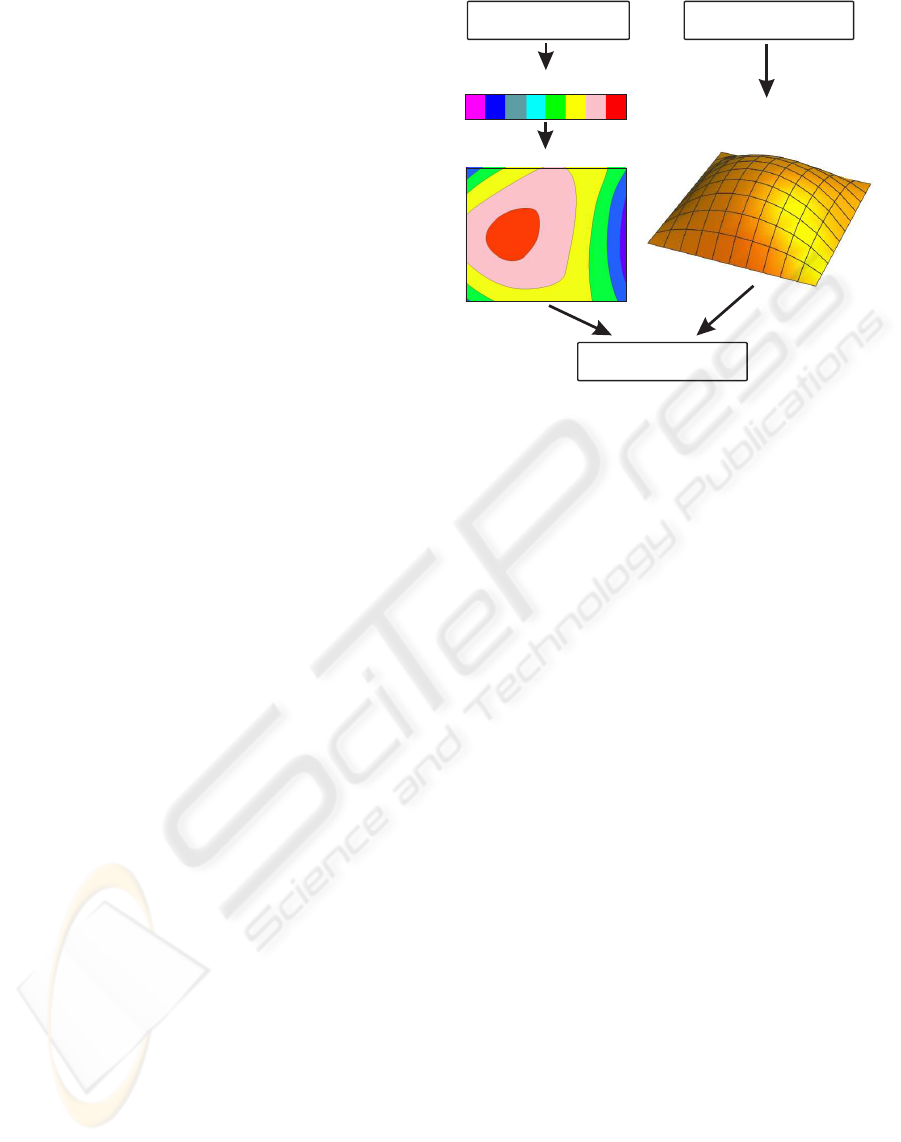
The contour map is rendered to texture memory
using orthographic projection. Then, the contour map
texture is applied to the approximated geometric sur-
face, which is rendered using perspective projection
with predetermined camera parameters. Fig. 4 illus-
trates the rendering procedure for visualization of tac-
tile information on an object surface.
4.3 Example of Visualization
Our augmented-reality visualization has been pro-
grammed in the C++ language. The OpenGL graph-
ics library and ARToolkit marker tracking library
are used for real-time visualization of tactile data.
Gradationstrip
Tactiledata
Sensorlocations
Contourmap
Geometricsurface
Framebuffer
Figure 4: Rendering procedure for visualization of the tac-
tile information on the object surface.
Around 40% of the CPU is typically ocupied during
real-time measurement and visualization procedure
on a notebook computer with 3.2 GHz Intel Pentium
4 processor.
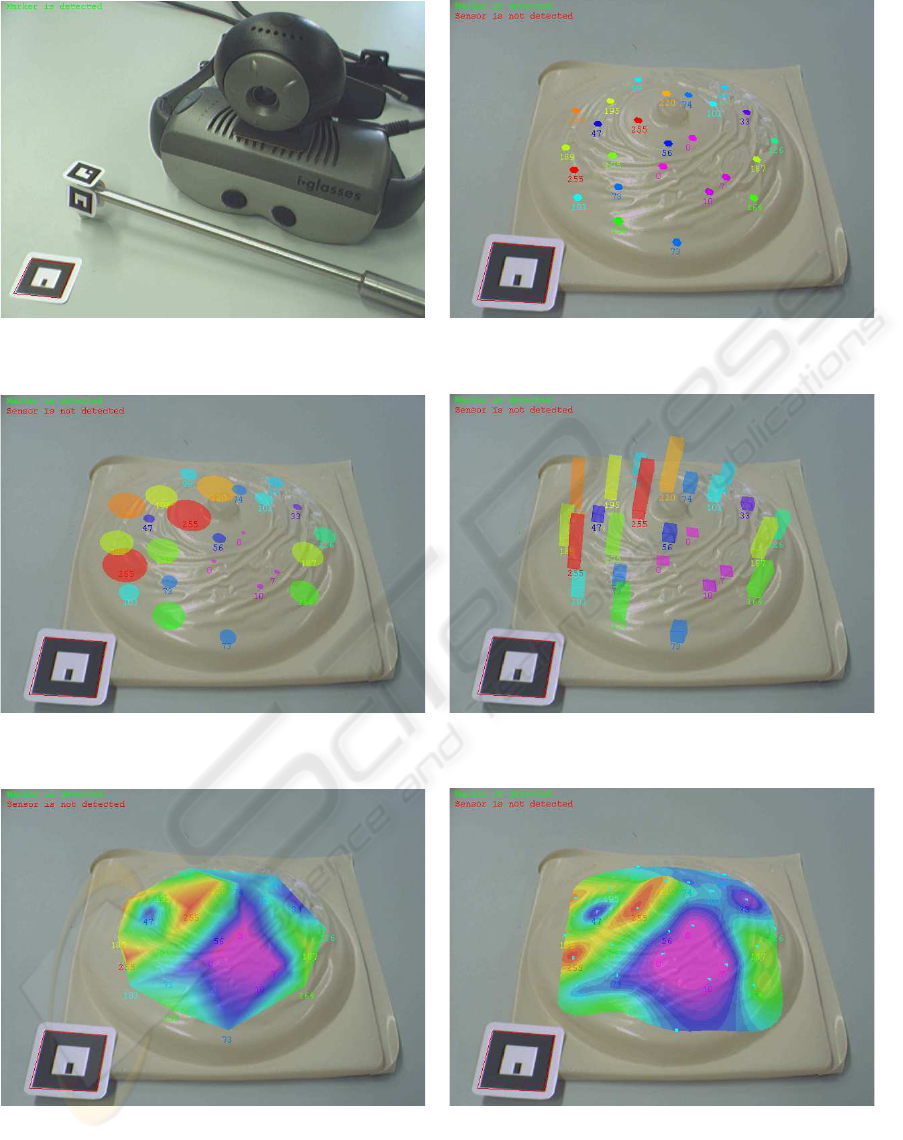
Fig.5 presents an example of tactile examination
using a breast cancer model. The head-mounted dis-
play with a video camera and a tactile sensor with
the markers are shown in Fig. 5a. Figs. 5b,c,d respec-
tively illustrate tactile data visualization as raw data,
circles, and bars. In Fig.5e data is represented as a
contour plot based on Delaunay triangulation. Be-
cause of small number of points, the contour picture is
not smooth. Contours produced with B-spline surface
and data approximation are shown in Fig.5f.
5 CONCLUSION
An augmented-realitysystem for support of tactile ex-
amination and for visualization of tissue stiffness data
has been developed. Visual tracking of two markers,
attached to the examined human organ and to the tac-
tile sensor, is used. The object marker allows deriva-
tion of transformation matrices for augmentation of
real-world video by computer generated information.
The sensor marker helps to register spatial positions
of the tactile sensor during measurements. Several vi-
sualization techniques are employed for AR presenta-
tion of tactile data. Simple data representations can be
used for small quantities of data. When enough data
is accumulated, the measured stiffness values are ap-
proximated by multi-level B-splines and depicted as
contours projected on the human organ.
USING AUGMENTED REALITY FOR REAL-TIME VISUALIZATION OF TACTILE HEALTH EXAMINATION
95
a b
c d
e f
Figure 5: Snapshots of sensing breast cancer model: a) head-mounted display with a video camera and a tactile sensor with
the markers; b) raw stiffness data; c) circles; d) bar representation; e) contours based on Delaunay triangulation; f) contours
generated with B-spline approximation.
GRAPP 2007 - International Conference on Computer Graphics Theory and Applications
96

The developed augmented-reality system has been
tested on a breast cancer model and in experiments
with internal animal organs. The correct combination
of virtual objects with real-world video at reasonable
frame rates with acceptable picture delay have been
confirmed. While hand palpation implies involvement
of a highly qualified physician, it is possible to imag-
ine that the developed AR system could be used for
remote diagnosis since it does not require high medi-
cal skills.
A video demonstrating the use of the system is
available at http://www.u-aizu.ac.jp/ niki/research/ar/.
REFERENCES
ARToolkit, http://www.hitl.washington.edu/artoolkit/.
Azuma, R.T. (1997) A Survey of Augmented Reality. Tele-
operators and Virtual Environments, 6: 355–385.
Bajura, M., Fuchs, H. and Ohbuchi, R. (1992) Merging vir-
tual objects with the real world: Seeing ultrasound
imagery within the patient. Computer Graphics, 26:
203–210.
Balasingham, I., Samset, E., Hansen, A. and Audral L.
(2003) An interactive augmented reality 3D visualiza-
tion system for destroying liver tumor using cryoabla-
tion. International Congress Series, 1256: 690–695.
Birkfellner, W., Figl, M., Huber, K. et al. (2002) A head-
mounted operating binocular for augmented reality vi-
sualization in medicine: design and initial evaluation.
IEEE Trans Medical Imaging, 21: 991–997.
Das, M., Sauer, F., Schoeph, U.J. et al. (2006) Augmented
reality visualization for CT-guided interventions: sys-
tem description, feasibility and initial evaluation in an
abdominal phantom. Radiology, 240: 230–235.
Girnyk, S., Barannik, A., Barannik, E. et al. (2006). The
estimation of elasticity and viscosity of soft tissues in
vitro using the data of remote acoustic palpation. Ul-
trasound in medicine and biology, 32: 211–219.
Kaufman, C.S., Jacobson, L., Bachman, B.A. and Kauf-
man, L.B. (2006). Digital documentation of the phys-
ical examination: moving the clinical breast exam to
the electronic medical record. The American Journal
of Surgery 192: 444-449.
Kearney, T.J., Airapetian, S. and Sarvazyan, A. (2004).
Tactile breast imaging to increase the sensitivity of
breast examination. Journal of Clinical Oncology,
2004 ASCO Annual Meeting Proceedings, 22: 1037.
Konishi, K. et al. (2005) Augmented reality naviga-
tion system for endoscopic surgery based on three-
dimensional ultrasound and computed tomography:
Application to 20 clinical cases. Int. Congress Series,
1281: 537–542.
Lee, S., Wolberg, G. and Shin, S.Y. (1997) Scattered data
interpolation, IEEE Trans. on Visualization and Com-
puter Graphics, 3: 228–244.
Omata, S. and Terunuma, Y. (1992). New tactile sensor like
the human hand and its applications. Sensor and Ac-
tuators A, 35: 9–15.
Rosenthal, M., State, A., Lee, J. et al. (2002) Augmented
reality guidance for needle biopsies: an initial ran-
domized, controlled trial in phantoms. Medical Image
Analysis, 6: 313–320.
Sakas, G. (2002) Trends in medical imaging: from 2D to
3D. Computers and Graphics, 26: 577–587.
Srikanchana, R., Wang, Y.J., Freedman, M.T. and Nguyen,
C.C. (2002). Tactile imaging of palpable breast can-
cer. Medical Imaging 2002: Physics of Medical Imag-
ing (L.E. Antonuk, M.J. Yaffe Eds.), Proc. SPIE, 4682:
792–800.
USING AUGMENTED REALITY FOR REAL-TIME VISUALIZATION OF TACTILE HEALTH EXAMINATION
97
