
VISUAL SPEECH SYNTHESIS FROM 3D VIDEO
J. D. Edge and A. Hilton
Centre for Vision, Speech and Signal Processing
School of Electronic and Physical Sciences, University of Surrey, Guildford, GU2 7XH, UK
Keywords:
Facial Animation, Speech Synthesis, Virtual Humans.
Abstract:
Data-driven approaches to 2D facial animation from video have achieved highly realistic results. In this paper
we introduce a process for visual speech synthesis from 3D video capture to reproduce the dynamics of 3D
face shape and appearance. Animation from real speech is performed by path optimisation over a graph repre-
sentation of phonetically segmented captured 3D video. A novel similarity metric using a hierarchical wavelet
decomposition is presented to identify transitions between 3D video frames without visual artifacts in facial
shape, appearance or dynamics. Face synthesis is performed by playing back segments of the captured 3D
video to accurately reproduce facial dynamic s. The framework allows visual speech synthesis from captured
3D video with minimal user intervention. Results are presented for synthesis from a database of 12minutes
(18000 frames) of 3D video which demonstrate highly realistic facial animation.
1 INTRODUCTION
In recent years the use of data-driven techniques
to produce realistic human animations have become
more prevalent. The use of video and motion-capture
data allows us to improve the visual realism of a syn-
thetic character without the complexities involved in
physical simulation. Unfortunately, whilst video data
is lifelike, it is also constrained to the 2D image plane.
Furthermore motion-capture technologies are marker-
based and so prevent the recovery of skin texture dur-
ing data capture. 3D video capture technology uses
stereo-reconstruction techniques to capture both the
texture and geometry of the facial surface thereby pro-
viding a best compromise solution to animating real-
istic human characters.
One of the most difficult problems in animation
is reproducing the visible aspects of speech. It is
the method of communication that we use every day,
and any viewer will instantly spot any disparity with
everyday reality. When we see someone speaking
the movements of the articulators (tongue, jaw, lips
etc.) is actually creating the sounds that we hear, and
we know there is a high correlation between what is
seen and heard (e.g. lip-reading (Sumby and Pollack,
1954) and the McGurk effect (McGurk and Mac-
Donald, 1976).) Whereas traditional animation tech-
niques are adequate for creating cartoon-like speech,
we need more complex models to accurately synthe-
size realistic human speech movements. Data-driven
techniques are particularly appropriate to this prob-
lem because they remove the need to directly model
the dynamics of speech by retrieving this information
from a real speaker. In this paper we introduce a data-
driven technique which uses 3D video capture tech-
nology to animate realistic speech movements.
Our process of producing a talking head works on
a similar basis to Video-Textures (Sch
¨
odl et al., 2000).
We capture sequences of 3D speech movements and
organise this data into a graph structure consisting of
nodes representing dynamic phonetic units with con-
necting arcs representing optimal transitions. Speech
synthesis is achieved by traversing this graph accord-
ing to the phonetic structure of an input utterance. An-
imations consist simply of playing back frames of the
original captured data with no blending/interpolation
required. Our process of creating a talking head has
been designed to as far as possible remove the neces-
sity for any manual intervention or reliance upon sen-
sitive computer vision algorithms.
57
D. Edge J. and Hilton A. (2007).
VISUAL SPEECH SYNTHESIS FROM 3D VIDEO.
In Proceedings of the Second International Conference on Computer Graphics Theory and Applications - AS/IE, pages 57-62
DOI: 10.5220/0002080400570062
Copyright
c
SciTePress

2 BACKGROUND
Visual speech synthesis is complicated by the fact that
when producing sequences of speech sounds, the ac-
tion of the articulators in the vocal tract are greatly
affected by speech context. This context-dependency
of speech is often termed ’coarticulation’ (L
¨
ofqvist,
1990). The physical phenomena occurs bidirection-
ally, that is articulation is affected by both preceeding
and upcoming speech movements. Furthermore, cer-
tain aspects of speech are more important than others;
for example position of the tongue whilst producing
a /T,D/ (as in thin or this) sound exhibits low varia-
tion and is therefore a highly dominant feature, whilst
jaw rotation for vowel sounds exhibits high variation
and has little affect on surrounding speech segments.
The simulation of coarticulation is highly important
for the naturalness of any speech synthesis technique
(both audible and visual.) Typically, coarticulation is
simulated using a form of spline blending of articula-
tory parameters (Ezzat et al., 2002; Cohen and Mas-
saro, 1993).
More recently, captured dynamics have been di-
rectly used in the synthesis of visual speech. This mir-
rors the most common method of audible speech syn-
thesis which takes captured audio data and concate-
nates small sections to form novel utterances (Taylor
et al., 1998). In Video-Rewrite (Bregler et al., 1997)
triphone sequences of video data are concatenated to
synthesize lip movements which are then pasted onto
a background sequence of head movement improving
the naturalness of the output animation. In (Kalberer
and Van Gool, 2002) a model of speech movements
is captured using markers, then a viseme-space is
constructed using statistical methods and navigated
to synthesize new utterances. In (Cao et al., 2003;
Kshirsagar and Magnenat-Thalmann, 2003) motion-
captured facial movements are used to drive a 3D
model-based synthesis technique. These techniques
inherit from earlier work on motion graphs for body
motion capture data (Kovar et al., 2002).
The main difference between the audio and visual
concatenative methods is that it is more difficult to
capture facial movement than audio. Whilst facial dy-
namics have traditionally been captured using mark-
ers, recently surface capture techniques have been de-
veloped which provide greater spatial resolution in
3D (Wang et al., 2004; Ypsilos et al., 2004; Zhang
et al., 2004). Surface capture has the added benefit
that surface texture can be simultaneously captured -
providing fine detail of skin wrinkles and creases that
will always be invisible to marker-based technologies.
In our work surface capture technology is used to pro-
vide data for speech synthesis.
3 OUR APPROACH
The technique for visual speech synthesis introduced
here relies upon the concatenation of small phonetic
units representing the variation in the dynamics of
natural speech movements. Our approach can be sum-
marised into several phases:
• Data Capture (Section 3.1) - A database of nat-
ural speech utterances are captured from an ac-
tor. These utterances contain the variations, due to
coarticulation, in speech articulation. The speech
data consists of 3D video and phonetically la-
belled audio of a news corpus.
• Graph Construction (Section 3.3) - The speech
data is split into phonetic units, and transition
probabilities between all units in the captured cor-
pus are calculated. This leads to a graph structure,
subsets of which are traversed during synthesis.
Transition probabilities are related to the similar-
ity of frames in different phonetic units.
• Unit Selection (Section 3.4) - For a given output
utterance, split into its phonetic constituents, ap-
propriate units (dynamic phonemes) are selected
from the constructed motion graph. Selection
is performed using a Viterbi algorithm which
maximises the probability of a sequence of units
which match the phonetic structure of the output
utterance.
• Animation (Section 3.5) - Selected phonetic units
are resampled and played back with the audio to
animate the speech utterance. No interpolation or
processing of the frames is performed, the final
animation is simply a re-ordering of frames from
the initial speech corpus.
Our system has been designed to minimise the
manual intervention required to create new talking
heads. All the above stages beyond data capture can
be performed automatically, and the only intervention
currently required is to correct the automatic phonetic
labelling of captured audio.
3.1 Data Capture
All data-driven techniques require a significant initial
data capture to represent the range of possibilities in
synthesis. In our system the data capture consists of
words and sentences from a news corpus spoken by
an actor. The actor is captured using a custom 3D
face capture rig (see (Ypsilos et al., 2004)), which re-
constructs facial geometry (200×200 scalar elliptical
depth maps) and texture (512 × 512 RGB images).
Audio is captured simultaneously and phonetically la-
belled to facilitate the construction of a motion graph.
GRAPP 2007 - International Conference on Computer Graphics Theory and Applications
58

In total 12 minutes of audio/video data has been
captured to drive our talking head. It is most im-
portant to capture a large number of consonant units,
as these units visually structure speech whereas vow-
els are usually transitional movements. It is also the
case that vowels may to a large degree be interchange-
able, although this is not currently implemented in
our system. Other than voiced/voiceless contrasts
we maintain all phonetic distinctions in the database,
mainly because a viseme reduction is less valid when
the units themselves are dynamic (i.e. the central
frame may be the same, but the articulatory movement
may exhibit a high degree of variation even within a
viseme class.)
3.2 Similarity Metric
In order to optimally construct a transition graph
of the 3D video data a similarity metric is required
to compare individual frames. Each frame consists
of both geometry and texture, which should both
be taken into account when determining similarity
(F
i
= {G
i
, T
i
}). This section describes the creation
of a similarity metric between 3D video frames, i.e.
dist(F
i
, F
j
) → R.
In (Sch
¨
odl et al., 2000) a simple L2 similarity met-
ric is used to recover transitions between 2D video
frames, however we have found that the effect of
noise (e.g. sensor noise, geometry reconstruction er-
ror) upon this metric is highly detrimental and leads
to poor output transition graphs. This is due to the
high dimensionality of each frame in the original data
((200 × 200) + (3 × 512 × 512) = 826432 scalar
values per frame). In (Ezzat et al., 2002) principal
components analysis (PCA) is used as a dimension-
ality reduction technique on 2D video, unfortunately
given the size of the database used here (18000 frames
×826432 scalar values) makes traditional PCA tech-
niques unviable. It is also important to note that tra-
ditional PCA applied by compressing each 2D im-
age frame into a single vector does not optimally ac-
count for spatial redundancies in the data (Shashua
and Levin, 2001). To make up for these limitations we
apply a hierarchical variant of PCA which accounts
well for both spatial and temporal redundancies in the
data and is more efficient to create with very large
databases. The projection into this low dimensional
space is used to provide a similarity metric between
3D video frames.
A wavelet decomposition of a signal (e.g. a
row/column of image data) is a frequency represen-
tation produced by projecting onto a wavelet basis
(e.g. Haar, Daubechies etc.) The decomposition con-
sists of a signal average V
0
and sets of wavelet co-
time
time
signal
average
wavelet
coefficients
signal
average
wavelet
coefficients
Figure 1: Each frame (both texture and geometry) in the
database is converted to wavelet coefficients, and the prin-
cipal components of these coefficients over time are used
to define a similarity metric. This examples show only two
levels of the wavelet decomposition.
efficients W
m
. Any level of the frequency hierarchy
(V
0
⊂ V
1
⊂ V
2
⊂ . . . V
m
. . . ⊂ V
n
) can be recon-
structed using the W
m
and scaled/shifted basis func-
tions ψ
m
. If a sequence of images is decomposed into
wavelet coefficients, we can apply PCA to the W
m
to
recover a model of how different spatial frequencies
change over time.
W
m
= µ
W
m
+
X
k
(b
m
k
.V
m
k
) (1)
In (1), µ
W
m
is the mean of the W
m
coefficients
over time, the V
m
k
are the principal components rep-
resenting the important variations of the W
m
over
time. The b
m
k
give a projection onto the recovered
principal components, and act as the parameterisa-
tion of the original image sequences. The proposed
wavelet/PCA decomposition explicitly localises vari-
ation spatially (i.e. the wavelet transformation) and
temporally (i.e. the principal components). This
wavelet/PCA combination is demonstrated in fig. 1.
In practice we decompose each frame (both tex-
ture and geometry) using a Haar wavelet basis in an
alternating row/column scheme (the non-standard ap-
proach described in (Stollnitz et al., 1995).) A 3×3×3
(rows × columns × frames) spatio-temporal median
filter is applied to the highest-frequency components
of the wavelet transform, which is used to attenuate
noise spikes in the data. From the projection onto the
V
m
k
(the principal components across all frequencies)
10 components are selected which account for over
95% of the variance in the data, this is the basis used
for comparison. The similarity metric, dist, is defined
as the L2 distance between frames projected onto the
selected basis. We do not use the Mahalanobis dis-
tance, as used in (Ezzat et al., 2002), because this
gives too much weight to low variance components
which are relatively insignificant when determining
VISUAL SPEECH SYNTHESIS FROM 3D VIDEO
59
similarity.
The similarity of any two frames in the database
can now be determined using the selected basis. This
distance can now be converted into a frame-to-frame
transition probability.
P (F
i
, F
j
) = exp
−dist(F
i
, F
j
)
σ
(2)
In (2) σ is a constant which relatively scales the
probability of transitioning between two frames (in
our system set to half the average distance between
frames, µ
dist
.) This allows the construction of a
matrix containing transition probabilities between all
frames in the stored data. In a final step we apply
a small (3 frame window) diagonal filter to the data
similar to (Sch
¨
odl et al., 2000), this incorporates a no-
tion of derivative similarity in the transition probabil-
ity. This transition matrix is used in the construction
of a transition graph between dynamic phonetic units.
3.3 Graph Construction
The synthesis of speech movements is based upon
the traversal of a graph representing the phonetic
structure of the captured data. For these purposes
phonemes are considered to be sequences of frames
from the centre of the previous phoneme to the cen-
tre of the following phoneme. Furthermore, we merge
voiced/voiceless contrasts in our phoneme units (e.g.
/p/ and /b/ are considered to be the same unit), which
maximises the available dynamic units available in
the database. It is important to note that we only
merge voiced/voiceless consonant contrasts; often
nasals are also combined, e.g. /m/ is often merged
with the /p,b/ group, yet these are not dynamically the
same and so this is not advisable in a concatenative
system.
The units are similar to what are often considered
as triphones (e.g. in (Bregler et al., 1997)), however,
only the central phonetic label of the unit is used dur-
ing synthesis (i.e. no phonetic context is explicitly
taken into account) thus we refer to these as dynamic
phonemes. This is an important distinction because
triphone synthesis typically requires many more units
to be captured. By disregarding the previous and fol-
lowing phonetic labels, and matching only accord-
ing to similarity, we can maximise the use of smaller
speech databases.
Each phonetic unit consists of two periods, the
onset (between the start of the unit and its phonetic
centre) and the offset (between the phonetic centre
and the end of the unit.) Possible graph transitions
→
q
i
q
j
between phoneme states q
i
and q
j
occur be-
tween frames in the offset of q
i
and frames in the
h
@
l
@U
time
. . .
. . .
. . . . . .
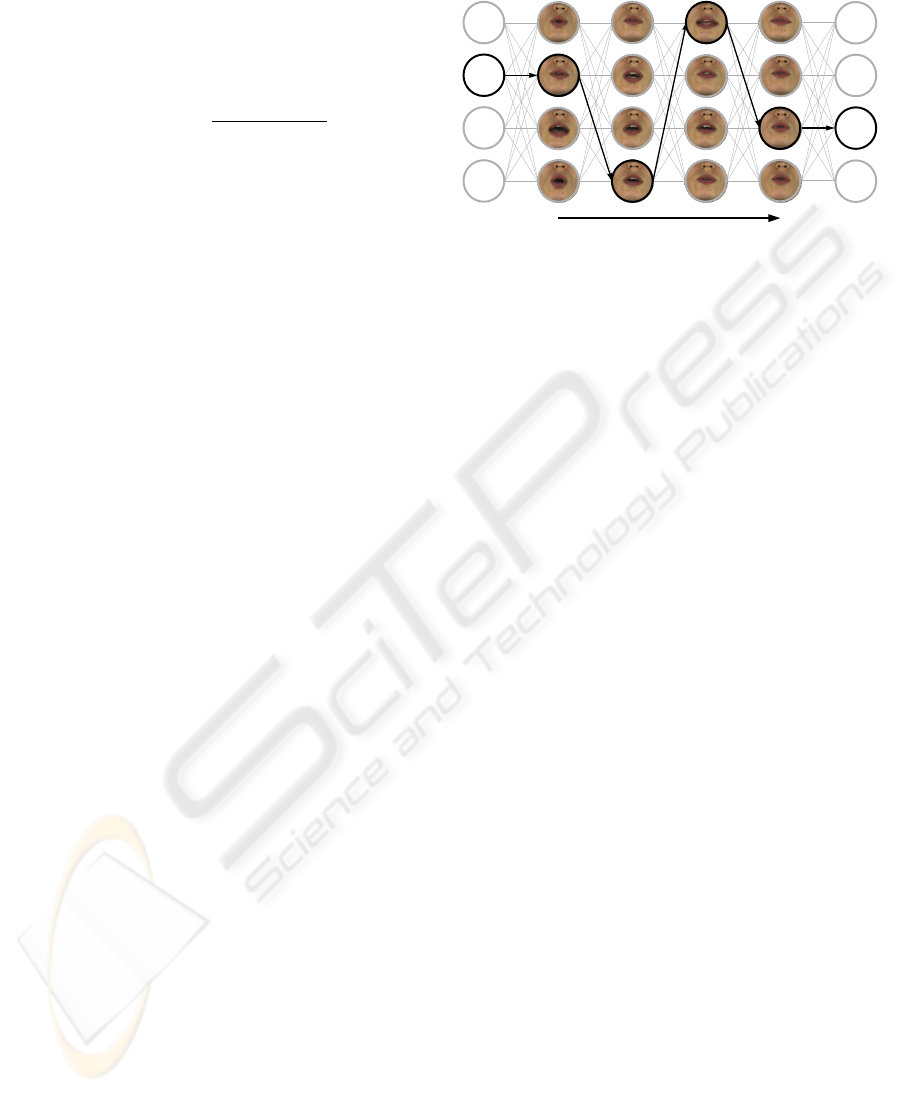
Figure 2: A graph of nodes representing dynamic-
phonemes is constructed, each node is connected to each
of the following phonetic units in the sequence, the Viterbi
algorithm is used to find the least expensive path (shown in
bold) matching an input utterance.
onset of q
j
. There will only be one optimal ’stitch-
ing’ point between the two sequences, the point at
which the frame-to-frame transition probability (see
Section 3.2) is highest, therefore we have a directed
graph with transition probabilities between each dis-
crete state.
In the data set we have captured there are 1314
phonetic units, from a set of 38 British English
phonemes, giving 1314
2
possible transitions. By
thresholding out low probability transitions and prun-
ing the graph according to phonotactic rules (e.g. bi-
labial plosives cannot occur sequentially) and remov-
ing within-state transitions the search space to be tra-
versed during synthesis can be greatly reduced. The
number of phonemes represented in the graph could
potentially be reduced further, as the main differ-
ence between many speech sounds is the position of
the tongue which is virtually indistinguishable in our
data (except in some key examples such as /T,D/, e.g.
thing.) However, we did not follow this route be-
cause often the dynamic properties of phonemes are
distinct even when the central lip pose is very similar.
The size of our speech database allows us to represent
phonemes and not resort to a coarse viseme reduction.
3.4 Unit Selection
The constructed phonetic graph structure allows syn-
thesis to be formulated as a Markov process, i.e.
the transition between phoneme states is independent
of previously traversed states (3). This is obvious,
given that the probability of transitioning between any
two phoneme states in the graph depends only upon
the similarity of frames (as defined in Section 3.2.)
Thus, given a sequence of phoneme states (e.g. ’good
GRAPP 2007 - International Conference on Computer Graphics Theory and Applications
60
evening’ → /g/,/U/,/d/,/i:/,/v/,/n/,/I/,/N/) we must select
the best sequence of states from the constructed graph
(see fig. 2) which visually represent these speech
sounds. One of the most common methods for doing
this is the Viterbi algorithm.
P (q
i
, . . . , q
n
) =
n
Y
i=1
P (q
i
|q
i−1
) (3)
The Viterbi algorithm is a recursive solution to
finding the best sequence of states matching a se-
ries of observations (i.e. the phonemes.) Given the
Markov assumption (3), we can calculate the best
probability from any of the possible initial states q
0
optimally by determining best partial paths to inter-
mediate q
i
states which are reused in the calculation
of the q
i+1
transition. This is a fast method of finding
the best n states to match the phonetic input.
For the previous example (’good evening’) each
of the phonemes is a state in the Viterbi search,
with m possibilities (where m is the number of
examples of that phoneme in the database.) So each
state may have a different number of alternatives,
as the database does not have a uniform sampling
of all phonemes. Therefore the probability of a
sequence, P (g
5
, U
3
, d
6
) will be the product of the
transition probabilities
→
g
5
U
3
×
→
U
3
d
6
(where
→
xy is
the scalar transition probability from x → y). The
Viterbi algorithm simply reformulates this potentially
exhaustive search into a series of subproblems, e.g.
{g
best
{U
best
{d
best
{i:
best
{v
best
{n
best
{I
best
, N
best
}}}}}}},
where the innermost problem is tackled first and re-
cursively the inner problems accumulate to construct
the best path from all possible states.
Note that audio parameters (e.g. cepstral coeffi-
cients) are not used to optimize the chosen states (e.g.
as seen in (Cosatto and Graf, 2000)), this could be
added as a further term to allow animation directly
from speech audio with no intermediate phonetic tran-
scription. We find that optimising on the transition
probabilities alone provides smooth transitions which
is the most important factor in creating high qual-
ity animation. A further advantage being that where
sequences of phonemes in the target utterance are
present in the training data they will be selected as a
sequence (because the transition probability between
sequential units will be 1). The unit selection proce-
dure intentionally biases toward long contiguous se-
quences in the original captured data, which will max-
imize the quality by reducing the number of synthetic
jumps. Note that the Viterbi graph search is perform-
ing a similar role to the greedy tile-matching proce-
dure used in (Cao et al., 2003), but will not choose
long sequences if they have a high associated transi-
tion cost with surrounding units. Tile-matching biases
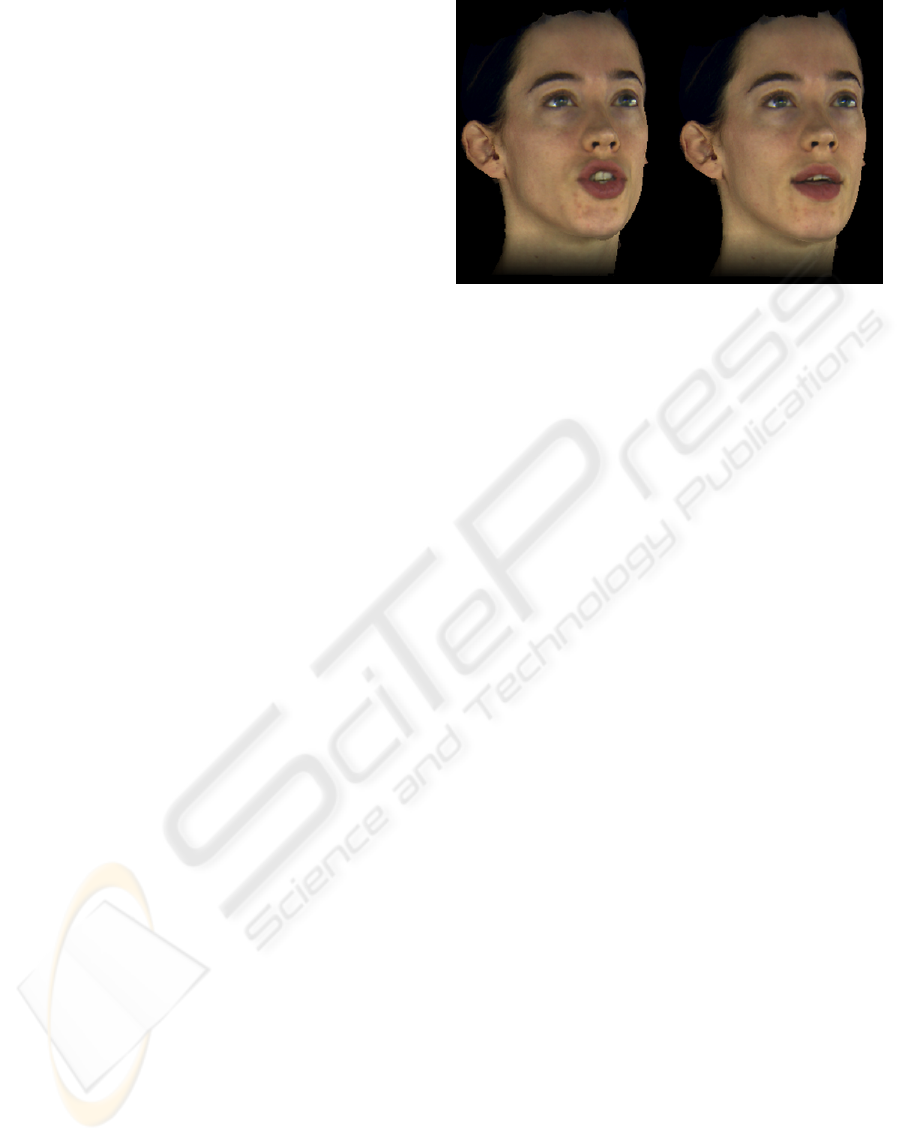
Figure 3: Frames from a synthetic utterance.
toward longest units at the expense of possible poor
transitions because boundary matching has no associ-
ated cost (except where there are two competing units
of the same length.) We would assert that the Viterbi
algorithm is a better all around solution.
3.5 Animation
Our system only requires a rudimentary treatment of
animation. Frames from a synthetic sequence can be
seen in fig. 3. Since our raw data is 3D video of an
actors face there is no necessity for complicated facial
models or deformation techniques. The output of unit
selection is a sequence of dynamic phonemes (i.e. se-
quences of frames from our initial data) and relative
timings with the input utterance (i.e. the disparities
between phoneme centres in the input utterance and
our dynamic phonemes.) We use simple linear scal-
ing to align selected units correctly with the utterance
audio, and where the stretching/squashing of the dy-
namic phonemes leads to a misalignment of frames
in the two sequences the closest frame is chosen (i.e.
no interpolation of frames.) The only intervention in
the final animation is to use a noise function to apply
random low-magnitude rotations to the head with re-
spect to the neck. This prevents the synthetic charac-
ter from appearing too static, as can be seen in many
2D video-based talking heads.
Animations created using our system show several
advantages over traditional mocap techniques (Cao
et al., 2003; Kshirsagar and Magnenat-Thalmann,
2003). By capturing the surface texture of the actor
simultaneously with the geometry we can recover and
display high resolution features which would be lost
using techniques such as motion-capture. It is also
noticeable that that idiosyncrasies particular to our
speaker are captured, an obvious example for our ac-
tor is the asymmetrical way that she opens her mouth.
VISUAL SPEECH SYNTHESIS FROM 3D VIDEO
61

The quality of animations generated using our synthe-
sis technique are on a similar to those produced from
2D video (e.g. (Ezzat et al., 2002; Brand, 1999; Bre-
gler et al., 1997)), with the added advantages of full
control of orientation.
4 CONCLUSIONS
A data-driven approach to 3D visual speech synthesis
based on captured 3D video of faces has been pre-
sented. Recent advances in 3D video capture have
achieved simultaneous video-rate acquisition of facial
shape and appearance. In this paper we have intro-
duced face synthesis based on a graph representation
of a phonetically segmented 3D video corpus. This
approach is analogous to previous work in face syn-
thesis by resampling 2D video (Bregler et al., 1997)
and 2D video textures(Sch
¨
odl et al., 2000). Face
synthesis for novel speech utterances is achieved by
optimisation of the path through the graph and con-
catenation of segments of the captured 3D video. A
novel metric using a hierarchical wavelet decomposi-
tion is introduced to identify transitions between 3D
video frames with similar facial shape, appearance
and dynamics. This metric allows efficient compu-
tation of the similarity between 3D video frames for
a large corpus to produce transitions without visual
artifacts. Results are presented for facial synthesis
from a corpus of 12minutes (18000 frames) of 3D
video. Visual speech synthesis of novel sentences
achieves a visual quality comparable to the captured
3D video allowing highly realistic synthesis without
post-processing. The data-driven approach to 3D face
synthesis requires minimal manual intervention be-
tween 3D video capture and facial animation from
speech. Future extensions to the system introducing
expression and secondary facial movements in a thor-
oughly engaging synthetic character are foreseen.
REFERENCES
Brand, M. (1999). Voice puppetry. In Proceedings of
SIGGRAPH ’99, pages 21–28, New York, NY, USA.
ACM Press/Addison-Wesley Publishing Co.
Bregler, C., Covell, M., and Slaney, M. (1997). Video
rewrite: driving visual speech with audio. In Pro-
ceedings of SIGGRAPH ’97, pages 353–360, New
York, NY, USA. ACM Press/Addison-Wesley Pub-
lishing Co.
Cao, Y., Faloutsos, P., and Pighin, F. (2003). Unsupervised
learning for speech motion editing. In Eurograph-
ics/ACM SIGGRAPH Symposium on Computer Ani-
mation ’03, pages 225–231.
Cohen, M. and Massaro, D. (1993). Modeling coarticula-
tion in synthetic visual speech. In Computer Anima-
tion ’93, pages 139–156.
Cosatto, E. and Graf, H. (2000). Photo-realistic talking
heads from image samples. IEEE Transactions on
Multimedia, 2(3):152–163.
Ezzat, T., Geiger, G., and Poggio, T. (2002). Trainable vide-
orealistic speech animation. In Proceedings of SIG-
GRAPH ’02, pages 388–398, New York, NY, USA.
ACM Press.
Kalberer, G. and Van Gool, L. (2002). Realistic face ani-
mation for speech. Journal of Visualization and Com-
puter Animation, 13(2):97–106.
Kovar, L., Gleicher, M., and Pighin, F. (2002). Motion
graphs. In Proceedings of SIGGRAPH ’02, pages
473–482, New York, NY, USA. ACM Press.
Kshirsagar, S. and Magnenat-Thalmann, N. (2003). Visyl-
lable based speech animation. In Eurographics’03,
pages 632–640.
L
¨
ofqvist, A. (1990). Speech as audible gestures. In Hard-
castle, W. and Marchal, A., editors, Speech Produc-
tion and Speech Modeling, pages 289–322. Kluwer.
McGurk, H. and MacDonald, J. (1976). Hearing lips and
seeing voices. Nature, (264):746–748.
Sch
¨
odl, A., Szeliski, R., Salesin, D. H., and Essa, I.
(2000). Video textures. In Proceedings of SIG-
GRAPH ’00, pages 489–498, New York, NY, USA.
ACM Press/Addison-Wesley Publishing Co.
Shashua, A. and Levin, A. (2001). Linear image coding
for regression and classification using the tensor-rank
principle. In Proceedings of the 2001 IEEE Computer
Society Conference on Computer Vision and Pattern
Recognition., pages 42–49.
Stollnitz, E., DeRose, T., and Salesin., D. (1995). Wavelets
for computer graphics: A primer. 15:76–84.
Sumby, W. and Pollack, I. (1954). Visual contribution to
speech intelligibility in noise. 26:212–215.
Taylor, P., Black, A., and Caley, R. (1998). The architecture
of the the festival speech synthesis system. In Third
International Workshop on Speech Synthesis.
Wang, Y., Huang, X., Lee, C.-S., Zhang, S., Li, Z., Samaras,
D., Metaxas, D., Elgammal, A., and Huang, P. (2004).
High resolution acquisition, learning and transfer of
dynamic 3-d facial expressions. In Eurographics’04,
pages 677–686.
Ypsilos, I., Hilton, A., and Rowe, S. (2004). Video-rate
capture of dynamic face shape and appearance. In 6
th
IEEE International Conference on Automatic Face
and Gesture Recognition, pages 117–123.
Zhang, L., Snavely, N., Curless, B., and Seitz, S. (2004).
Spacetime faces: high resolution capture for model-
ing and animation. ACM Transactions on Graphics,
23(3):548–558.
GRAPP 2007 - International Conference on Computer Graphics Theory and Applications
62
