
CONCAVE HULL: A K-NEAREST NEIGHBOURS APPROACH
FOR THE COMPUTATION OF THE REGION OCCUPIED BY A
SET OF POINTS
Adriano Moreira and Maribel Yasmina Santos
Department of Information Systems, University of Minho
Campus de Azurém, Guimarães, Portugal
Keywords: Concave hull, convex hull, polygon, contour, k-nearest neighbours.
Abstract: This paper describes an algorithm to compute the envelope of a set of points in a plane, which generates
convex or non-convex hulls that represent the area occupied by the given points. The proposed algorithm is
based on a k-nearest neighbours approach, where the value of k, the only algorithm parameter, is used to
control the “smoothness” of the final solution. The obtained results show that this algorithm is able to deal
with arbitrary sets of points, and that the time to compute the polygons increases approximately linearly
with the number of points.
1 INTRODUCTION
The automatic computation of a polygon that
encompasses a set of points has been a topic of
research for many years. This problem, identified as
the computation of the convex hull of a set of points,
has been addressed by many authors and many
algorithms have been proposed to compute the
convex hull efficiently (Graham, 1972; Jarvis, 1973;
Preparata, 1977; Eddy, 1977). These algorithms
compute the polygon with the minimum area that
includes all the given points (or minimum volume
when the points are in a three-dimensional space). In
this context, given a set of points, there is a single
solution for the convex hull.
For certain applications, however, the convex
hull does not represent well the boundaries of a
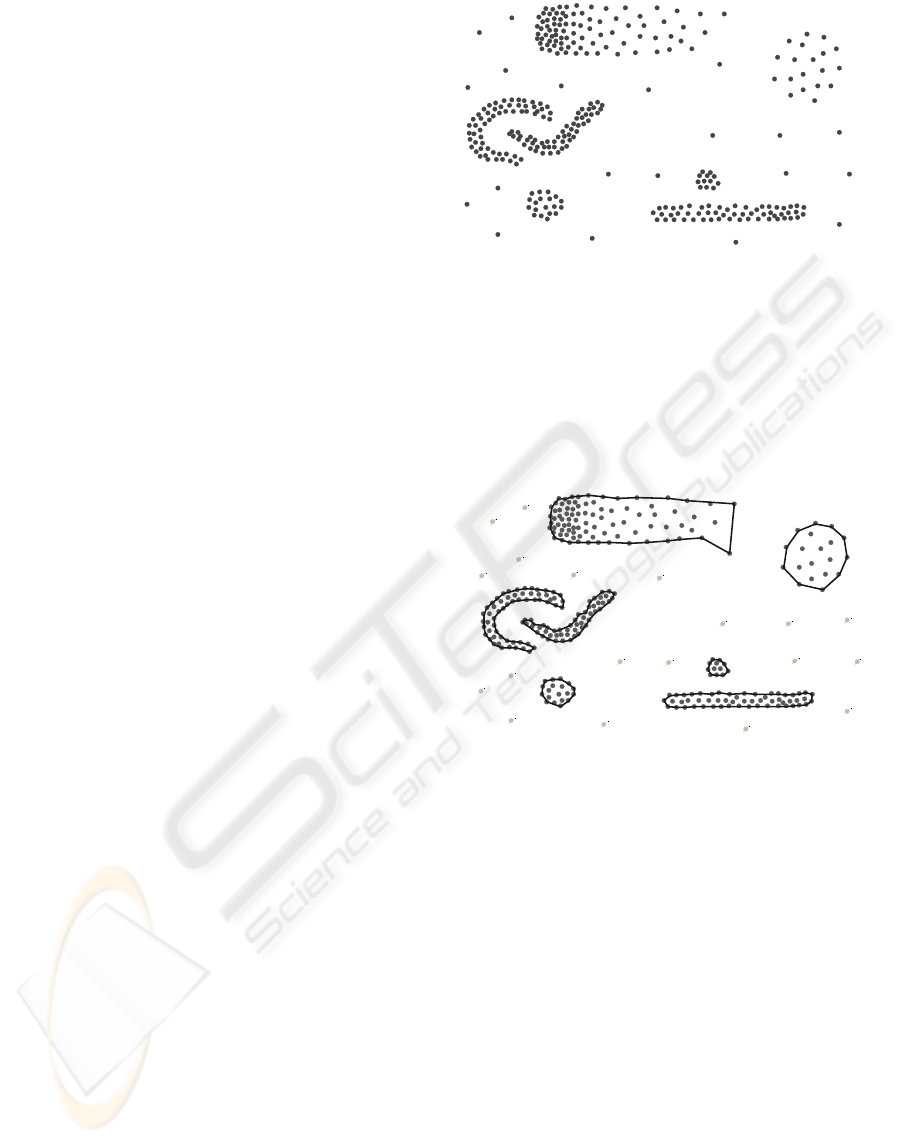
given set of points. Figure 1 shows one example. In
this example, where the points could represent trees
in a forest, the region defined by the convex hull
does not represent the region occupied by the trees.
This same problem, or similar problems, has
already been addressed by other authors (e.g.
(Edelsbrunner, 1983; Galton, 2006; Edelsbrunner,
1992a; Edelsbrunner, 1992b; Amenta, 1998)). In
(Edelsbrunner, 1983) the concept of alpha-shapes
was introduced as a solution to this same problem.
The concept of alpha-shape was further developed in
(Edelsbrunner, 1992a; Edelsbrunner, 1992b) and
other solutions, such as crust algorithms (Amenta,
1998), were also proposed. However, most of the
proposed approaches address the reconstruction of
surfaces from sets of points, belonging to that
surface and, therefore, are not optimized for the
referred problem.
Figure 1: The area of the convex hull does not represent
the area occupied by the set of points.
In other words, little work was devoted to the
problem described in this paper, as also recognized
by Galton et al. (Galton, 2006). In their paper,
Galton et al. describe this same problem and present
a few examples of applications that could benefit
from a general solution to compute what they call
the “footprint” of a set of points. They also describe
the existing approaches, including the Swinging
Arm algorithm (SA), and define a criterion with 9
“concerns” to evaluate those solutions. We therefore
refer to this paper for a description of previous work
on this subject.
61
Moreira A. and Yasmina Santos M. (2007).
CONCAVE HULL: A K-NEAREST NEIGHBOURS APPROACH FOR THE COMPUTATION OF THE REGION OCCUPIED BY A SET OF POINTS.
In Proceedings of the Second International Conference on Computer Graphics Theory and Applications - GM/R, pages 61-68
DOI: 10.5220/0002080800610068
Copyright
c
SciTePress
This paper also addresses this problem, by
proposing a new algorithm for the computation of a
polygon that best describes the region occupied by a
set of points.
The algorithm described in this paper was
developed within the context of the LOCAL project
(LOCAL, 2006) as part of a solution for a broader
problem. The LOCAL project aims to conceive a
framework to support the development of location-
aware applications, and one of its objectives is to
develop a process to automatically create and
classify geographic location-contexts from a
geographic database (Santos, 2006). As part of this
process, we faced the problem of identifying the
“boundaries” of a set of points in the plane, where
the points represent Points Of Interest (POIs).
In order to solve this problem, we developed a
new algorithm to compute a polygon representing
the area occupied by a set of points in the plane.
This new algorithm filled the needs of our research
project and, we believe, can be used in similar
situations where the assignment of a region to a set
of points is required.
This paper is organized as follows: section 2
presents the problem of creation of polygons given a
set of points. Section 3 describes the Concave Hull
algorithm developed for the computation of
polygons with convex and non-convex shapes.
Section 4 introduces the implementation undertaken,
presents some examples of the obtained results, and
discusses performance issues through numerical
evaluation of the implemented algorithm. Section 5
concludes with some remarks and future work.
2 COMPUTING REGIONS’
BOUNDARIES
The problem we faced in the LOCAL project was
how to calculate the boundary of a geographic area
defined by a set of points in the geographic space.
These points represent POIs which are a common
part of geographic databases and navigation systems.
Figure 2 shows an example of an artificial set of
POIs within a given geographic area. In this data set,
one (we, humans) can easily identify 7 different
regions, in addition to a number of “noise” points.
Our goal in the LOCAL project was to
automatically detect these regions, while removing
the noise points, and calculate the polygons that
define the respective boundaries. The final result
should be as shown in Figure 3.
Figure 2: Initial data set.
The approach we adopted to achieve the goal
depicted in Figure 3 was to divide the identification
of the groups of points (identification of the points
belonging to each region and noise removal), from
the calculation of the polygons describing those
regions, as described in (Santos, 2006), and also as
suggested in (Galton, 2006).
AB
C
D
E
F
G
Figure 3: The goal.
For the first phase, an implementation of the
Shared Nearest Neighbours (SNN) clustering
algorithm was used (Ertoz, 2003). The SNN is a
density-based clustering algorithm that has as its
major characteristic the fact of being able to detect
clusters of different densities, while being able to
deal with noise and with clusters with non-globular
(and non-convex) shapes. SNN uses an input
parameter, k, which can be used to control the
granularity of the clustering process. The groups of
points depicted in Figure 3 were obtained using
SNN with k=8. The noise points were also discarded
by SNN (slashed points in Figure 3). In this
example, the task of SNN was easy, as the seven
groups of points are clearly separated from the noise
points. However, with real POIs, the regions might
not be so clearly defined and the regions might be of
very “strange” shapes.
The second phase of the process is, for each
group of points found by SNN, to compute the
GRAPP 2007 - International Conference on Computer Graphics Theory and Applications
62

corresponding polygon that defines the boundaries
of the region. In this data set there are two distinct
types of regions: the “circle shaped” regions (A, C
and G), and the other regions with less regular
shapes (B, D, E and F). For the first group, there are
a set of algorithms that could be used to calculate the
convex hull of the points. However, for the other
group of regions, the convex hull approach is not
clearly a good solution, as shown in Figure 1 for the
D region.
In the next section we describe the solution that
was developed to overcome the limitations of the
convex hull approach for this kind of applications.
3 THE CONCAVE HULL
ALGORITHM
The goal of the algorithm described in this section
is, given an arbitrary set of points in a plane, to find
the polygon that best describes the region occupied
by the given points. While there is a single solution
for the convex hull of a set of points, the same is not
true for the “concave hull”. In the statement that
defines our goal (previous paragraph), the
expression “best describes” is ambiguous, as the
“best” might depend on the final application. As an
example, consider the two polygons shown in Figure
4, which describe the region E. Which of the two
polygons, a) or b), “best describes” region E?
a)
b)
Figure 4: Which one is the best? Two polygons for the
same set of points.
Since there are multiple solutions (polygons) for
each set of points, and the “best” solution depends
on the final application, our approach to compute the
polygons should be flexible enough to allow the
choice of one among several possible solutions for
the set of points. The other implication of this
ambiguous definition of “best” is that it turns very
difficult to assess the correctness of any algorithm
used to compute the polygon, and even to compare
different algorithms. For this last purpose, we will
adopt the criteria described in (Galton, 2006) (see
Section 4).
3.1 k-Nearest Neighbours Approach
Our approach to calculate the Concave Hull of a set
of points is inspired in the Jarvis’ March (or “gift
wrapping”) algorithm used in the calculation of the
convex hull (Jarvis, 1973). In this algorithm, the
convex hull is calculated by finding an extreme
point, such as the one with lowest value of Y (in the
yy axis), and then by finding the subsequent points
by “going around” the points – the next point is the
one, among all the remaining points, that is found to
produce the largest right-hand turn.
The approach adopted for the calculation of the
concave hull is similar, except that only the k-nearest
neighbours of the current point (last founded vertex)
are possible candidates to become the next point in
the polygon. Figure 5 illustrates this concept.
The first step of the process is to find the first
vertex of the polygon (point A in Figure 5a) as the
one with the lowest Y value. In the second step, the
k points that are nearest to the current point are
selected as candidates to be the next vertex of the
polygon (points B, C and D in Figure 5a, for k=3). In
this case, point C is selected as the next vertex of the
polygon, since it is the one that leads to the largest
right-hand turn measured from the horizontal line
(xx axis) that includes the first point (point A). Since
C is now a vertex of the polygon (as well as A), it
must be removed from subsequent steps while
searching for the k-nearest neighbours.
In the third step, the k-nearest points of the
current point (point C) are selected as candidates to
be the next point of the polygon (points B, D and E
in Figure 5b). In this case, the point that results in
the largest right-hand turn, corresponding to the
largest angle between the previous line segment and
the candidate line segment, is selected (point E). As
before, point E is now part of the polygon and will
never be considered in the next steps.
The process is repeated until the selected
candidate is the first vertex. For the first vertex
(point A) to be elected as a candidate, it must be
inserted again into the data set after the first four
points of the polygon are computed (before that, if
the first point is selected as the best candidate, a
triangle is computed). By the end of the process, the
polygon is closed with the first and the last point
being the same (point A).
CONCAVE HULL: A K-NEAREST NEIGHBOURS APPROACH FOR THE COMPUTATION OF THE REGION
OCCUPIED BY A SET OF POINTS
63
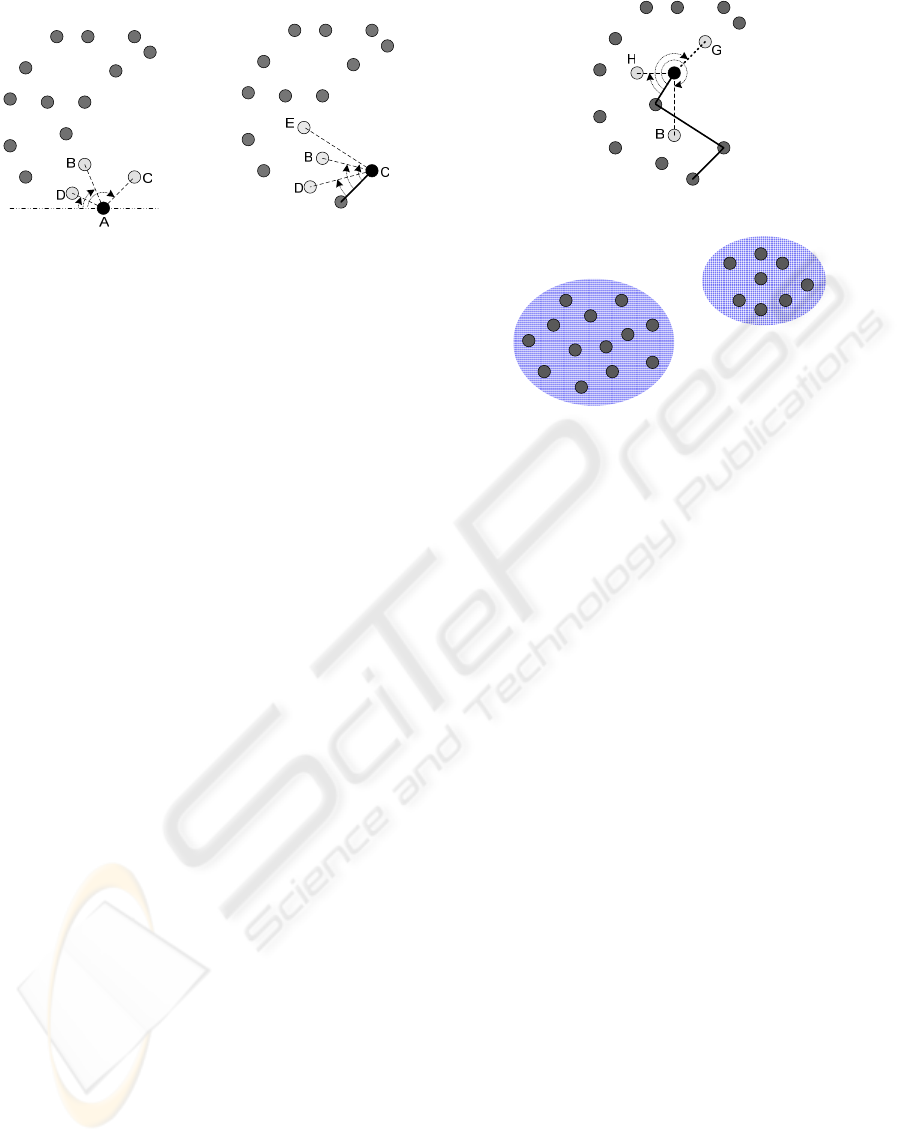
a) b)
Figure 5: The k-nearest neighbours approach.
In this example, three candidates were
considered in each step (k=3). If a larger number of
candidates were considered, the computed polygon
would become “smoother”. The number of
neighbours cannot, however, be larger than the
number of remaining points in each step. If, in a
particular step, the number of remaining points
(candidates) is smaller than k, then the algorithm
automatically considers all the remaining points
(without any user intervention).
This approach works for the majority of the
cases. However, there are two special cases that
must be pointed out. One of them is when the
selected candidate results in a polygon edge that
intersects one of the already computed edges. This
case is depicted in Figure 6a. In this example (step
5), the candidate that results into the largest right-
hand turn is point B. However, this candidate leads
to a polygon edge that intersects one of the existing
edges and, therefore, should be discarded. In cases
like this, the next candidate should be considered
(point G in this example). If none of the candidate
points (the k-nearest neighbours) is acceptable, then
a higher number of neighbours must be considered,
by increasing the value of k and starting again.
The other special case may occur when the
spatial density of the initial set of points is not
uniform. Figure 6b illustrates this case with a set of
points where there are clearly two different
“regions”. This case should not be very common if
the initial data set has gone through the clustering
process (e.g using SNN), since, in that case, this data
set would be separated into two different clusters.
Anyway, in an arbitrary data set this special situation
may occur and must be addressed.
a)
b)
Figure 6: Special cases: a) where the new edge intersects
another existing edge of the polygon; b) where the points
are not uniformly distributed in the space.
In this second case, the first point of the polygon
is in the lower-left region (the point with the lowest
Y value) and, therefore, the process starts by looking
for candidates that are near this first point. However,
since the points in the upper-right group are too far
away from the points in the lower-left group, they
are never considered as candidates if the number of
neighbours (value of k) considered in each step of
the process is small. As a consequence, the points in
the upper-right group are left out of the polygon. To
solve this issue, a higher number of neighbours must
be considered. Since the value of k chosen by the
user might be too small, the algorithm must verify,
at the end, that all the points are within the generated
polygon. If not, a higher value of k is automatically
tried by the algorithm using a recursive process that
stops when all the points are within the computed
polygon.
3.2 Concave Hull Algorithm
The steps behind the Concave Hull concept
described in the previous section were used to
develop the algorithm that is shown on the next page
(Algorithm 1).
GRAPP 2007 - International Conference on Computer Graphics Theory and Applications
64

Algorithm 1: The Concave Hull algorithm.
C
ONCAVEHULL [pointsList, k]
Input. List of points to process (pointsList); number of neighbours (k)
Output
. An ordered list of points representing the computed polygon
1: kk ← Max[k,3] ► make sure k>=3
2: dataset ← CleanList[pointsList] ► remove equal points
3: If Length[dataset] < 3
4: Return[null] ► a minimum of 3 dissimilar points is required
5: If Length[dataset] = 3
6: Return[dataset] ► for a 3 points dataset, the polygon is the dataset itself
7: kk ← Min[kk,Length[dataset]-1] ► make sure that k neighbours can be found
8: firstPoint ← FindMinYPoint[dataset]
9: hull ← {firstPoint} ► initialize the hull with the first point
10: currentPoint ← firstPoint
11: dataset ← RemovePoint[dataset,firstPoint] ► remove the first point
12: previousAngle ← 0
13: step ← 2
14: While ((currentPoint≠firstPoint)or(step=2))and(Length[dataset]>0)
15: If step=5
16: dataset ← AddPoint[dataset,firstPoint] ► add the firstPoint again
17: kNearestPoints ← NearestPoints[dataset,currentPoint,kk] ► find the nearest neighbours
18: cPoints
← SortByAngle[kNearestPoints,currentPoint,prevAngle] ► sort the candidates
(neighbours) in descending order of right-hand turn
19: its ← True
20: i ← 0
21: While (its=True)and(i<Length[cPoints]) ► select the first candidate that does not intersects any
of the polygon edges
22: i++
23: If cPoints
i
=firstPoint
24: lastPoint ← 1
25: else
26: lastPoint ← 0
27: j ← 2
28: its ← False
29: While (its=False)and(j<Length[hull]-lastPoint)
30: its ← IntersectsQ[{hull
step-1
,cPoints
i
},{hull
step-1-j
,hull
step-j
}]
31: j++
32: If its=True ► since all candidates intersect at least one edge, try again with a higher number of neighbours
33: Return[ConcaveHull[pointsList,kk+1]]
34: currentPoint ← cPoints
i
35: hull ← AddPoint[hull,currentPoint] ► a valid candidate was found
36: prevAngle ← Angle[hull
step
,hull
step-1
]
37: dataset ← RemovePoint[dataset,currentPoint]
38: step++
39: allInside ← True
40: i ← Length[dataset]
41: While (allInside=True)and(i>0) ► check if all the given points are inside the computed polygon
42: allInside ← PointInPolygonQ[dataset
i
,hull]
43: i--
44: If allInside=False
45: Return[ConcaveHull[pointsList,kk+1]] ► since at least one point is out of the computed polygon,
try again with a higher number of neighbours
46: Return[hull] ► a valid hull was found!
CONCAVE HULL: A K-NEAREST NEIGHBOURS APPROACH FOR THE COMPUTATION OF THE REGION
OCCUPIED BY A SET OF POINTS
65
This algorithm makes use of the following
functions:
CleanList[listOfPoints]: returns the given
listOfPoints with no more than one copy of each point
(removes duplicates).
Length[vector]: returns the number of elements of the
given vector.
FindMinYPoint[listOfPoints]: returns the element
({x,y} pair) of the given listOfPoints with smaller
value of Y.
RemovePoint[vector,e]: returns the given vector
without the given element e.
AddPoint[vector,e]: returns the given vector with
the given element e appended as the last element.
NearestPoints[listOfPoints,point,k]: returns a
vector with the
k elements of listOfPoints that are
closer to the given point. In the current implementation,
this function uses the Euclidean distance to select the
nearest points. However, the distance functions can be
used. This function internally re-computes the value of k
as the minimum value between the given value of k and
the number of points present in the dataset.
SortByAngle[listOfPoints,point,angle]: returns
the given listOfPoints sorted in descending order of
angle (right-hand turn). The first element of the returned
list is the first candidate to be the next point of the
polygon.
IntersectQ[lineSegment1,lineSegment2]: returns
True if the two given lines segments intersect each other,
and False otherwise.
PointInPolygonQ[point,listOfPoints]: returns
True if the given point is inside the polygon defined by
the given listOfPoints, and False otherwise.
4 IMPLEMENTATION AND
RESULTS
The algorithm described in section 3 was
implemented as a Mathematica (Mathematica, 2006)
package, which was used to evaluate the algorithm
and also as a tool to fulfil our project needs. In the
following subsections we present a few examples of
the hulls computed by this algorithm, as well as
some results on its performance. The developed
code (one Mathematica package) is available online
on the web site of the LOCAL project, where the
algorithm can be tried through a web interface.
4.1 Results
The polygons shown in Figure 3 (section 2) and
Figure 4 (section 3) were all computed using the
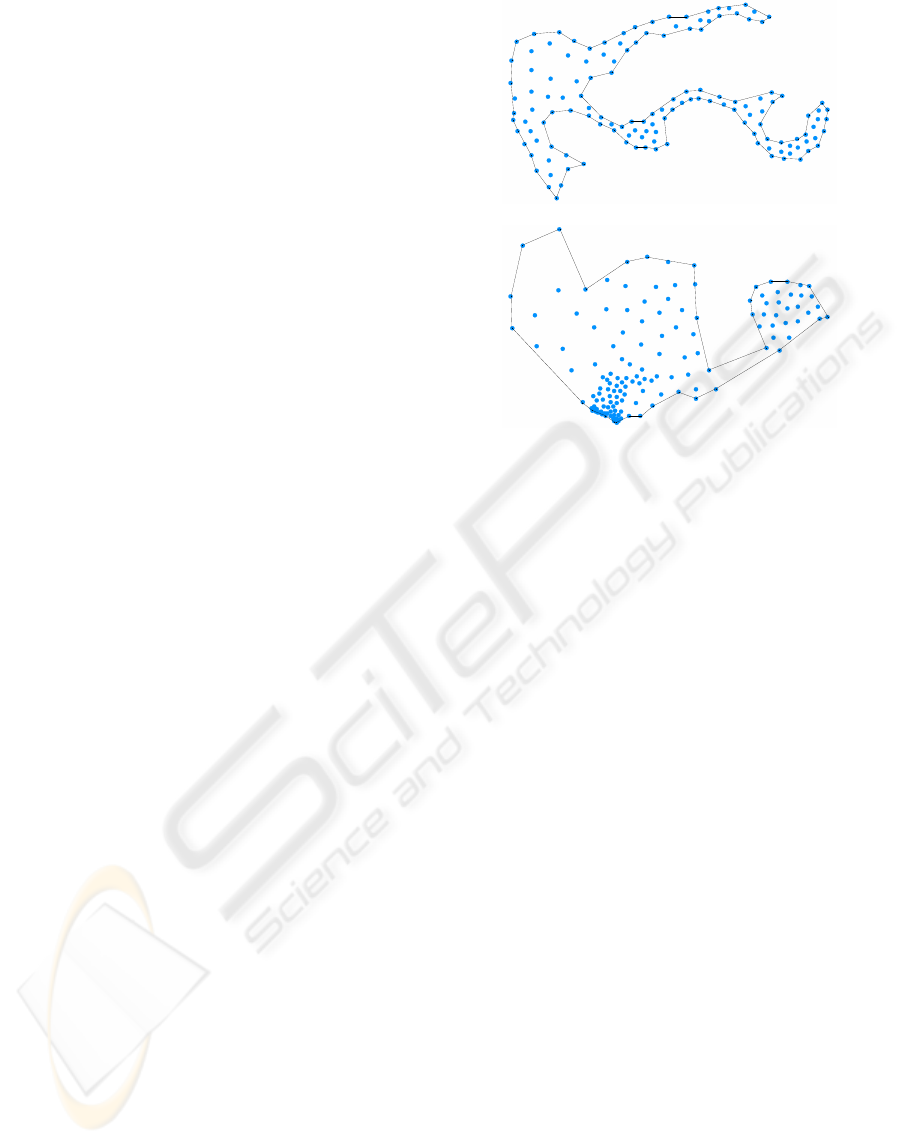
algorithm described in this paper. In Figure 7 two
other examples are presented.
a)
b)
Figure 7: Two hulls computed by the proposed algorithm.
Figure 7a shows a case where the shape of the
region occupied by the points is very irregular. For
this data set, a value of k=5 was used. The other
case, in Figure 7b, illustrates the result obtained for a
set of points with a large variation in the spatial
density of the points and with two regions. In this
example, the algorithm was started with k=3 but, in
order to include the right-most group of points, the
algorithm automatically increased the value of k up
to 18. Both results were obtained with the lowest
value of k that permits the computation of the
polygon. Using higher values of k would lead to
“smoother” polygons.
The proposed algorithm was already used in a
real application that required the definition of
geographic location contexts that are used to identify
in which particular scenario a mobile user is located.
The definition of the regions was done analysing a
geographic database that integrates a total of 18 914
POIs (Santos, 2006).
4.2 Performance
In order to evaluate the performance of the proposed
algorithm in terms of computational load, the time
used to compute the polygons was measured for
several data sets of different sizes. The used test data
sets were randomly generated within the space of a
circle with unitary radius. For each data set, different
values of k were also used. Each point in the
following graphs was obtained by averaging the
several time values needed to process 20 different
GRAPP 2007 - International Conference on Computer Graphics Theory and Applications
66
data sets. The obtained results are shown in Figure 8
and Figure 9.
10 25 50 100 250 500 1000
number of points
0.1
1
10
20
50
emit
k=3+
k=10+
k=20+
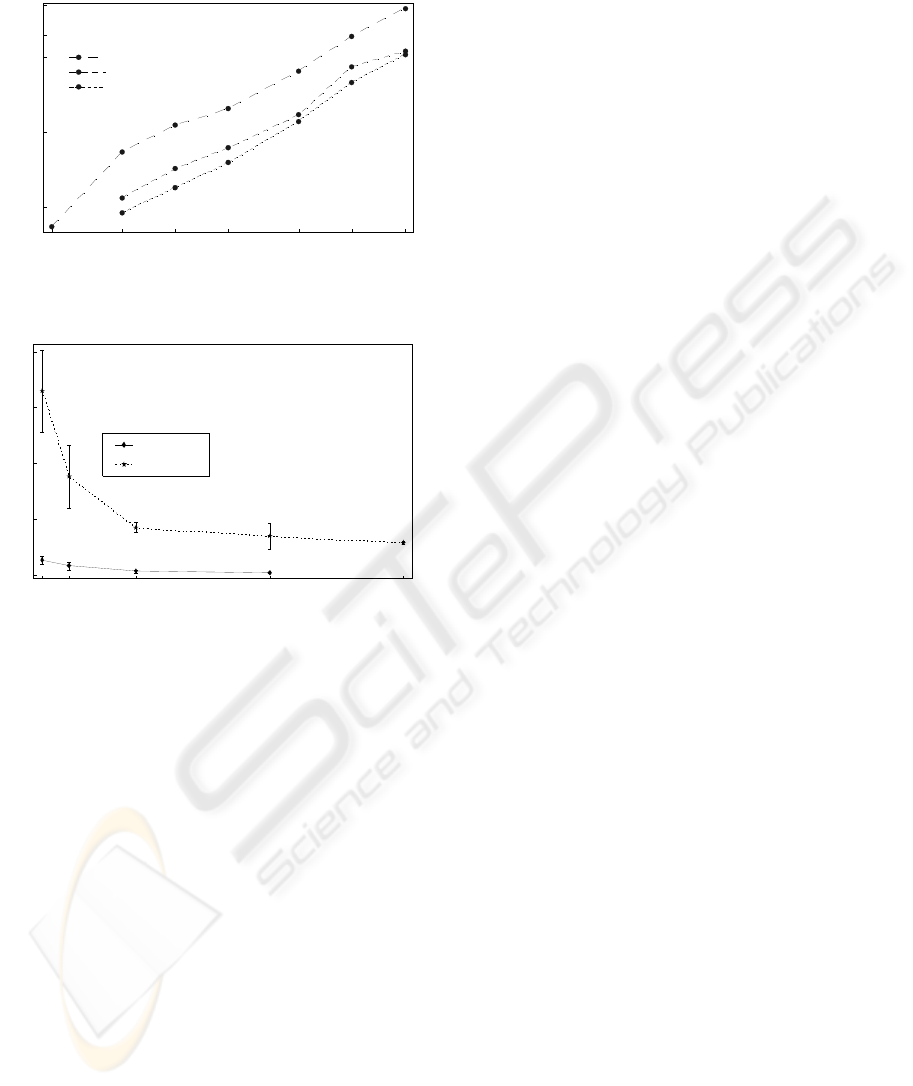
Figure 8: Time to compute the polygons vs. the number of
points.
3 5 10 20 30
value of k
0
2
4
6
8
emit
n=250
n=25
Figure 9: Time to compute the hull vs. the value of k.
In these graphs, the absolute values of the time
used to compute the polygons is of less importance,
since they depend on the used computer. Instead,
these results are intended to assess the trends in the
computing load when some parameters are changed.
Moreover, these results were obtained from a
Mathematica implementation of the algorithm, that
has not been optimised for speed. The results
presented here were obtained by running the
algorithm in an ordinary Pentium 4-M at 2,2 GHz
with 768 Mbytes of RAM.
Figure 8 shows the time (in seconds) used to
compute the hulls for data sets of size 10, 25, 50,
100, 250, 500 and 1000 points. The upper line
represents the time values obtained when the
algorithm was started with k=3. The lower lines
represent the time values when the algorithm was
started with k=10 and k=20, respectively. However,
in the three cases and for some of the data sets, the
algorithm recursively increased the value of k to go
around the special cases described in subsection 3.1.
These results show that the time to compute the
polygons increases approximately linearly with the
number of points (note the log-log scales used in the
graph).
The other result is that the computing time is
smaller for higher values of k. This can be explained
by the fact that, by starting with a higher k (e.g.
k=20), the time to try lower values of k (e.g. 3 to 19)
that might lead to special cases is removed from the
total time. This is better shown in Figure 9, where
the time to compute the hulls is shown as a function
of the initial value of k, for k=3, 5, 10, 20 and 30, for
two different sizes of the data set (25 and 250 points
each). Here it is clear that lower values of k result in
higher computing times. Figure 9 also shows the
standard deviation on the time taken to compute the
different 20 data sets for each value of k. Here, the
general trend is to observe a lower variation for
higher values of k than for lower values.
4.3 More General Assessment
Using the criteria defined in (Galton, 2006), and the
same nomenclature where S denotes the given set of
points and R(S) refers to the proposed region
representing those points, the “concave hull” can be
described as follows:
1. Outliers are not permitted, meaning that all the
points of S are within the computed polygon.
2. There are always points of S on the boundary
of R(S).
3. The computed “concave hull” (polygon) is
topological regular (unless the points are
collinear).
4. The “concave hull” is connected.
5. The “concave hull” is polygonal.
6. The boundary of the “concave hull” is a
Jordan curve (unless the points are collinear).
7. In some cases, such as in region D in Figure 3,
large areas of empty space are excluded from
the “concave hull”, unless a very large value
for k is used. In other cases, such as the one
shown in Figure 7b, the large area of empty
space in the upper-left region of the data set is
maintained within the computed polygon.
8. The generalization of the Concave Hull
algorithm to three dimensions might be
possible, but not easily.
9. The analysis of the computational complexity
of the Concave Hull algorithm is still future
work.
Comparison of the Concave Hull algorithm with
the SA algorithm described in (Galton, 2006)
resulted in the following advantages of the Concave
Hull. First, the use of the Concave Hull does not
require any previous knowledge of the data set in
CONCAVE HULL: A K-NEAREST NEIGHBOURS APPROACH FOR THE COMPUTATION OF THE REGION
OCCUPIED BY A SET OF POINTS
67

order to choose the value of k. Starting the algorithm
with k=3 always leads to a polygon with the
characteristics described in the above criteria. On the
other hand, if the SA algorithm is started with a too
low value for r, the result may not be a regular
polygon. Therefore, the choice of r for SA requires a
previous knowledge of the data set. This
characteristic of the Concave Hull makes it suitable
to process many data sets representing different
regions, and where the spatial density of points in
each region can be very different. Second, the
Concave Hull algorithm adapts itself to the
variations in the spatial density of the points within
the same data set, as shown in Figure 7b. On the
other hand, it seams that the SA algorithm uses a
constant value of r to select the list of candidates to
become the next vertex of the polygon, therefore not
being able to adapt to variations in the spatial
density of the points.
5 CONCLUSIONS
In this paper we described an algorithm to compute
the “concave hull” of a set of points in the plane.
The algorithm is based in a k-nearest neighbours
approach and is able to deal with arbitrary sets of
points by taking care of a few special cases. The
“smoothness” of the computed hull can also be
controlled by the user through the k parameter.
The presented algorithm has as advantages the
fact that it can deal with non-convex (concave) hulls
as well as convex ones, and the fact that the user can
adapt the polygons to its needs by choosing the k
parameter. The algorithm was implemented as a
Mathematica package, and the obtained results show
that the time to compute the “concave hull”
increases approximately linearly with the number of
points.
Future work on this subject includes the
improvement of the algorithm implementation,
namely through the use of a more efficient function
to calculate the angles depicted in Figure 5, and a
more efficient function to verify if two line segments
intersect each other. The computational complexity
of the proposed algorithm is also a subject for future
analysis.
ACKNOWLEDGEMENTS
This work was developed as part of the LOCAL
project funded by the Fundação para a Ciência e
Tecnologia through grant POSI/CHS/44971/2002,
with support from the POSI program.
REFERENCES
Graham, R.L., 1972, An efficient algorithm for
determining the convex hull of a planar set,
Information Processing Letters 1, 132-133
Jarvis, R.A., 1973, On the identification of the convex hull
of a finite set of points in the plane. Information
Processing Letters 2, 18-21
Preparata, F.P., and Hong, S.J., 1977, Convex hulls of
finite sets of points in two and three dimensions.
Communications of the ACM, 20, 2 (Feb.), 87-93.
Eddy, W.F., 1977, A new convex hull algorithm for planar
sets. ACM Transactions on Mathematical Software, 3,
4 (Dec.), 398-403.
Edelsbrunner, H., Kirkpatrick D.G, and Seidel R., 1983,
On the Shape of a Set of Points in the Plane, IEEE
Transactions on Information Theory, Vol. IT-29, No.
4, July
Galton, A, and Duckham, M., 2006, What is the Region
Occupied by a Set of Points?, Proceedings of the
Fourth International Conference on Geographic
Information Science – GIScience 2006, Munich,
Germany, September 20-23
Edelsbrunner, H., 1992a, Weighted Alpha Shapes,
Technical Report: UIUCDCS-R-92-1760
Edelsbrunner, H., and Mucke, E.P., 1992b, Three-
dimensional Alpha Shapes, In Proceedings of the 1992
Workshop on Volume visualization, p.75-82, Boston,
Massachusets, USA, October 19-20
Amenta, N., Bern, M., Kamvysselis, M., 1998, A New
Voronoi-Based Surface Reconstruction Algorithm,
Proceedings of the 25th annual conference on
Computer graphics and interactive techniques, p.415-
421, July
LOCAL, 2006, http://get.dsi.uminho.pt/local, visited
December 2006.
Santos, M. Y., and Moreira A., 2006, Automatic
Classification of Location Contexts with Decision
Trees, Proceedings of the Conference on Mobile and
Ubiquitous Systems – CSMU 2006, p. 79-88,
Guimarães, Portugal, June 29-30
Ertoz, L., Steinbach, M. and Kumar, V., 2003, Finding
Clusters of Different Sizes, Shapes, and Densities in
Noisy, High Dimensional Data. In Proceedings of the
Second SIAM International Conference on Data
Mining, San Francisco, CA, USA, May
Mathematica, http://www.wolfram.com, visited October
2006.
GRAPP 2007 - International Conference on Computer Graphics Theory and Applications
68
