
SOME ASSEMBLY REQUIRED
Effectiveness Of Interactive 3D Graphics on Mobile Devices for Object Assembly
Guy W. Zimmerman
Department of Computer Science, Bowling Green State University, Bowling Green, Ohio, USA
Keywords: Mobile device, 3D graphics, assembly task, object complexity.
Abstract: A study was conducted to explore the effectiveness of interactive 3D graphics on a mobile device to present
instructions for an assembly task: building four Lego models of varying complexity. Our results show
significant improvement in assembly correctness and time to complete the assembly when subjects used an
interactive presentation compared to a non-interactive one. The study also explored the intuitive notion of
3D object complexity and compared perceived object complexity with experimentally measured values.
1 INTRODUCTION
Assembly tasks are commonplace. They present
themselves in a diverse set of contexts; from
building a child's bike to putting together a
computer. They can range in complexity from just a
few, to thousands of individual steps, sometimes
requiring multiple sub-assemblies along the way.
The procedures for carrying out assembly tasks are
commonly presented as combinations of written text
and diagrams.
The recent explosion in availability of 3D
graphics capable mobile devices, coupled with their
ability to access the world wide web, holds out the
potential for a rich source of applications, including
the delivery of instructions for assembly tasks.
In this paper, we consider the utility of
interactive 3D graphics as a component of a system
to deliver instructions for an assembly task –
assembling Lego models. We present the results of a
study which examined two related issues within this
domain: 1) the effectiveness of interactive 3D
graphics presented on a mobile device in
contributing to a subject's ability to correctly
complete an assembly task and 2) what are the
characteristics which define complexity of
assembled objects?
The rest of the paper is organized as follows: in
section 2 we give some background information and
relevant results from the research literature for each
of the above issues. In section 3 we describe the
details of the study. Section 4 contains the results of
the study along with our analysis. The final section
summarizes and concludes the paper.
2 BACKGROUND
The use of diagrams to assist people in the execution
of assembly tasks is ubiquitous. Examples include:
assembling prefabricated furniture, children's toys,
and origami figures to name just a few. Despite the
pervasive use of diagrams in the presentation of such
instructions for assembly tasks, only recently has
any research been done on the role such diagrams
play in supporting the assembly task (Novick, 2000).
Since most such presentations are provided in
printed form, much of the existing work has focused
on two-dimensional diagrams. These are typically
perspective drawings of the object to be assembled
using a predetermined viewpoint – presumably
selected by the instruction designer as being optimal
for the step of the assembly being illustrated. Novick
(2000) examined diagrams that accompany
instructions for folding origami figures. Argawala
(2003) presented a suite of design principles to
create two-dimensional diagrams as well as system
for the automated production of those diagrams.
Two classes of diagrams are distinguished –
structural and action. Structural diagrams (termed
Final by Novick) show all the parts of interest in
their final position and leave it to the user to
determine how to accomplish the assembly. In
action diagrams, the parts to be attached are spatially
191
W. Zimmerman G. (2007).
SOME ASSEMBLY REQUIRED - Effectiveness Of Interactive 3D Graphics on Mobile Devices for Object Assembly.
In Proceedings of the Second International Conference on Computer Graphics Theory and Applications - AS/IE, pages 191-196
DOI: 10.5220/0002084301910196
Copyright
c
SciTePress

separated from the (partially completed) object and
include arrows (or similar) to indicate how (the
action) the parts are to be attached. The authors note
that people generally prefer that instructions
partition the steps of an assembly over multiple
diagrams. However, it is most common for a single
diagram to illustrate some minimal number of steps,
partly to reduce the total number of diagrams –
reducing the production and printing cost.
2.1 3D Graphics
As noted, instructions are most commonly produced
for print distribution and as such the accompanying
diagrams are 2-dimensional. Given the widespread
availability of computers with significant 3D
graphics capabilities, it is natural to consider the
replacement of static 2-dimensional diagrams with
animated and/or interactive 3-dimensional models as
the visual component in the presentation of
instructions for assembly tasks. Kashiwazaki (2005)
discusses potential advantages of 3D 'contents' as
compared to 2D 'contents' in the teaching of
assembly/disassembly procedures. Likewise the
Virtual Manuals™ application produced by
ParallelGraphics (Virtual Manuals). However, in
both cases only anecdotal evidence is provided as to
their effectiveness.
We note that as soon as we change to this latter
paradigm, many of the issues and restrictions
imposed by 2D representations vanish. For example,
it is no longer necessary to consider an optimal
viewpoint. Further, there is no longer a good reason
to illustrate multiple assembly steps simultaneously
(i.e. within a single diagram). It seems intuitively
obvious that illustrating one step at a time would
present the smallest cognitive load on the user,
enabling them to focus on the specific task,
increasing their ability to correctly complete the
assembly as rapidly as possible. A few papers have
appeared addressing some of these issues. Nousch
(1999) describes a software package named
BEAVER which allows users to design furniture and
automatically create instructions for its assembly,
however no data is provided as to the effectiveness
of the generated assembly instructions. A study
comparing the relative effectiveness of augmented
virtual-reality technology (AR), traditional CAI and
printed assembly instructions in the assembly of a
Duplo block model found an 82% reduction in errors
(Tang 2003).
A significant advantage of printed instructions is
in their mobility. A user can take the instructions to
the task, something not generally possible with AR
or desktop systems. However, presenting
instructions using 3D graphics on mobile devices
would seem combine the best of both worlds. While
the constant changes in technology make the
definition of ‘mobile device’ a moving target, for the
purposes of this paper the term mobile device will
imply a handheld computing device possessing a
display screen and input mechanism. This includes
cell phones and PDAs and in particular excludes
traditional desktop computers. In a study by
Zimmerman (2003) a virtual-reality presentation
using VRML was developed to illustrate the
construction of an origami figure. The study
compared the effectiveness of the presentation on a
traditional desktop computer to that on a PDA and
found little difference between the two platforms in
terms of errors in construction.
2.2 Object Complexity
We suggest that once we restrict the visual
representation to the depiction of a single step of the
assembly, the complexity of the task is largely
determined by the inherent complexity of the object
being assembled. Qualitative data from a prior study
(Zimmerman 2003) suggested 3D interactive
graphics were only differentially useful in situations
where the object was sufficiently complex. This
leads us to consider the question: what are the
characteristics that define complexity? For this
context specifically: what types of objects are
complex enough so that the use of interactive 3D
graphics enhances a user's ability to complete the
assembly with fewer errors and more rapidly as
compared to other traditional representations? We
posit the following list of potential characteristics:
• Number of parts
• Amount of symmetry
• Number of distinct part types
• Relative orientation (in 3D space) of parts
• Proximity of parts relative to one another.
• Volume of space which parts occupy
The issues discussed above have led us to
investigate the use of interactive 3D graphics on
mobile devices in the presentation of instructions for
an assembly task. This study is discussed in the next
section.
3 RESEARCH STUDY
Our study was motivated by the following two
questions
GRAPP 2007 - International Conference on Computer Graphics Theory and Applications
192
A B C
D
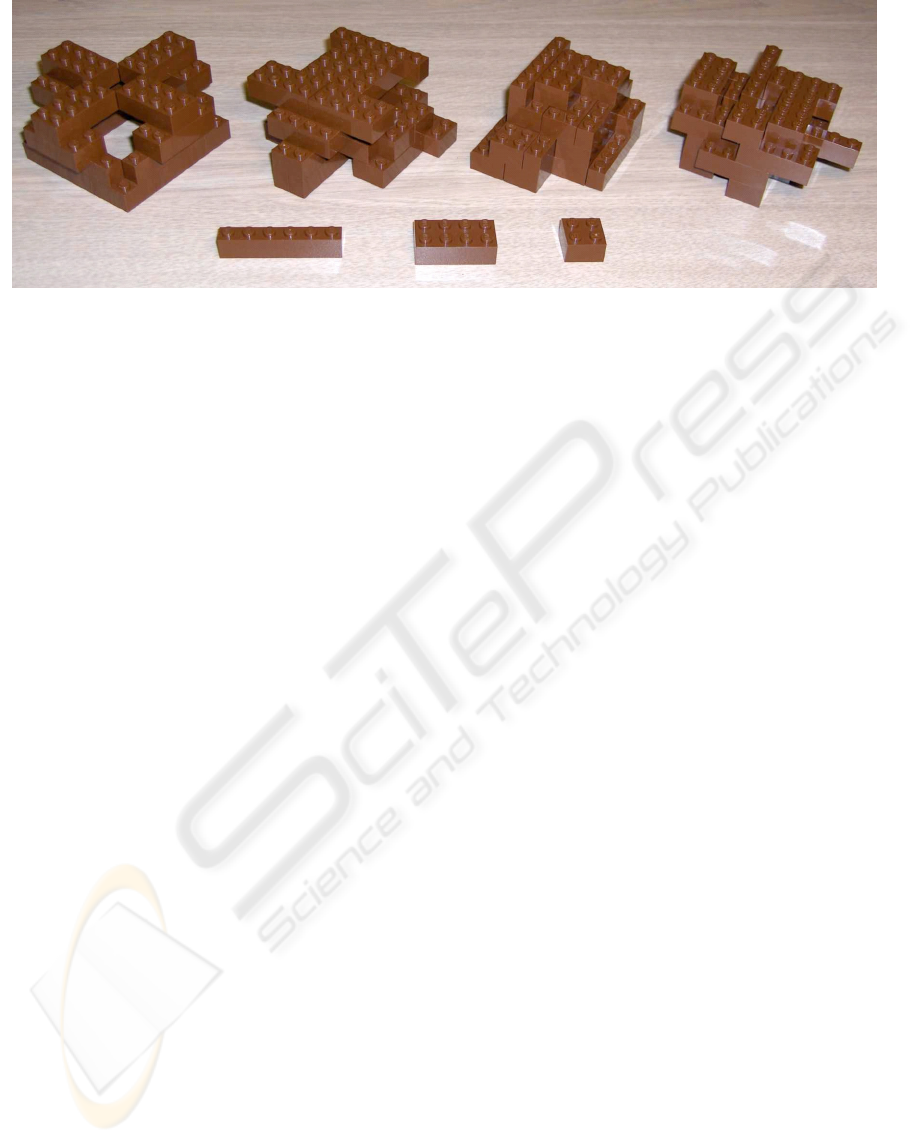
Figure 1: The 4 Lego Models.
1. How effective is the use of 3D graphics on a
mobile device in the presentation of instructions
for a construction task?
2. Can we identify object characteristics that
contribute to the difficulty of their assembly?
3.1 Materials and Task
To address the above two questions we selected for
our task the assembly of 4 separate Lego models. In
terms of complexity, we elected to focus on two
factors: symmetry and relative proximity of parts.
We controlled for total number of parts and number
of distinct part types by using the same collection of
20 pieces in each of the 4 models; 12 4x2 bricks, 4
2x2 bricks and 4 6x2 bricks. All bricks were a
medium brown color. All models consisted of 4
levels with at least 3 bricks in each level. The 4
models, designated A-D, were intended to exhibit
higher levels of complexity. Model A was
symmetric in 2 dimensions. Model B was symmetric
in 1 dimension. Models C and D possessed no
symmetry at all. Further, in model C, there were no
gaps between pieces within each level, while model
D was designed to have a high number of such gaps.
The models were designed to allow them to be
assembled level by level; all pieces from level one
were added first, then level 2, etc. Figure 1 shows
the four models along with the three piece types
used in the construction.
3.2 Assembly Instruction Presentation
The assembly instruction presentation was
implemented using VRML 2.0 (Virtual Reality
Modeling Language). This was largely a choice of
convenience since we had previously created a tool
which automated the process of creating VRML
Lego presentations for use in another study. Also, a
VRML 'browser' was readily available for our target
mobile device. Technical implementation details of
the tool and the modelling can be found in
(Zimmerman, 2006); here we give an overview of
what the user saw and how they interacted with the
presentation.
There were three principal visual components on
the display: a virtual building board, the user
animation/step interface and the individual Lego
bricks that collectively made the model. A simulated
sky/horizon was also implemented to provide a
spatial frame of reference for the building board.The
user moved through the steps by clicking the
forward/backward buttons on the interface. At the
beginning of each step the current piece to be added
to the model was shown on the display directly
above its correct position on the model. During each
step the user could initiate an animation of the brick
being correctly lowered into position. Alternatively,
the user could simply click the 'next' button and the
current piece would simply be added without the
animation. For all 4 models, all pieces within one
level were added before any pieces from higher
levels and pieces within a level were added in order
furthest from the default viewpoint first.
The 3D presentation was delivered on a Compaq
h3850 running Microsoft Pocket PC version 3. This
model used the SA1110 ARM processor with 64
megabytes of RAM. The VRML model was
rendered within Pocket Internet Explorer 5.5 with
the Pocket PC Cortona VRML client plugin. The
display screen measured 3.8 in (diagonal) with
resolution 240x320 with 16 bit color. The PDA was
placed in a cradle on a desk. Additional desk space
was provided for the subject to carry out the model
assembly. Subjects were free to move any of the
resources as they saw fit. The subjects used a stylus
to click buttons on the interface and to rotate the
SOME ASSEMBLY REQUIRED - Effectiveness Of Interactive 3D Graphics on Mobile Devices for Object Assembly
193
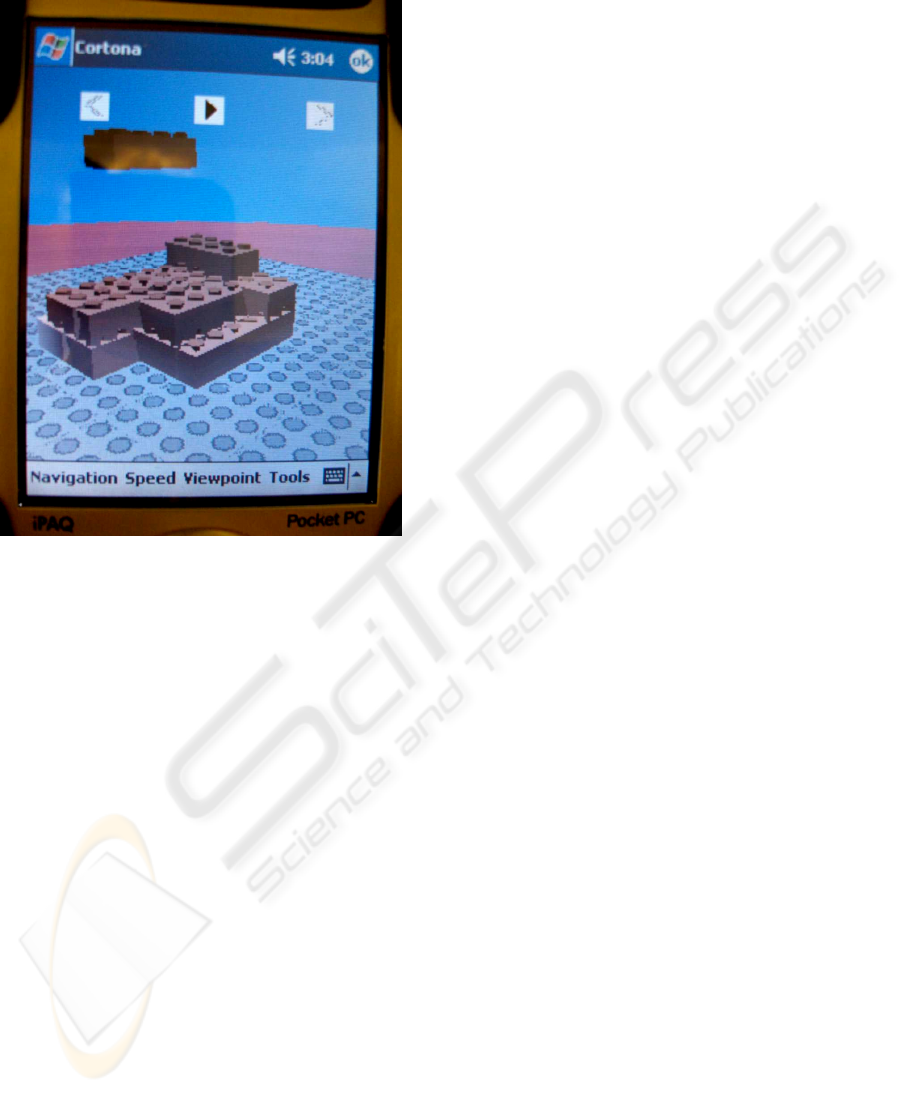
model (FR condition). The 3D presentation interface
is shown in Figure 2.
Figure 2: The 3D Presentation Interface.
3.3 Interaction Style
To provide a control group to help address the first
research question, two variations of the presentation
were provided: SV (static viewpoint) and FR (full
rotation). In the SV condition, the viewpoint was
fixed. Thus each step of the presentation was
analagous to a single-step, perspective view, action-
style assembly diagram, with the animation of the
piece being the action. The FR condition added the
ability of the subject to rotate the model freely in 3D
space using the navigation capability of the VRML
browser. The subject was also allowed to reset the
model's orientation to the intial one using the 'reset
viewpoint' feature of the browser.
3.3 Subjects
Nine subjects completed the task in each of the SV
and FR conditions. All of the subjects were graduate
students in Computer Science classes. Subjects were
permitted to move forward and backward through
the presentation steps at their discretion and as many
times as they wanted. There was no time limit for
the task. Subjects were shown all the features of the
user interface but were not given any guidance as to
how they should proceed. In other words, subjects
were free to use the presentation as it best suited
them.
3.4 Procedure
All of the subjects performed the task in a laboratory
at our University. Each subject completed the task
by themselves. Each subject completed a standard
psychometric spatial ability test and a biographical
survey which included questions about their prior
experience with Legos and 3D graphics. They then
received training on the use of the PDA interface for
their presentation. The training phase of the
protocols took about 10 minutes for each subject.
For each model to be constructed, each subject
received an empty 8x8 inch building board along
with a supply of Lego building bricks. A total of 6
brick types were provided; only 3 of which were
required to build the model. The other 3 were
'distractors' intended to demand increased attention
on the part of the subject in using the presentation.
The pieces were presorted into separate bins, with
more than enough pieces to complete each model.
Each subject is considered to have completed the
procedure and assembled a scoreable model if they
start the assembly procedure and declare themselves
to be finished.
Subject hands, the model and as much as
possible, the presentation on the screen were
videotaped. Subject assembly time was extracted
from the videotape and was defined as the time from
the moment that they started until they completed
the assembly task.
There were a total of 20 pieces in each model.
The first piece placed on the board was used a
reference point for all the remaining pieces. The
placement of a piece at a given step was scored as
one error if it was 1) an incorrect piece for that step
or 2) incorrectly positioned relative to the initial
reference piece.
4 RESULTS AND ANALYSIS
We considered the impact of the independent
variables: Model Complexity, Interaction Style and
Experience on two dependent variables: Number of
Errors and Assembly Time. The overall means and
standard deviations of these variables are shown in
Tables 1 and 2. Figures 3 and 4 display the means
GRAPP 2007 - International Conference on Computer Graphics Theory and Applications
194
Table 1: Number of Errors.
Model Interaction Experience Mean Std dev N
A FR N 0.00 0.000 5
Y 0.50 1.000 4
Total 0.22 0.667 9
SV N 0.67 1.155 3
Y 0.00 0.000 6
Total 0.22 0.667 9
Total N 0.25 0.707 8
Y 0.20 0.632 10
Total 0.22 0.647 18
B FR N 0.00 0.000 5
Y 0.00 0.000 4
Total 0.00 0.000 9
SV N 5.67 6.028 3
Y 0.67 1.633 6
Total 2.33 4.123 9
Total N 2.13 4.357 8
Y 0.40 1.265 10
Total 1.17 3.073 18
C FR N 0.80 1.789 5
Y 0.00 0.000 4
Total 0.44 1.333 9
SV N 0.67 1.155 3
Y 0.00 0.000 6
Total 0.22 0.667 9
Total N 0.75 1.488 8
Y 0.00 0.000 10
Total 0.33 1.029 18
D FR N 0.00 0.000 5
Y 0.25 0.500 4
Total 0.11 0.333 9
SV N 6.33 0.577 3
Y 2.83 2.483 6
Total 4.00 2.646 9
Total N 2.38 3.292 8
Y 1.80 2.300 10
Total 2.06 2.711 18
of each condition in a bar chart. In both the tables
and figures, A-D refer to the models, FR/SV refer to
the interaction style, and Y/N refers to user's prior
experience with Legos.
For Errors we found three significant main
effects. 1) Model Complexity F(3,12) = 7.19 p < .01;
the means suggest that Model D was the most
difficult and from the test we know that complexity
(as measured by number of errors) is different
among the 4 models. 2) Interaction style F(1,16) =
20.77, p=0; the means suggest that subjects made
fewer errors with the FR interaction style. 3)
Experience F(1,16)=8.69, p<.01; the means indicate
the subjects with Lego experience made fewer
errors. We also found two significant interactions.
Table 2: Assembly Times.
Model Interaction Experience Mean Std dev N
A FR N 336.20 87.159 5
Y 380.25 84.673 4
Total 335.78 83.821 9
SV N 280.67 164.755 3
Y 224.17 64.750 6
Total 243.00 101.017 9
Total N 315.38 113.677 8
Y 286.60 105.904 10
Total 299.39 107.122 18
B FR N 461.00 135.757 5
Y 528.75 139.972 4
Total 491.11 133.556 9
SV N 368.33 50.560 3
Y 308.67 141.871 6
Total 328.56 118.780 9
Total N 426.25 116.456 8
Y 396.70 175.012 10
Total 409.83 148.418 18
C FR N 326.60 31.350 5
Y 336.50 60.523 4
Total 331.00 43.500 9
SV N 340.33 84.642 3
Y 240.83 80.041 6
Total 274.00 90.941 9
Total N 331.75 51.566 8
Y 279.10 84.975 10
Total 302.50 75.116 18
D FR N 605.00 200.400 5
Y 631.25 35.538 4
Total 616.67 144.031 9
SV N 488.67 67.530 3
Y 347.17 130.665 6
Total 394.33 129.678 9
Total N 561.38 166.963 8
Y 460.80 177.277 10
Total 505.50 175.388 18
The interaction between Model Complexity and
Interaction Style: F(3,12)=9.22, p<.01. For more
complex models, subjects with FR did better than
subjects with SV. Also, in terms of Errors, we found
a significant interaction between Interactivity and
Experience: F(1,16)=8.51, p<.01. That is, the FR
interaction was differentially more helpful to less
experienced subjects.
We also found two significant main effects for
Assembly Time. For Model Complexity
F(3,12)=18.3, p=0; the models had different
complexity as measured by completion time – more
difficult problems took longer. For Interaction Style
F(1,16)=12.7, p<.01, indicating the subjects were
able to complete the tasks in less time using the FR
interaction style. There were no significant
interactions.
SOME ASSEMBLY REQUIRED - Effectiveness Of Interactive 3D Graphics on Mobile Devices for Object Assembly
195
Finally, for the FR interaction we examined the
correlation between spatial ability (as measured by a
standard psychometric test) and the use of 1) the
rotation feature and 2) the animation feature. There
was a positive significant correlation (r=.810)
between spatial ability and subject's use of the
animation feature. High spatial ability subjects used
the feature significantly more. There was a negative
correlation (r=-.748) between spatial ability and the
use of the rotation feature. Low spatial ability
subjects relied on the feature significantly more.
0,00
1,00
2,00
3,00
4,00
5,00
6,00
7,00
NYNYNYNYNYNYNYNY
FR SV FR SV FR SV FR SV
ABCD
Model, Interaction, Experience
Errors
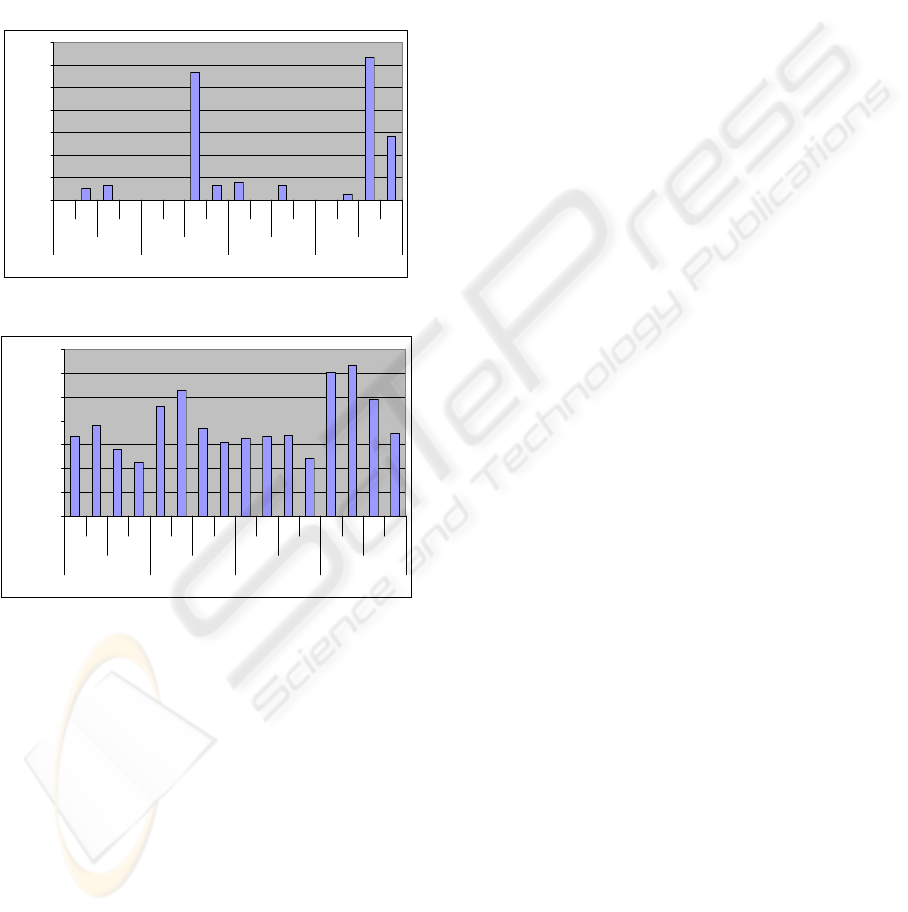
Figure 3: Mean Error Counts.
0.00
100.00
200.00
300.00
400.00
500.00
600.00
700.00
NYNYNYNYNYNYNYNY
FR SV FR SV FR SV FR SV
ABCD
Model, Interaction, Experience
Figure 4: Mean Assembly Times.
In terms of the research questions, we see that
users with the FR condition made fewer errors and
completed the task in less time. This suggests that
using 3D interactive representations as a component
of assembly instructions on a mobile device was
effective. Also, we can see from figures 3 and 4 that
the 4 models do exhibit varying degrees of
complexity as measured by Number of Errors and
Assembly Times and that these two measures 'agree'
on the ordering: A and C near equal in complexity,
followed by B, then D. In terms of visual
characteristics, it seems that the number of 'gaps'
between the pieces is the best predictor of
complexity and symmetry mattered less so.
5 SUMMARY
We examined the utility of interactive 3D graphics
as a component of a system to deliver instructions
for an assembly task – assembling Lego models. The
study results indicate that the presentation of models
with many gaps between the pieces were more
difficult to follow than was the case for models with
fewer gaps. However, being able to interact with the
model mitigated the complexity: even for small
examples such as these, the use of interactive 3D
graphics seems to be worth it.
ACKNOWLEDGEMENTS
This work was supported in part by the New Media
and Emerging Technologies initiative at Bowling
Green State University.
REFERENCES
Agrawala, M., et al., 2003. Designing effective Step-By-
Step Assembly Instructions. ACM Transactions on
Graphics, 22(3). 828-837.
Kashiwazaki, K., Kikuta, Y., Ohigashi, M., and Tanaka,
Y. 2005. Interactive 3D learning contents based on 3D
meme media architecture. In Proceedings of the 4th
international Symposium on information and
Communication Technologies, 92, 14-19.
Nousch, M., Jung, B., (1999). CAD on the World Wide
Web: Virtual Assembly of Furniture with BEAVER.
Proceedings of the Fourth Symposium on Virtual
Reality Modeling Language, 113-119.
Novick, L and Morse, D, Folding (2000). Folding a fish,
making a mushroom: The role of diagrams in
executing assembly procedures. Memory & Cognition
28, 1242-1256.
Tang, A., Owen, C., Biccca, F. and Mou, W.,
2003.Comparative Effectiveness of Augmented
Reality in Object Assembly. Proceedings of CHI 2003,
5(1), 73–80.
Virtual Manuals, http://www.parallelgraphics.com/virtual-
manuals/
Zimmerman, G., Barnes, J., Leventhal, L. , 2003. A
Comparison of the Usability and Effectiveness of
Web-Based Delivery of Instructions for Inherently-3D
Construction Tasks on Handheld and Desktop
Computers. Proceeding of the Eighth International
Conference on 3D Web Technology, 49-54.
Zimmerman, G. 2006 A Tool for the Automatic Creation
of Animated VRML Lego Model Assembly Task
Presentations. BGSU Department of Computer
Science Technical Report May-01-06.
GRAPP 2007 - International Conference on Computer Graphics Theory and Applications
196
