
CLASSIFICATION OF STUDENTS USING THEIR DATA
TRAFFIC WITHIN AN E-LEARNING PLATFORM
Marian Cristian Mihăescu and Dumitru Dan Burdescu
Software Engineering Department, University of Craiova, Bvd. Decebal Nr. 107, Craiova, Romania
Keywords: Models of analysis, machine learning, e-Learning.
Abstract: In this paper we present the results of am analysis process tha
t is used to classify students using the quantity
of the data traffic they transfer. We have performed students classification using data representing their
activity (D.D Burdescu et. al. Dec. 2006). Generally speaking the correlation between executed actions and
traffic is weak because dependencies are too weak or too complex (M. Sydow, 2005). Still, we propose an
analysis process specially designed to be used within e-Learning platforms that predicts Web traffic data
using only executed actions. Therefore, students classification using traffic data produces the same results as
classification based on performed actions but with great benefits regarding computational time and
complexity. We propose an algorithm for comparing two classifications made on students within an e-
Learning platform. This algorithm may be used to validate the correlations between classification
procedures that use different features.
1 INTRODUCTION
The paper describes a study that want to emphasize
the predictive power of the quantity of traffic a
student performs within an e-Learning platform. The
quantity of data traffic transferred by a student
represents a feature for the instances that are
involved in classification procedure.
The problem of finding a relation between
per
formed actions and data traffic has been
addressed in literature in (M. Sydow, 2005) where
correlations between link analysis and traffic were
made. Web graph topology is inherently connected
with Web navigation and thus with Web traffic. Due
to this, it seems to be interesting to try to use link
analysis data as attributes in Web traffic prediction
(M. Sydow, 2005).
So far, the results were not optimistic. The
gene
ral conclusion is negative, i.e. dependencies
between link analysis and traffic data are too weak
or too complex to be grasped by simple perceptron
(J. Zurda et. al) model (M. Sydow, 2005).
It was designed and developed an e-Learning
platform
(D.D Burdescu et. al. Aug. 2006) that has
implemented specific mechanism for monitoring and
storing actions performed by users and the amount
of transferred data traffic. Previous work has been
accomplished classification (D.D Burdescu et. al.
Dec. 2006) and clustering (D.D Burdescu et. al.
April 2006) of students using as features only the
performed actions during study time of students.
Still, this analysis is somehow complicated because
computing of features has to be done prior to model
creation and is time consuming. The procedure is
semi-automated since the data analyst has to specify
the features and their granularity and after that run a
software program that finally computes the values
that define each instance (in our case represented by
students).
User’s activity is monitored and recoded through
dedi
cated modules implemented within the platform.
From the design phase of the platform, there were
adopted two methodologies for monitoring actions.
Since the business logic of the platform is Java
based, log4j utility package was employed as a
logging facility and is called whenever needed
within the logic of the application. The utility
package is easy to use; a properties file manages the
logging process. The setup process states the logs
are saved in idd.log file. The main drawback of this
technique is that the data from the file is in a semi-
structured form. This makes the information
retrieval to be not so easy task to accomplish. On the
advantages, logging activity may be very helpful in
auditing the platform or even finding security
breaches. This logging facility is also very helpful
when debugging during development or when
analyzing peculiar behavior during deployment.
315
Cristian Mih
ˇ
aescu M. and Dan Burdescu D. (2007).
CLASSIFICATION OF STUDENTS USING THEIR DATA TRAFFIC WITHIN AN E-LEARNING PLATFORM.
In Proceedings of the Second International Conference on e-Business, pages 315-321
DOI: 10.5220/0002110303150321
Copyright
c
SciTePress
To overcome the semi-structured shape of logged
activity a structured way of gathering activity
information was enforced. The activity table was
added in the database and all actions were recorded
in the manner of one record per action. In the Table
1 it is presented the structure of activity table.
Table 1: Structure of activity table.
Field Description
id primary key
userid identifies the user who performed the
action
date stores the date when the action was
performed
action stores a tag that identifies the action
details stores details about performed action
level specifies the importance of the action
In (D.D Burdescu et. al. Aug. 2006) there was
performed a classification of students based on
features obtained from activity table and other tables
of the e-Learning platform.
Regarding the data traffic performed by students,
this study has two goals. Firstly, it wants to prove
that introducing the data traffic feature for each
instance (in this case each student) does not degrade
the accuracy of the classification process. More than
this, the study wants to prove that classification of
students using only the data traffic feature and using
the other features (nLoggings – number of loggings,
nTests – number of sustained tests, avgTests –
average grade of taken tests, nSentMsgs – number of
sent messages) produce two sets of classes that are
close one to the other in terms of distance defined in
section 2.2.
Section 2 presents the employed analysis
process. Section 2.1 presents the employed machine
learning algorithm that is used for creating classes.
Section 2.2 defines the formula and the procedure
used for measuring the distance between two classes
and between two sets of classes. Section 3 presents
the experimental results and section 4 presents the
conclusions and future works.
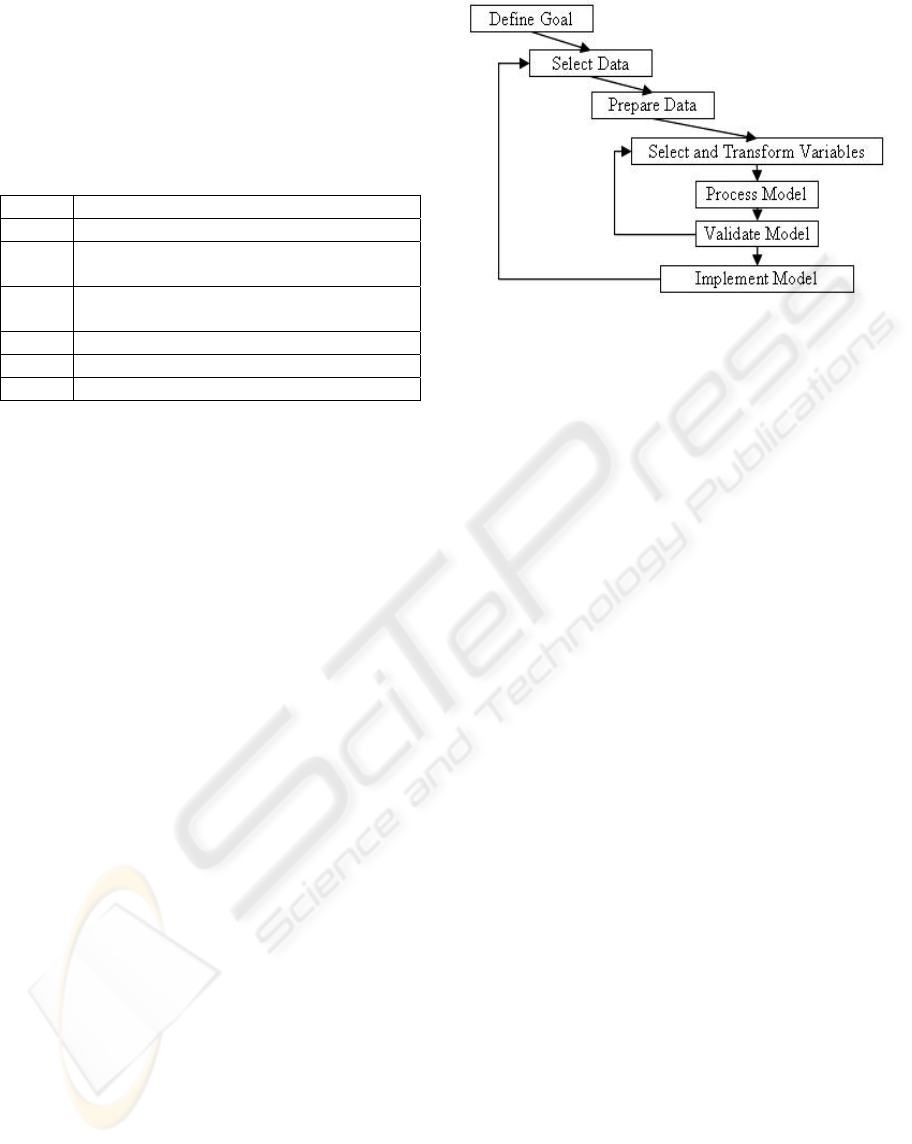
2 THE ANALYSIS PROCESS
The analysis framework employs state of the art
algorithms that represent the core of the modelling
process, which follows the classical steps of target
modelling (Olivia Parr Rud, 2001).
Figure 1: Steps for target modelling.
The analysis process is employed in different
flavours according with the specificity of the goal. In
this study is used one data set of instances
represented by the students. The data selection and
preparation is performed in semi-automatic manner.
The features describing the instances are manually
chosen but computations and data cleaning is
performed by employing a custom software
application.
2.1 Decision Tree Classification
A decision tree is a flow-like-chart tree structure
where each internal node denotes a test on an
attribute, each branch represents an outcome of the
test and leaf nodes represent classes (Quinlan,
J.R.,1986). So, the first step is to define a list of
attributes that may be representative for modelling
and characterizing student’s activity. Among the
attributes there may be: the number of logins, the
number of taken tests, the average grade for taken
tests, the exam results, the number of messages sent
to professors.
The basic algorithm for decision tree induction is
a greedy algorithm that constructs decision trees in a
top-down recursive divide-and-conquer manner. The
basic strategy is as follows. The tree starts as a
single node representing the training samples. If the
samples are all of the same class, then the node
becomes a leaf and is labelled with that class.
Otherwise, an entropy-based measure known as
information gain is used for selecting the attribute
that will best separate the samples into individual
classes. This attribute becomes the “test” or
“decision” attribute at the node. A branch is created
for each known value of the test attribute, and the
samples are partitioned accordingly. The algorithm
uses the same process recursively to form the
decision tree. Once an attribute has occurred at a
node, it need not be considered in any of the node’s
ICE-B 2007 - International Conference on e-Business
316

descendents. The recursive partitioning stops only
when one of the following conditions is true. All
samples for a given node belong to the same class.
There are no remaining attributes on which the
samples may be further partitioned. This involves
converting the given node into a leaf and labelling it
with the class in majority among samples (Quinlan,
J.R.,1986).
Impurity measures are an important parameter
regarding the quality of the decision tree. Many
different measures of impurity have been studied.
Some algorithms measure “impurity” instead of
“goodness” the difference being that goodness
should be maximized while impurity should be
minimized (Fayyad, U.M.,1992).
The first step is to create a set of instances that
hold the attributes. In the database there are 20
tables that hold the necessary data. Each student will
represent an instance and each instance will be
defined by its own attributes.
The next step effectively builds the decision tree.
The computational cost of building the tree is O(mn
log n)(Quinlan, J.R.,1986). It is assumed that for n
instances the depth of the tree is in order of log n,
which means the tree is not degenerated into few
long branches.
The information gain measure is used to select
the test attribute at each node in the tree. We refer to
such a measure an attribute selection measure or a
measure of goodness of split. The algorithm
computes the information gain of each attribute. The
attribute with the highest information gain is chosen
as the test attribute for the given set (Quinlan,
J.R.,1986).
2.2 Algorithm for Comparing Two Sets
of Classes
We define the set of students.
As it may be seen the algorithm will be presented for
students. The classification processes produces
two sets of classes and :
}...,,{
21 n
sssS =
n
1
C
2
C
}
1
1
...,
3
1
,
2
1
,
1
1
{
1
k
ccccC = and
}
2
2
...,
3
2
,
2
2
,
1
2
{
2
k
ccccC =
As it may be seen classification
1
produces
classes and produces classes.
C
1
k
2 2
Each class has assigned a number of students. For
:
C k
1
C
⎪
⎪
⎪
⎪
⎩
⎪
⎪
⎪
⎪
⎨
⎧
∈=
∈=
∈=
]},1[|{
1
1
...
]},1[
2
|
2
{
2
1
]},1[
1
|
1
{
1
1
1
1
n
k
i
k
i
s
k
c
ni
i
sc
ni
i
sc
,with
∪
]
1
,1[ k
i
S
i
s
∈
=
α
α
α
.
For :
2
C
⎪
⎪
⎪
⎪
⎩
⎪
⎪
⎪
⎪
⎨
⎧
∈=
∈=
∈=
]},1[|{
2
2
...
]},1[
2
|
2
{
2
2
]},1[
1
|
1
{
1
2
2
2
n
k
j
k
j
s
k
c
nj
j
sc
nj
j
sc
,with
∪
]
2
,1[ k
j
S
j
s
∈
=
β
β
β
.
The final goal is to define a metric for the distance
between two classification results,
1
and
2
C
.
Firstly, we have to define the distance between two
classifications of students.
C
For two classes of students
c
and we define:
1 2
c
M
- the number of students that may be found in
both classes;
m
- the number of students that may be found in
1
but not in and that may be found in but not in
;
c
2
c
2
c
1
c
||
i
c - the number of students from class ;
i
c
Mc
−
=
||
1
α
- the number of students from class
that may not be found in class
c
;
1
c
2
Mc
−
=
||
2
β
- the number of students from class
that may not be found in class ;
2 1
From these definitions it may be seen that
c c
m
=
+
β
α
.
We define:
||||
)(2
1),(
21
21
cc
M
ccd
+
+
−
−=
β
α
- the distance
between classes , ;
1
c
2
c
CLASSIFICATION OF STUDENTS USING THEIR DATA TRAFFIC WITHIN AN E-LEARNING PLATFORM
317

The distance between two classes is small when
M
is large (there are many common students) and is
small (there are few different students).
m
Ideally, if and
0),(
21
=ccd ||||
21
ccM ==
0=+=
β
α
m
. This is the situation when the
number of students in both classes is the same and
the students themselves are the same.
In the worst case, if
1),(
21
=ccd
0
=
M
and
. This is the situation when the
classes have no student in common.
||||
21
ccm +=
For example, if and :
30||
1
=c 45||
2
=c
Case 1: and than
20=M 35=m
91.0
75
3540
1),(
21
=
−
−=ccd
Case 2: and than
23=M 29=m
78.0
75
2946
1),(
21
=
−
−=ccd
Case 3: and than
25=M 25=m
67.0
75
2550
1),(
21
=
−
−=ccd
Case 3: and than
30=M 15=m
4.0
75
1560
1),(
21
=
−
−=ccd
It may be observed that, as
M
increases and
decreases the distance between classes decreases.
m
Using the above formalism there for each class ,
in there is assigned the nearest
class , from . The assignation
procedure is presented below.
i
c
1
|]|,1[
1
Ci ∈
1
C
j
c
2
|]|,1[
2
Cj ∈
2
C
procedure AssignClasses ( , ){
1
C
2
C
for (int i=0; i< , i++){
||
1
C
int // the distance
;0
max
=d
//between two classes:
// from and from
i
c
1
1
C
j
c
2
2
C
for (int j=0; i< , i++){
||
2
C
if ( ) than ;
max21
),( dccd
ji
> ),(
21max
ji
ccdd =
}
;
j
ciC
22
][ =
}//end for
After for each class in
1
C
there was assigned a class
from
2
(the closest one) there may be computed
the distance between the two sets of classification
schemes that were employed on the same students.
We define:
C
|)
2
||,
1
max(|
|)
2
||,
1
max(|
1
)
2
,
1
(
)
2
,
1
(
CC
CC
i
i
c
i
cd
CCD
∑
=
=
This formula ideally obtains a distance value of 1
when the sets of classes are identical in terms of
number of classes and students that reside in each
class.
For example:
},,,{
4
1
3
1
2
1
1
11
ccccC = and },,{
3
2
2
2
1
22
cccC =
After computing the distances between classes there
are obtained the assignments presented in Table 2.
Table 2: The Assignments and distances between class
sets and
C
1
C
2
1
C
1
1
c
2
1
c
3
1
c
4
1
c
2
C
1
2
c
3
2
c
2
2
c
2
2
c
),(
21
ii
ccd
0.7 0.5 0.85 0.2
For these class sets
56.0
4
2.085.05.07.0
),(
21
=
++
+
=CCD
3 EXPERIMENTAL RESULTS
There were performed experiments with datasets
obtained after six month in which the e-Learning
platform was on line. In activity table there were
about 40.000 recorded actions for 375 students.
Besides activity and traffic data, student’s sent
messages and other activities like self-testing were
recorded in other tables of the platform.
The Decision Tree creation algorithm was used
to perform the classification on the data. The
implementation is in the Waikato Environment for
Knowledge Analysis (Weka), Weka (Holmes G.,
1994) is a system developed at the University of
Waikato in New Zealand. Weka is written in Java,
an object-oriented programming language that is
widely available for all major computer platforms,
and Weka has been tested under Linux, Windows,
and Macintosh operating systems. Java provides a
uniform interface to many different learning
algorithms, along with methods for pre- and post
processing and for evaluating the result of learning
schemes on any given dataset.
ICE-B 2007 - International Conference on e-Business
318

Firstly, there was performed a manual feature
selection. From large number of features that
describe the activity of a student there were chosen
five attributes: nLogings – the number of loggings,
nTests – the number of taken tests, avgTests – the
average of taken tests, nSentMessages – the number
of sent messages and dataTraffic – the traffic
transferred by the student. For each registered
student the values of these attributes are determined
based on the raw data from the log files and database
relations. Each student is referred to as an instance
within classification process.
The values of attributes are computed for each
instance through a custom developed off-line Java
application. The outcome of running the application
is in the form of a file called activity.arff that will
later be used as source file for Weka workbench.
The activity.arff file has a standard format which
is composed of two sections. In the first one there is
defined the name of the relation and the attributes.
For each attribute there is defined the set of nominal
values it may have. In the next lines it is presented
the first section of the file.
@relation activity
@attribute nLogings {<10,<50,<70,<100,>100}
@attribute nTests {<10,<20,<30,<50,>50}
@attribute avgTests {<3,<6,<10}
@attribute nSentMessages
{<10,<20,<30,<50,>50}
@attribute dataTraffic {<10,<20,<30,<50,>50}
In this section of the file are defined all
attributes. An important decision that is needed is to
establish the granularity for each attribute which is
represented by the number of nominal values it may
take. As it can be seen from the above presented
lines we consider five intervals for nLogings
parameter: less than ten, less than fifty, less than
seventy, less than one hundred and greater than one
hundred. In the same there are defined the set of
possible values for each of the attributes.
The second section of the activity.arff file is
represented by the data itself. Here are all the
instances that will enter the classification process. In
the next lines there are presented few instances that
may be found in this section.
@data
<50,<20,<3,<10,<10,
<50,>50,<6,<20,<20,
<10,<20,<3,<10,<30,
<50,<10,<3,<10,<10,
<100,<50,<10,<50,>50
Each row represents an instance. For example,
the first row represents an instance (a student) which
entered the platform less than fifty times, took less
than twenty tests, obtained an average of grades for
taken tests less than three, sent less than ten
messages to professors and had less than 10MB of
data traffic. In the same way there can be interpreted
all other instances. At this point we may say we have
obtained useful data that may be used for
experimentation with machine learning schemes.
The original dataset was divided into a training of
90% of instances and a test set of 10 % of instances.
The granularity for the nominal values of the
features can be also increased. In our study we
considered only five possible values but we can
consider testing the algorithm with more possible
values. This should have great impact on the number
of obtained classes. The time taken by the algorithm
to produce results should also increase.
In order to prove that data traffic feature does not
degrade the accuracy of classification process
presented in (D. D. Burdescu, Dec. 2006) in which
only four features (nLogings, nTests, avgTest and
nSentMessages) were used there was performed
another classification in which the dataTraffic
feature was added. The algorithm presented in
Section 2.3 was than used to compute the distance
between classifications.
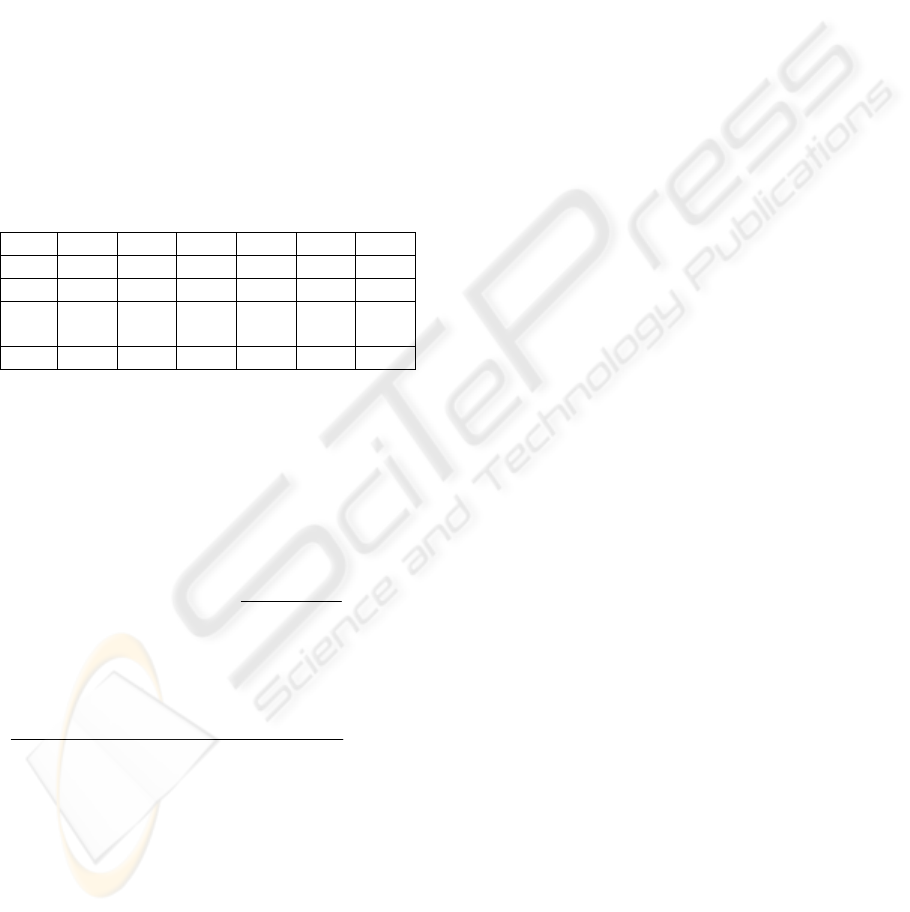
Table 3 presents the results of the two
classifications.
Table 3: Results of the classification 1 and 2.
A B C D E F
C 1 45 82 12 113 90 33
C 2 39 87 15 107 95 52
Com./
Diff.
38/8 80/9 12/3 106/14 88/7 51/4
Dist. 0.19 0.1 0.22 0.1 0.08 0.06
Classification 1 (C1) is performed with four
features and classification 2 is performed with five
features (four from first classification and
dataTraffic feature).The results show that class A in
classification 1 has 45 instances and in classification
2 has 39 instances. 38 instances are common in both
classes and 8 (7 from class 1 and 1 from class 2) are
different. The distance between these classes is:
19.0
84
)8382(
1),(
21
=
−
−=
x
AAD
ClassifClassif
The distance between classification 1 and 2 is:
125.0
6
06.008.01.022.01.019.0
)2,1(
=
+++++
=CllassifClassifD
The accuracy of each classification is determined by
checking how well the model fits the data. For this it
CLASSIFICATION OF STUDENTS USING THEIR DATA TRAFFIC WITHIN AN E-LEARNING PLATFORM
319
is computed the percentage of correctly classified
instances from the test data given the model. For
classification 1 the percentage of the correctly
classified instances is 85.6 while for classification 2
the percentage is 85.9 which shows a little
improvement. Both results are promising regarding
the possibility of classifying students based on their
activity and traffic.
In order to prove that dataTraffic feature has the
same predictive power as other four features
(nLogings, nTests, avgTest and nSentMessages)
another study has been performed. Classification
three uses as feature only the dataTraffic. The
algorithm presented in Section 2.3 is used for
computing the distance between classification 1 and
classification 3.
Table 4 presents the results of the classification
one and classification three.
Table 4: Results of the classification 1 and 2.
A B C D E F
C 1 45 82 12 113 90 33
C 2 40 85 14 109 93 54
Com./
Diff.
40/5 81/6 11/5 109/4 89/4 51/6
Dist. 0.11 0.06 0.34 0.03 0.04 0.1
Classification 1 is performed with four features
and Classification 2 is performed only with
dataTraffic feature. The results show that class A in
classification 1 has 45 instances and in class 2 has
40 instances. 40 instances are common in both
classes and 5 (5 from classification 1 and 0 from
classification 2) are different. The distance between
these classes is:
11.0
85
)5402(
1),(
31
=
−
−=
x
AAD
ClassifClassif
The distance between classifications 1 and 3 is:
11.0
6
1.004.003.034.006.011.0
)3,1(
=
+++++
=ClassifClassifD
As in previous study, the accuracy of each
classification is determined by the accuracy of
classifying test data against the model. For
classification 1 the value of accuracy is 85.6 while
for classification 3 the value of the accuracy is 86.3.
The results for classification 3 is very promising
regarding the possibility of classifying students
based only on their data traffic.
4 CONCLUSIONS
The paper presents a data analysis procedure that
allows classification of students using as feature the
amount of transferred data traffic.
As starting point there are used the results from
(D. D. Burdescu, Dec. 2006) which classified
students using as features only the performed
activities. Since we have designed and developed the
e-Learning platform it was quite easy obtaining the
data regarding the performed activities and data
traffic for each student. This raw data was cleaned
and transformed into ARFF format (Holmes G.,
1994) such that state of the art machine learning
algorithms may be run. The C4.5 algorithm
(Quinlan, J. R.,1993) implemented in Weka
workbench was employed to perform the analysis.
The analysis had two goals. Firstly, we wanted
to prove introduction of dataTraffic feature does not
degrade the accuracy of the classification obtained in
(D. D. Burdescu, Dec. 2006) that used four features
(nLogings, nTests, avgTest and nSentMessages)
representing the actions performed by students. For
achieving this conclusion there were followed two
directions. One wanted to show that newly obtained
classes are similar with original ones in terms of
students distribution. For this computation there was
defined a distance function between two sets of
classes. On a range from 0 to 1 the distance between
classifications was found 0.125, where 0 means the
classifications are identical and 1 means the
classifications have no classes with common
instances. This result, collaborated with the
increase in classification accuracy from 85.6 to 85.9
prove that the second classification model has a
greater accuracy while is still close to the first one.
The second goal was to prove that classification
using only dataTraffic feature produces quite the
same students distributions into classes and does not
degrade accuracy.
Classification 3 was obtained using only
dataTraffic feature. The distance between this
classification and classification 1 was found to be
0.11, which represents a very promising result. This
means that using only data traffic feature there was
obtained almost the same distribution of students
into classes. More than this, the measured accuracy
increased from 85.6% to 86.3% which means the
model obtained in classification 3 is more accurate
that classification 1.
The comparative analysis is performed by
employing a classical metric like classification
accuracy and a custom defined distance between
classifications and between classes themselves.
ICE-B 2007 - International Conference on e-Business
320

Definition and computation of custom metrics is in
the form of a newly proposed algorithm.
The final conclusion is that data traffic
performed by a student within an e-Learning
platform might provide important knowledge about
the student himself and about the platform.
As future work, there are many places where
there may be used different approaches such that
final results to be more effective. One of the most
important aspect regards the employed machine
learning algorithm. Further studies should be
performed by employing other machine learning
algorithms like Fuzzy C-Means. Feature selection is
another important aspect. Currently, domain experts
use their domain knowledge to manually define the
features set and their granularity. Still, choosing
features in an semi-automatic fashion might bring
improvements. In this case semi-automatic means
that a custom application provides its best solution
but the domain expert is the one that has the final
choosing of feature names and values.
REFERENCES
D. D. Burdescu, C. M. Mihăescu (December 2006).How
Learner's Proficiency May Be Increased Using
Knowledge about Users within an E-Learning
Platform. Informatica - An International Journal of
Computing and Informatics, Ljublijana, Slovenia, 433-
438.
M. Sydow (2005). Studying dependencies among Web
traffic and link analysis data using perceptron.
Proceedings of the IEEE/WIC/ACM International
Conference on Web Intelligrnce (WI’05), pp. 124-127.
D. D. Burdescu, C. M. Mihăescu (August 2006). Tesys: e-
Learning Application Built on a Web Platform,
Proceedings of International Joint Conference on e-
Business and Telecommunications, Setubal, Portugal,
pp. 315-318.
C. M. Mihăescu, D. D. Burdescu (April 2006). Employing
Clustering Methods for Analyzing User Traffic with
Data from an E-Learning Platform. Proceedings of the
4-th International Multiconference on Computer
Science and Information Technology, Amman, Jordan,
pp. 176-185.
Olivia Parr Rud (2001). Data Mining Cookbook –
Modeling Data for Marketing, Risk, and Customer
Relationship Management. Wiley Computer
Publishing.
Guha, S, Rastogi, R., and Shim K. (2005). ROCK: A
Robust Clustering Algorithm for Categorical
Attributes. In Proceedings of the IEEE Conference on
Data Engineering.
Berry, M.J.A. and Linoff, G. (1996). Data Mining
Techniques For Marketing, Sales and Customer
Support. John Wiley & Sons, Inc., USA.
Fayyad, M.U., Piatesky-Shapiro, G., Smuth P.,
Uthurusamy, R. (1996), Advances in Knowledge
Discovery and Data Mining. AAAI Press.
Ian H. Witten, Eibe Frank (2000). Data Mining – Practical
Machine Learning Tools and Techniques with Java
Implementations. Morgan Kaufmann Publishers.
Holmes, G., Donkin, A., and Witten, I.H. (1994). Weka: a
machine learning workbench. Proceedings of the 1994
Second Australian and New Zealand Conference on
Intelligent Information Systems, Brisbane, Australia,
pp. 357- 361.
Ian H. Witten, Eibe Frank (2000). Data Mining – Practical
Machine Learning Tools and Techniques with Java
Implementations. Morgan Kaufmann Publishers.
M.Sydow (2005). Can link analysis tell us about Web
traffic? Proceedings of the ACM 14th International
World Wide Web Conference (Special Interest Track,
Papers & Posters), Chiba, Japan, ACM Press.
M.Sydow (2005). Studying dependencies among Web
traffic and link analysis data using perceptron.
Proceedings of IEEE/WIC/ACM Web Intelligence
Conference, IEEE Computer Society Press, pp. 124-
127.
J. Zurada, M. Barski, W. Jedruch. Sztuczne Sieci
Neuronowe (1996). Polish, eng. Artificial Neural
Networks).PWN, Warsaw.
Quinlan, J.R.(1986). Induction of decision trees, Machine
Learning. 1(1), pp. 81-106.
Fayyad, U.M. & Irani, K.B. (1992). The attribute
specification problem in decision tree generation. In
Proceedings of the Tenth National Conference on
Artificial Inteligence, San Jose, CA, AAAI Press, pp.
104-110.
Buntine, W., & Nibblet T. (1992). A further comparison of
splitting rules for decision-tree induction. Machine
Learning, 8, pp. 75-85.
Quinlan, J. R. (1993). C4.5: Programs for Machine
Learning. Morgan Kaufmann Publishers.
CLASSIFICATION OF STUDENTS USING THEIR DATA TRAFFIC WITHIN AN E-LEARNING PLATFORM
321
