
FORMAL ANALYSIS METHODS OF NETWORK SECURITY
DESIGN
Mariusz Stawowski
Cybernetics Faculty, Military University of Technology, Warsaw, Poland
Keywords: Network Security Principles, Security Design Analysis, Graph Models and Methods, Formal Security
Analysis.
Abstract: An assessment of network security design correctness requires an analysis of many aspects, e.g. security
zones correctness, access control protection layers as well as protections tightness against intrusions. Using
formal methods based on graph theory in medium up to large-scale networks can greatly speed up and
improve accuracy of performing security analysis. The analysis models and methods described in this
document allow for quick identification of network security design errors resulted from breaking the
“Compartmentalization of Information” and the “Defense-in-Depth” security principles, checking if
protections used allow for security incidents handling as well as verification of many other security aspects.
The analysis methods developed here can be used during network security design process and also for
security assessment of existing computer information systems.
1 INTRODUCTION
Network security design verification is performed
mainly based on IT systems security principles and
risk analysis results. Security analysis in medium
and large-scale networks is a complicated and time-
consuming task. Mistakes can be made easily and
security holes can be overlooked. The difficulties
result mainly from the fact, that network security
system is composed of many different, integrated
elements. Network security operations also depend
on IT systems environment.
The analysis can be performed using formal and
informal methods (e.g. engineering practices).
Attempts to develop standards and formal analysis
methods are being made in many scientific centres.
Proven world-wide frameworks and guidelines exist
in the fields of IT security management and insuring
CIA Triad (e.g. COBIT, IATFF, ITIL, ISO 27001).
There is an apparent progress in the development of
network security analysis methods based on the
graph theory (e.g. Attack Graphs, Archipelago
project). The research is still required in the field of
formal assessment of network security design
correctness (e.g. network security zones correctness,
proper design of network protection layers like
firewalls, intrusion prevention, content control and
anti-virus systems).
2 NETWORK SECURITY DESIGN
PRINCIPLES
The rules and guidelines for network security
designing were elaborated by the organizations
specializing in IT security (e.g. CERT, DISA, NIST,
NSA, SANS). During an analysis of the network
security design, the following basic IT systems
security principles should be taken into account:
"Compartmentalization of Information" - IT
system resources of different sensitivity levels
(i.e. different value and threat susceptibility)
should be located in different security zones.
An extension of this rule is an "Information
Hiding" principle, which says that IT system
makes available only such data which are
necessary for conducting the IT system tasks.
"Defense-in-Depth" – protection of IT system
resources is based on many security layers.
The extensions to this principle are the
following rules: "Layered Protections" –
security layers complement and insure one
another; "Defense in Multiple Places" –
security layers are located in different places
of the IT system.
"The Principle of Least Privilege" – IT system
subjects (e.g. users, administrators) should
313
Stawowski M. (2007).
FORMAL ANALYSIS METHODS OF NETWORK SECURITY DESIGN.
In Proceedings of the Second International Conference on Security and Cryptography, pages 313-318
DOI: 10.5220/0002118903130318
Copyright
c
SciTePress

have minimal privileges necessary for proper
functioning of the organization. This rule
applies also to data and services made
available for external users.
An extension to this rule is a "Need-To-
Know" principle which says that users and
administrators of IT system have access to
information relevant to their position and
duties performed.
"Weakest link in the chain" – a security level of
the IT system depends on the most weakly
secured element of the system.
There is also known the "Defense Through
Diversification" principle which extends the
„Defense-in-Depth” rule. It says that security of IT
system resources should be based on protection
layers consisting of different types of safeguards.
When two layers of the same type are being used,
they should come from different vendors. The rule
should be used with caution because it increases
complexity of security system and because of that
obstructs its proper management and maintenance.
3 NETWORK MODELS
3.1 Network Security Model
In order to perform security design analysis using
formal methods, the mathematical model of IT
system focused on mapping network protections has
been developed. The basic element of the model is a
graph describing IT system’s network structure as
well as functions defined in its vertices and edges
representing IT system network and protections
features.
The IT system network security model can be
presented as a vector
S = < G , { λ } , { β } , D
b
>
(1)
where:
G = < Z , L > - an undirected graph describing
IT systems network structure (so called network
security graph),
Z – a set of G graph’s vertices representing IT
system’s resources (i.e. information and service
resources, network and security devices),
L – a set of G graph’s edges representing direct
connections between IT system’s resources (i.e.
cabling and L2 OSI devices),
{ λ } – set of functions on the G graph’s vertices,
{ β } – set of functions on the G graph’s edges,
D
b
– a binary matrix describing the security
analysis scope.
[
]
KV
b
ij
b
dD
×
=
(2)
where:
V – set of IT systems threats,
K – set of network safeguards types,
d
ij
is 1 if the j safeguard protects against the i
threat, and 0 otherwise.
Vertices in the G graph represent different IT
system’s resources (i.e. information and service’s
resources, network L3 devices, security devices). In
order to perform an analysis more efficiently, the
resources should be grouped. The following rules for
grouping the resources are being applied: the
resources are in the same location and in the same
L2 network segment, the resources have the same
security requirements, the resources perform the
same IT system tasks, e.g. Internet services servers,
remote access servers, e-commerce servers, internal
application servers, user workstations, monitoring
and management systems, etc.
3.2 Network Threats Model
In order to efficiently perform an analysis of
network communication control, which can be
exploited for conducting potential attacks, we
construct the network threat model. The model is
constructed with an assumption that vulnerabilities
of applications and operating systems will arise
allways and it is only matter of time, they are
detected and exploited for security violations. Based
on this assumption we can further assume, that when
the specific network service is available for an
intruder, then he potentially can exploit it for
performing a security violation. Because of this,
every network communication with IT system’s
resources allowed by firewalls can potentially be
exploited for performing an attack.
The IT system network threats model can be
presented as a vector
T
Z
= < G
T
, A
b
> (3)
where:
G
T
= < Z
T
, Ł > – a digraph describing
communication in a computer network, where
potentially the attacks can appear (so called
network threats graph),
Z
T
– a set of G
T
graph’s vertices representing IT
system’s resources,
SECRYPT 2007 - International Conference on Security and Cryptography
314
Ł – a set of G
T
graph’s edges representing the
communication in a computer network,
A
b
– a binary mattrix describing network
services available in the communication.
[
]
ŁUs
b
ij
b
aA
×
=
(4)
where:
U
S
– set of the network services,
a
ij
is 1 if the i service is available in the network
communication of the j edge, and 0 otherwise.
G
T
graph constructing is based on G graph and
performed in the following manner:
1. The vertices which do not represent information
or service resources are removed from the
graph. In order to make the further analysis
easier, the numbering of vertices in the new
graph is the same as in the network security
graph.
2. The vertices of a new graph are linked by edges
if the following conditions are met:
there is a path between vertices in the
network security graph (i.e. potentially it
might be the communication between the
resources represented by these vertices),
access control mechanisms (firewalls)
allow for a specific communication in the
network between IT system resources
represented by these vertices (i.e. an attack
can potentially be performed using this
path in the network).
4 ANALYSIS OF NETWORK
SECURITY DESIGN
The basic security means of computer networks are
firewalls (i.e. dedicated firewall devices, firewall
means in intrusion prevention system (IPS) devices
and access control lists (ACL) in network routers
and switches). Using firewalls a proper network
security architecture is created. Firewall protections
divide the IT system network infrastructire into
security zones and control communication between
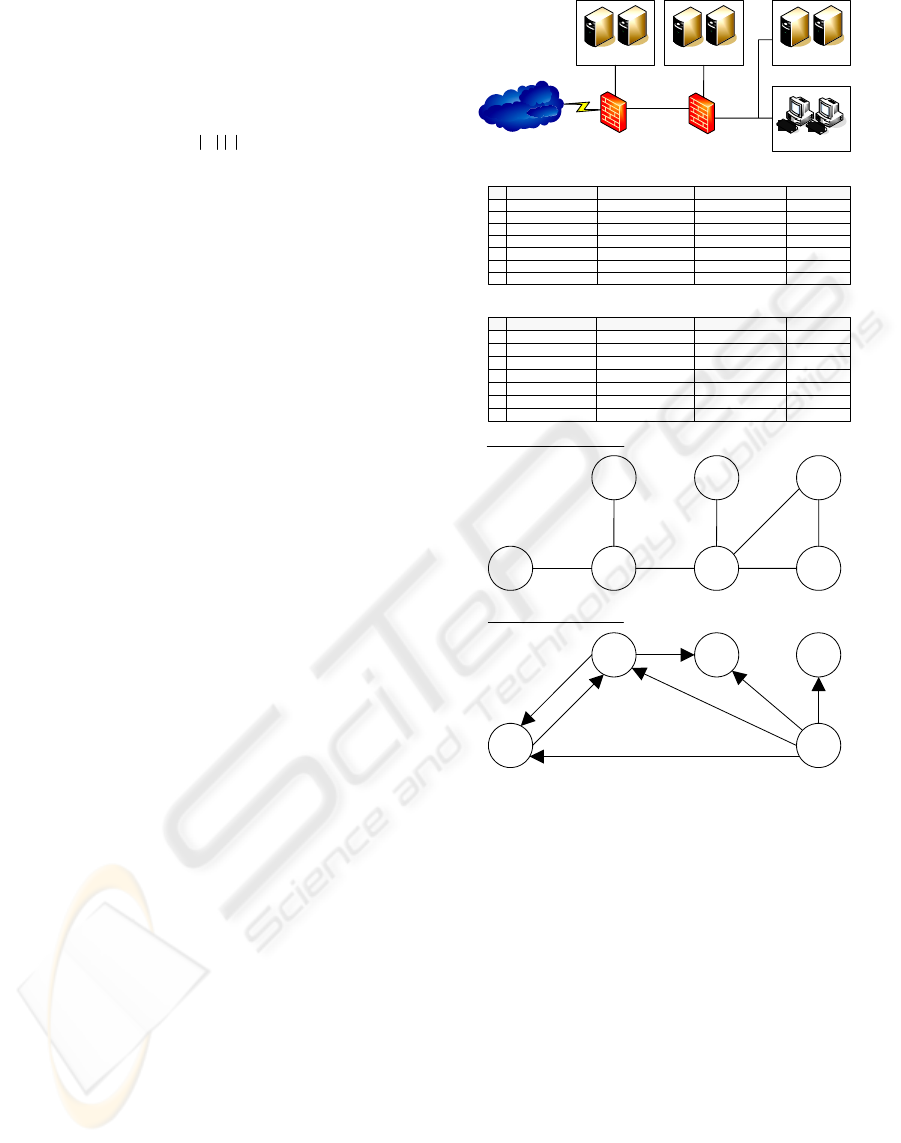
them. An example of the network and its formal
models is shown in figure 1.
The IT system’s network security design
analysis is performed based on risk analysis results
and design rules. The fundamental principles of
network security design are "Compartmentalization
of Information" and "Defense-in-Depth".
Figure 1: An example of formal models construction.
From the „Compartmentalization of Information”
principle results the following detailed network
security design rules:
1. IT system resources of different sensitivity
level should be located in different security
zones, i.e.:
devices and computer systems providing
services for external networks (e.g. the
Internet) should be located in different
zones (so called DMZ) than internal
network devices and computer systems,
strategic IT system resources should be
located in dedicated security zones,
devices and computer systems of low
trust level such as remote access devices
RAS and wireless networks (WLAN)
access devices should be located in
dedicated security zones,
Internal
firewall
/IPS
`
Internal firewall access control rules
`
LAN users
LAN servers
Perimeter
firewall
Internet
DMZ servers
G graph of network security model
DB servers
Internet
(1)
Perimeter
firewall
(2)
DMZ
servers
(3)
Internal
firewall
/IPS
(4)
DB
servers
(5)
LAN
users
(7)
LAN
servers
(6)
Perimeter firewall access control rules
G’ graph of network threats model
Internet
(1)
DMZ
servers
(3)
DB
servers
(5)
LAN
users
(7)
LAN
servers
(6)
SMTP, DNS
HTTP, SMTP,
DNS
HTTP, HTTPS
HTTP, HTTPS,
IMAP, DNS
HTTP, HTTPS,
FTP, NetBIOS
SQL
SQL
Source Destination Service Action
Any DMZ servers HTTP, SMTP, DNS Accept
DMZ servers DB servers SQL Accept
LAN users Any HTTP, HTTPS Accept
LAN users
DMZ servers IMAP Accept
Any Any Any Drop
DMZ servers Any SMTP, DNS Accept
Any Perimeter firewall Any Drop
No
1
2
3
4
5
6
7
Source Destination Service Action
Any Any Any Drop
LAN users LAN servers FTP, NetBIOS Accept
LAN users Any HTTP, HTTPS Accept
LAN users DMZ servers IMAP, DNS Accept
No
1
2 DMZ servers, LAN users DB servers SQL Accept
Any DB servers Any Drop
Any Internal firewall Any Drop
3
4
5
6
7
FORMAL ANALYSIS METHODS OF NETWORK SECURITY DESIGN
315

2. IT system resources of different types should be
located in separate security zones, i.e.:
user workstations should be located in
different security zones than servers,
network and security management
systems should be located in dedicated
security zones,
systems in development stage should be
located in different zones than
production systems.
Using the network security model (1) it can be
verified that the network security design applies to
the „Compartmentalization of Information” and
"Defense-in-Depth" principles.
4.1 Assessment of Security Zones
Design Correctness
In the properly designed security system, which
apply to the „Compartmentalization of Information”
principle, information and services resources of
different sensitivity level should be located in
separate security zones. Verification of security
design correctness in this respect can be quickly
performed based on the analysis of adjacency matrix
of the G graph from the network security model (1).
[]
[]
TRUE)j()i(1]j,i[M
∀
WW
b
1)j(∧1)i(:Z∈j,i
RR
=λ=λ⇒=
=λ=λ
(5)
where:
M
b
– G graph’s adjacency matrix,
λ
R
– function describing if the IT system resource
is the information or service resource,
λ
W
– function describing the IT system sensitivity.
The IT system resource sensitivity depends on its
value for the company and susceptibility to threats.
A resource has a high sensitivity when its value and
threat susceptibility are high. The λ
W
function is
calculated based on the λ
A
function and the X
b
matrix, using the following formula.
() ()
∑
|V|
1v
b
AW
Zi(i,v);Xiλiλ
=
∈+=
(6)
where:
λ
A
– function describing the IT system resource
value,
V – set of IT system resources threats.
X
b
binary matrix describes the IT system
resources susceptibility to network threats. Matrix
values are calculated based on the risk analysis
results.
[
]
VZ
b
ij
b
xX
×
=
(7)
where:
x
ij
is 1 if the susceptibility of the i resource to the j
threat is relevant, and 0 otherwise.
The „Compartmentalization of Information” rule
applies also to resources of different type (i.e. public
servers, internal servers, RAS servers, test systems,
management systems and workstations), which
should be located in separate security zones.
[]
[]
TRUE)j()i(1]j,i[M
∀
TT
b
1)j(∧1)i(:Z∈j,i
RR
=λ=λ⇒=
=λ=λ
(8)
where:
λ
T
– function describing the IT system resource
type.
So the assessment of the network security design
correctness in respect of the security zones is
performed by the verification that (5) and (8)
conditions are fulfilled using the adjacency matrix
M
b
and the functions λ
R
, λ
T
and λ
W
.
4.2 Assessment of Firewall Protection
Layers Tightness
The compliance with "Defense-in-Depth" principle
requires that in network path between a threat source
and a sensitive IT system resource there is at least
two access control devices (i.e. two firewall
devices). The security tightness analysis problem
described here can be solved by finding and
analyzing the shortest path in the graph (1).
For the assessment of the network security
design correctness, one of the well-known graph
theory algorithms can be used, e.g. the Bellman-
Ford or the Dijkstra algorithm. In order to do this,
the G graph of the network security model should be
converted into G’ digraph, so all the G’ graph’s
edges are directed. The edges direction is specified
based on the IP routing settings in the computer
networks of IT system.
The network security design analysis in respect
of compliance with the "Defense-in-Depth" rule for
access control protections is performed in the
following sequence:
1. Finding in the G’ graph the shortest paths
between vertices representing potential threat
sources and vertices representing sensitive IT
SECRYPT 2007 - International Conference on Security and Cryptography
316

system resources of information and services
type.
2. If in the G’ graph, the path of cost lower than 3
is found, then "Defense-in-Depth" principle
is violated in the network security design.
3. If in the G’ graph the path of cost 0 is found,
then the sensitive resource is not protected at
all by the access control protections. This
means a serious design error.
The necessary condition for network access
control protections compliance with the „Defense-
in-Depth” principle can be formulated as follows.
TRUE3)a(
|Kij|
1a
W
Dav)j,imin(:Zj,i
=
⎥
⎦
⎤
⎢
⎣
⎡
≥β∀
∑
=
∈μ∈
(9)
where:
β
W
– function describing if the network
connection is protected by the access control
protections (firewall),
μ
min
(i,j) – the shortest path between the i and the j
vertices,
K
ij
– set containing all the G’ graph’s edges
belonging to the μ
min
(i,j) path,
D
av
– set of all the shortest paths in the G’ graph
between potential threat sources and sensitive IT
system information and services resources,
}Zj,i;5)j(1)j(1)i(
:)j,i({D
WRG
minav
∈>λ∧=λ∧=λ
μ=
(10)
λ
G
– function describing if the resource can be a
threat source.
4.3 Assessment of Intrusion Prevention
Systems Tightness
The IPS protections are responsible for detecting and
blocking penetrations and attacks conducted by
intruders and malicious applications (e.g. Internet
worms). When designing IPS protections the threat
of conducting attacks through encrypted sessions
(e.g. SSL) should also be taken into account. IPS is
not able to inspect these sessions. An effective
protection method is to decrypt the sessions prior to
IPS devices and inspect unencrypted packets.
Ensuring a proper IT systems safety against
intrusions requires designing a relevant IPS
protections, i.e. in the network path between
potential threat sources and sensitive IT system
resources there should be security devices
performing the IPS functions; furthermore the IPS
protections should operate on the network
connections where the traffic is not encrypted.
The IPS protections tightness analysis problem
described here can be solved by finding and
analyzing the shortest paths in the graph (1). For this
task one of the well-known graph theory algorithms
can be used. Similarly to the access control
protections analysis, the G graph should be
converted into the G’ digraph.
The network security design analysis in respect
of compliance with "Defense-in-Depth" principle for
IPS protections is performed in the following
sequence:
1. Finding in the G’ graph the shortest paths
between vertices representing potential threat
sources and vertices representing sensitive IT
system resources of information and services
type, for which IPS protection is required.
2. Finding in the G’ graph the path of 0 cost
means that the security design is incorrect.
The necessary condition for ensuring the IPS
protections tightness can be formulated as follows.
TRUE0)a(
|Kij|
1a
S
Dap)j,imin(:Zj,i
=
⎥
⎦
⎤
⎢
⎣
⎡
>β∀
∑
=
∈μ∈
(11)
where:
β
S
– function describing if the communication in
the network connection is effectively controlled
by the IPS (i.e. it is not encrypted and is
controlled by the IPS),
D
ap
– set of all the shortest paths in the G’ graph
between potential threat sources and the sensitive
resources requiring IPS protection,
}Zj,i;1)j(1)j(1)i(
:)j,i({D
IRG
minap
∈=λ∧=λ∧=λ
μ
=
(12)
λ
I
– function describing if the resource requires
IPS protection (calculated from X
b
and D
b
).
The network security design analysis can be
enhanced by using the network threats model (3).
For example, using the G
T
graph’s path matrix, the
IT system resources reachable from the identified
threat source can be quickly found and the security
layers tightness analysis can be performed only for
them (e.g. IPS analysis not performed for the paths
blocked by the firewalls).
FORMAL ANALYSIS METHODS OF NETWORK SECURITY DESIGN
317

4.4 Assessment of Incident Handling
Readiness
The IT system’s protections should be prepared for
security breaches. During the incident handling, it is
necessary to block the attack source and limit
spreading the incident to other systems.
Administrator has at her/his disposal two basic
incident handling methods: disconnecting the system
from the network and restoring its proper operation
(e.g. from the backup copy) or restoring the system
operation without disconnecting it from the network.
The systems of high availability requirements
(i.e. mission-critical systems) can not be
disconnected from the network until the incident is
handled and its effects eliminated. In such systems
the available access control and intrusion prevention
means should be used in order to limit possibilities
of spreading the incident to other systems.
Formal methods can be used for quick
verification if the network security design is correct
in respect of its incident handling readiness. For
example, using the graph’s path matrix from (2)
model, all the resources reachable from the specific
attack source can be found. Then using (1) model,
the network protections (e.g. firewalls) located in the
path between the attack source and endangered IT
system’s resources, can quickly be identified.
5 CONCLUSIONS
The models and methods described in this paper
allow for quick identification of network security
design errors resulted from violation of
“Compartmentalization of Information” (i.e.
correctness of network security zones) and
„Defense-in-Depth” (i.e. tightness of firewall and
IPS protections layers) security principles as well as
checking if network protections allow for proper
incident handling. Also other principles (e.g. "The
Principle of Least Privilege", "Defense Through
Diversification") and network protections (e.g. VPN,
anti-virus) analysis can be supported with formal
methods.
An inspiration for the development of the methods
was real problems that were experienced by the
author in the security audits. Formal methods can
speed up and improve the accuracy of network
security design analysis of complex IT systems.
Mathematical description allows for simple
implementation of the methods in the form of
computer programs as well as using for analysis the
available mathematical tools.
The effectiveness of the formal analysis methods
was in some part practically evaluated by the author
during security audits. Network security model (1)
can be easily constructed and graph’s shortest paths
found using available graph tools (e.g. David
Symonds’ GraphThing). Computer-aided analysis
process is faster and more accurate then the analysis
done in conventional way (i.e. network scheme
review and safeguards verification). For example,
the experienced security engineer needed about 8
hours to perform the analysis of e-banking system’s
network access control protections compliance with
the „Defense-in-Depth” principle. Using the formal
method (9) and GraphThing application, the same
task was performed in about 20 minutes. Practical
usage of all presented methods would require
implementation for this purpose the dedicated tools.
ACKNOWLEDGEMENTS
This work is the part of the author's doctoral
dissertation. The author thanks professor Ryszard
Antkiewicz of Military University of Technology in
Warsaw for useful discussions and support.
REFERENCES
DISA, 2003. Infrastructure Security Technical
Implementation Guide, US Defense Information
Systems Agency.
FCC, 2001. Computer Security Incident Response Guide,
US Federal Communications Commission.
Noel, S., Jacobs, M., Kalapa, P., Jajodia, S., Multiple
Coordinated Views for Network Attack Graphs, 2005.
In Proceedings of the Workshop on Visualization for
Computer Security. Minneapolis, Minnesota.
NSA, 2000. Defense in Depth - A practical strategy for
achieving Information Assurance in today’s highly
networked environments, NSA.
Phillips, C., Swiler, L., 1998. A Graph-Based Network-
Vulnerability Analysis System. In Proceedings of the
New Security Paradigms Workshop. Charlottesville,
VA.
Stang, T.H., Pourbayat, F., 2003. Measuring privacy using
network topology, Oslo University College.
Stawowski, M., 2006. The Principles and Good Practices
for Intrusion Prevention systems Design, CLICO.
Stoneburner, G., Hayden, C., Feringa, A., 2004.
Engineering Principles for Information Technology
Security, NIST.
Straub, K.R., 2003. Information Security Managing Risk
with Defense in Depth, SANS Institute.
Zimmerman, S.C., 2001. Secure Infrastructure Design,
CERT Coordination Center.
SECRYPT 2007 - International Conference on Security and Cryptography
318
