
IMPLEMENTATION AND ANALYSIS OF A HANDWRITTEN
SIGNATURE VERIFICATION TECHNIQUE
Alan McCabe
Fern Computer Services, Pty Ltd.
Belfast, Ireland
Jarrod Trevathan
School of Maths, Physics and Information Technology
James Cook University
Keywords:
Biometric security, authentication, dynamic features, string comparison, extrema avoidence.
Abstract:
There is considerable interest in authentication based on handwritten signature verification because it is su-
perior to many other biometric authentication techniques such as finger prints or retinal patterns, which are
reliable but much more intrusive. The paper details a number of experiments using a signature verfication
technique which is unlike any other reported in literature. Specifically, characters are used to represent various
features of a signature image allowing the use of existing and proven string distance metrics to determine
distances between signatures. Extensive testing shows that our proposed system is comparable with, and in
many aspects better than the highest quality signature verfication techniques presented in literature.
1 INTRODUCTION
Biometric security systems such as finger prints and
retinal scanning are increasingly being used as a
means of authenticating an individual’s identity. De-
spite the reliability of these systems, they are some-
what intrusive and are often met with resistance by
those being authenticated. A more natural and ac-
ceptable authentication method is to verify an indi-
vidual’s handwritten signature. This involves captur-
ing the signature via a graphics tablet and compar-
ing this with a reference file. The process involved
is essentially the same as a credit card transaction,
however, the procedure is automated and the ultimate
verification decision is made by a computer program
rather than relying on human judgment. (See (Mc-
Cabe, 2000; Trevathan and McCabe, 2005).)
This paper presents a Handwritten Signature Veri-
fication (HSV) system which extends an approach de-
scribed by (Gupta and Joyce, 1997a). Their approach
involves abstracting the signature data into a character
string representing the more discriminating signature
features. This approach’s difficulty lies in determin-
ing the type of features to capture, how to extract them
from the signature data, and how to incorporate the
extracted features into the character string.
This paper aims to improve the performance of the
techniques developed by (Gupta and Joyce, 1997a)
by combining shape and dynamics of the signature
in a number of different ways using a single-stage ap-
proach. The proposed HSV system’s goals include:
1. Uses no more than five reference signatures.
2. Does not have unrealistic resource requirements.
3. Thoroughly tested.
4. Can store reference signature information on a
credit card or a smart card.
This paper is organised as follows: Section 2 pro-
vides background relating to the approach used by our
HSV system. Section 3 presents the methodology be-
hind the proposed HSV system, along with a descrip-
tion of various novel approaches taken to deal with
problems encountered. It also evaluates the HSV sys-
tem’s performance and its limitations. Section 4 pro-
vides some concluding remarks.
2 BACKGROUND
This section describes specific approaches towards
solving the HSV problem and the motivation for our
proposed HSV system.
HSV involves the following five phases: data ac-
quisition, preprocessing, feature extraction, compari-
son process, and performance evaluation. During the
48
McCabe A. and Trevathan J. (2007).
IMPLEMENTATION AND ANALYSIS OF A HANDWRITTEN SIGNATURE VERIFICATION TECHNIQUE.
In Proceedings of the Second International Conference on Security and Cryptography, pages 48-58
DOI: 10.5220/0002121500480058
Copyright
c
SciTePress

first three phases most methods would generate a ref-
erence signature (or a set of reference signatures) for
each individual. This requires a number of user sig-
natures to be captured at enrollment/registration time
and processed. In the discussion that follows, it is
assumed that there is only one reference signature.
When a user claims to be a particular individual, they
present a test signature, which is compared with the
reference signature for that individual. The differ-
ence between the two is then computed using a dis-
tance measure. If the distance is above a predefined
threshold value, then the test signature is rejected as a
forgery, otherwise it is authenticated.
The following notion for performance evaluation
is used throughout this paper:
• r: the threshold value. (The threshold is r times
the standard deviations plus the reference mean.)
• F-accept: number of forgeries accepted as gen-
uine.
• G-reject: number of genuine signatures rejected
as forgeries.
• FAR: false acceptance rate expressed as a percent-
age.
• FRR: false rejection rate expressed as a percent-
age.
• ER: total error rate (FAR + FRR).
Performance evaluation of the proposed technique
is very important and normally researchers use a set
of genuine signatures and forgery attempts collected
by them (or by someone else), and determine the
FRR and FAR for the technique given the signature
database. Obtaining good FAR estimates is very dif-
ficult since real-world successful forgeries are impos-
sible to obtain. Performance evaluations rely on two
types of forged signatures. A forgery may be skilled,
if it is produced by a person other than the individ-
ual whose signature is being forged when the forger
has had access to one or more genuine signatures for
viewing and/or practice. A forgery is called zero effort
or random when either another person’s genuine sig-
nature is used as a forgery, or the forger has no access
to the genuine signature and is either only given the
name of the person whose signature is to be forged, or
just asked to sign any signature without even knowing
the name. Tests on random forgeries generally lead to
a much smaller FAR than on skilled forgeries.
There are quite a large number of other systems
which deal with HSV. However, almost all of them
exhibit several shortcomings. This work’s main prior-
ity is to avoid these shortcomings and produce a sys-
tem which not only performs well, but is suitable for
real world applications. Four such pitfalls include:
Use of Too Many Reference Signatures – there is
a direct correlation between the number of reference
signatures and the quality of the reference created us-
ing those signatures. It is very important not to as-
sume the existence of too many reference signatures,
as it may not always be possible to obtain them.
Failure to Combine Static and Dynamic Features
– a signature is made up of features which are both
static (i.e., shape related such as the length of long
strokes) and dynamic (i.e., motion related such as the
velocity and pin tip acceleration at various stages).
Unrealistic Resource Requirements – although per-
forming huge amounts of preprocessing and calcula-
tions may result in high levels of reliability, it is im-
portant that the signature verifier is fast. It is not ac-
ceptable for a system user to have to wait a few min-
utes every time they desire to verify a signature.
Insufficient Testing – although most authors report
error rates in the form of both FAR and FRR, the level
of testing style varies greatly throughout literature,
making comparisons between different systems diffi-
cult. A realistic testing level must involve a high num-
ber of tests for false rejection (genuine signatures be-
ing rejected as forgeries) and false acceptance (forg-
eries, which should be high in both quality and num-
ber, being accepted as genuine signatures). In addi-
tion, it is not realistic to remove signatures from test-
ing simply on the basis that they do not work well
with the desired system, nor is it realistic to non-
randomly choose signatures to be used as a reference,
testing or otherwise. Finally, only one attempt should
be allowed for a user signature to be verified – many
systems allow a user three attempts to verify a signa-
ture and this is generally not acceptable.
There are three main categories which HSV sys-
tems can fall into: point-to-point comparison, feature
values comparison, and capturing signature shape.
Point-to-Point Comparison compares a test signa-
ture with a reference signature by comparing different
parts of the signature separately and combining these
comparisons to achieve an overall similarity measure.
A number of investigations suggest that point-to-point
techniques can lead to good results but the techniques
suffer from difficulties due to variations in the gen-
uine signatures of each individual. In order to make
more effective comparisons, a system must perform
some type of alignment of the test and reference sig-
natures in an attempt to “line-up” the corresponding
parts of the signatures. This alignment may in turn
create problems of its own, since forgeries will un-
dergo alignment as well as genuine signatures.
IMPLEMENTATION AND ANALYSIS OF A HANDWRITTEN SIGNATURE VERIFICATION TECHNIQUE
49

Figure 1: The valley/peak characters associated with the let-
ter ‘S’.
It appears that highly reliable HSV systems are
unlikely to be based on such techniques. Some low
error rates have been reported, but the testing proce-
dure performed on these systems were quite inade-
quate. The best results so far for well tested systems
seem to give total error rates of just over 15%. Also,
the systems have not been tested for zero-effort FAR.
Feature Values Comparison is relevant to this pa-
per, because many features are captured implicitly in
the representation. For example, the number of turn-
ing points, the pen-up time and the total time taken
to sign. There are two important issues within this
type of approach. Firstly, it is necessary to decide on
the number and type of features to capture, and sec-
ondly it is important to choose an appropriate means
of comparing those feature values.
Most HSV techniques are based on statistical fea-
tures capturing mainly dynamic details of the signa-
ture. The feature-based techniques work remarkably
well without having to store the entire signature, but
there is a limit to the performance level which can
be obtained. Most HSV proposals have error rates of
more than 10% and 15%. These systems have not
been tested for a zero-effort FAR.
Capturing Signature Shape - Most static HSV is
based on capturing the shape or some aspects of the
signature’s shape. Dynamic HSV involves capturing
details relating to signature dynamics (e.g., pen tip ve-
locity, acceleration, etc.). This category essentially is
a combination of static and dynamic HSV in that it
uses dynamic information and signature shape.
The (Gupta and Joyce, 1997a) technique assumes
that the signature is captured using a device capable
of obtaining the (x,y) coordinate pairs several times
per second (usually of the order of 200 samples per
second). The x and y data is then extracted into sepa-
rate vectors (known as profiles). The verification tech-
nique can be explained using the following symbols:
A for a peak of the x profile B for a valley of the x profile
C for a peak of the y profile D for a valley of the y profile
A signature may now be processed to identify all
the peaks/valleys in the x and y profiles, and each of
the profiles may then be represented by a string of
symbols representing the peaks/valleys. The x pro-
file was then represented by a string ABABABAB...
and the y-valley profile by a string like CDCDCD-
CDC... with each peak and valley in the two profiles
having a time associated with it (which was not dis-
played in this simple representation). The peak and
valley times may then be used to interleave the x and y
profile representations so that the signature shape was
represented by a string like DACBADBC. This simple
example indicates that the signature’s x and y profiles
together had only nine peaks and valleys (typically
there might be 50 or more) that were x-peak followed
by y-peak, then an x-valley, etc. Another way to look
at this representation was to view it as a description
of the pen motion, i.e., from the initial position (x-
peak) the pen first moved northwest to reach a y-peak
then southwest to reach an x-valley and then turned
around and moved southeast to reach an x-peak and
y-valley and so on. DACBADBC therefore represents
a pen motion something similar to the letter S writ-
ten from the top to bottom (see Figure 1). The rep-
resentation would be reversed if the letter S was writ-
ten from the bottom to the top. The representation
does not capture the curvature or the size of the curves
that make the letter S and therefore DACBADBC was
a representation for many curves that look somewhat
similar and thus the representation provides consider-
able flexibility and tolerates considerable variation in
the way the pen moves. The representation captures
the shape and the direction of pen movement during
signature writing. Given the flexible representation,
similar representation should always be obtained for
a person’s signatures in spite of minor variations in
the genuine signatures.
A small number of systems have been built us-
ing techniques for capturing signature shape in a way
that is quite different than the approach used in the
point-to-point comparisons. Most shape systems suf-
fer from poor performance when skilled forgeries are
tested, since skilled forgers are often able to repro-
duce the shape of the signature quite well. Simple
techniques which capture shape and then compare it
therefore are unlikely to produce high performance
for skilled forgeries. This is in contrast to the per-
formance of the dynamic feature-based techniques
which perform very well when skilled forgeries are
tested, since the dynamics of skilled forgeries are of-
ten very different than that of the genuine signatures.
3 IMPLEMENTATION
This section discusses the basic methodology, design,
implementation and performance evaluation of our
HSV system.
SECRYPT 2007 - International Conference on Security and Cryptography
50

The major HSV software components are as follows:
1. Input component: responsible for reading in the
signature data from signature files to the program.
2. Preprocessor: detects the genuine valleys/peaks
in the signature data read in during input and in-
dexes them according to their position in the sig-
nature.
3. String generator: takes the ordered set of valleys
and peaks as well as their positions and produces
a character string representing the signature data.
4. String comparison: uses the character strings to
compare two signatures and determines whether a
signature is to be accepted or rejected.
5. Report generator: collates the accepted/rejected
signatures and obtains error rates for false accep-
tance and false rejection. A detailed report for
each individual in the database, as well as for the
database as a whole is then written to an output
file.
The performance evaluation of our proposed HSV
system uses the same database employed by (Gupta
and Joyce, 1997b). The database contains a total of
1229 signatures taken from 59 users. There are 904
genuine signatures, each user providing usually 15
genuine signatures. There are also 325 highly skilled
forgeries, about five for each user. Further details of
the database can be found in (Nelson et al, 1994). In
most experiments five signatures were used for each
reference leaving 904 - (5× 59) = 609 genuine signa-
tures for computing FRRs.
Experimental Protocol
An experimental protocol similar to that described
in (Gupta and Joyce, 1997b) was used. The protocol
remained constant throughout the experimentation.
To create a reference signature, the first five sig-
natures for each user were taken from the database
and transformed into strings using the technique be-
ing evaluated. The five strings were then compared
with each other using a string distance algorithm and
the ten distances were obtained. The reference mean
and the reference standard deviation of the distances
were computed. These five signatures, for each user,
are not used again as test signatures.
The remaining genuine/forged signatures for that
user are tested against the five reference signatures.
This is done by determining the distance between the
test signature string and each of the reference strings,
and finding the minimum of these distances. If this
minimum distance (known as the test distance) is
smaller than the threshold distance, the test signature
is accepted, otherwise it is rejected.
Various values of threshold were used in perfor-
mance evaluation; the threshold being the sum of the
reference mean and r times the reference standard de-
viation. The value of r depends on the type of applica-
tion that the HSV system is to be used for. If security
(low FAR) is the major concern, then a small value for
r will be used. Alternately, if a low FRR is the major
concern, then a larger threshold is used.
Comparing Two Strings
The importance of selecting and implementing
an appropriate algorithm for finding the distance be-
tween the two strings should not be underestimated,
since performance relies on the string distance al-
gorithm to determine accurately the distance be-
tween signatures’ string representations. The Wagner-
Fischer (WF) string distance algorithm (Wagner and
Fischer, 1974) best suited our purpose.
The WF dynamic-programming method is based
upon successively evaluating the distance between
longer and longer prefixes of the two strings until the
final result is obtained. The partial results are com-
puted iteratively and are entered into an (m + 1) ×
(n + 1) array (where m and n are the lengths of the
two strings being compared), leading to O(mn) time
and space complexities.
The algorithm involves calculating the cost of
transforming one string into another in an iterative
fashion. For example, the cost of transforming one
string into an empty string to another empty string
is obviously zero, the cost of transforming from one
empty string with a single character is one. More gen-
erally, if the cost of transforming x(1, i) into y(1, j −
1) is known, then the cost of transforming x(1,i) into
y(1, j) may be obtained by adding the cost of insert-
ing y
j
. Similarly, if the cost of transforming x(1,i− 1)
into y(1, j − 1) is known, then the cost of transform-
ing x(1, i) into y(1, j) may be obtained by adding the
cost of replacing x
i
with y
j
. The primary advantage
of the WF algorithm for use in this application is that
the string AB can be transformed into the string BA at
a cost of only one. It is possible to use the iterative
nature of this algorithm to create a matrix where the
elements contain the cost of transforming from one
substring to another.
For example, suppose there are two character
strings ABCDA and BADCA, then the WF matrix
looks like:
A B C D A
0 1 2 3 4 5
B 1 1 1 2 3 4
A 2 1 2 2 3 3
D 3 2 2 3 2 3
C 4 3 3 2 3 3
A 5 4 4 3 3 3
IMPLEMENTATION AND ANALYSIS OF A HANDWRITTEN SIGNATURE VERIFICATION TECHNIQUE
51
The overall distance between the two strings
ABCDA and BADCA is 3.
Valley and Peak Detection Algorithm
A simple valley and peak detection algorithm
would involve detecting a valley (and similarly
a peak), if there was a ‘down’ motion, followed
possibly by some number of ‘flats’ (possibly zero),
followed by an ‘up’ motion. For example, suppose
the following data existed in the y direction:
...,102,101,101,101,102,104,105,...
at times ...,t,t + 1,t +2,t + 3,t +4,t +5,t + 6, ...
The data represents a valley at 101 at times t + 1
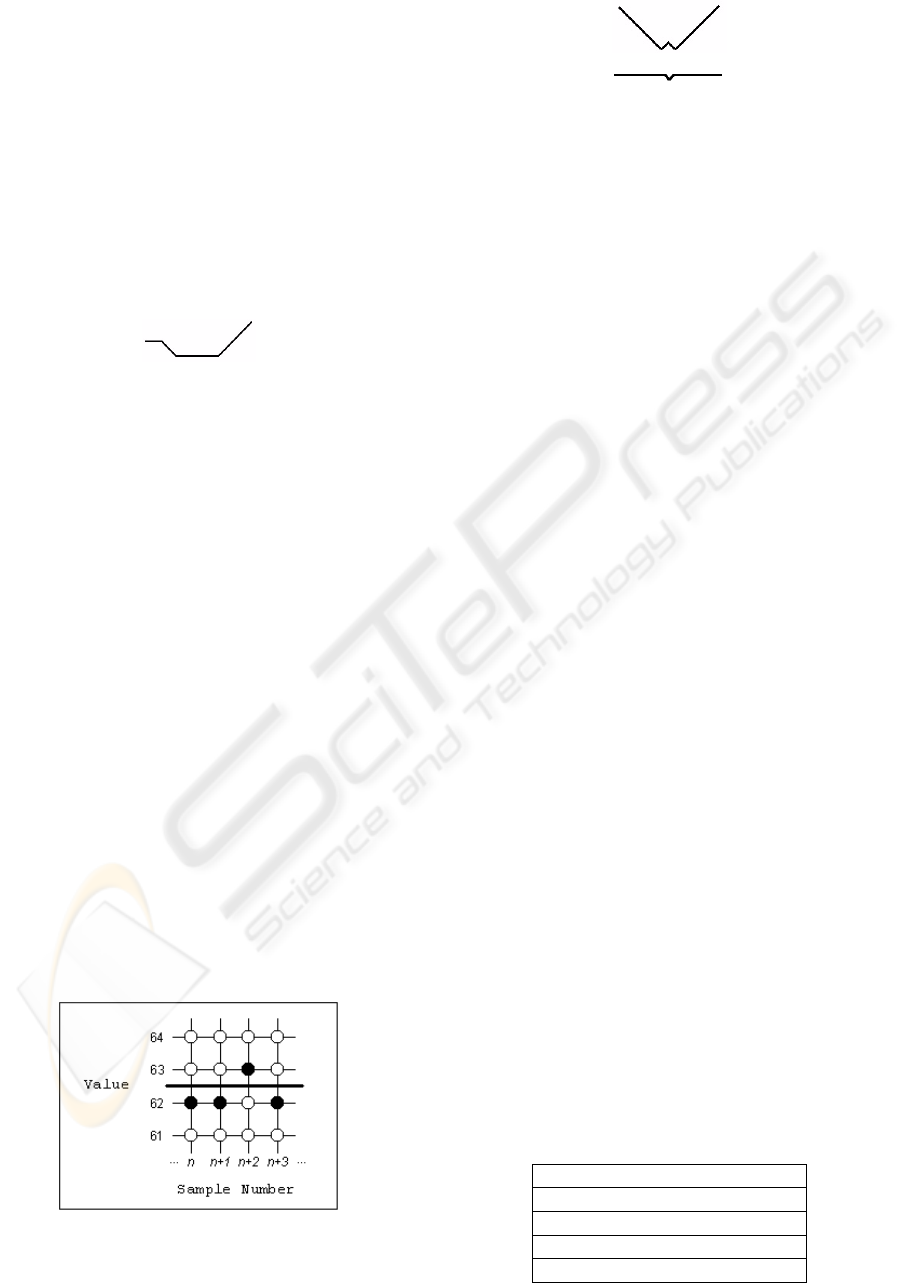
(or t + 2 or t + 3). However, problems occur when
the graphics tablet used produces a set of values like
...,102,101,102,101,102,... which appear due to the
hardware used and due to “false” pixels. False pixels
occur when the line representing the pen’s tip goes
through the middle of the Cartesian grid represent-
ing the pixels of the signature capturing hardware (see
Figure 2). If the written line goes exactly in between
two pixels, then it is possible that the device will read
the position as being sometimes on the left pixel and
sometimes on the right. The pixel chosen by the de-
vice may be influenced by the way the signer is hold-
ing the pen, the pen’s tilt or the pressure being applied
by the user. So the data (say in the y direction) may
look something like this:
...,104,102,101,100,101,100,101,102,104,...
Using the simple valley and peak detection algo-
rithm, the above data returns a valley, followed by a
peak, followed by another valley. Does this data have
three turning points or does it have only a single val-
ley? Now suppose the data looked like this:
...,100,100,100,99,100,100,100,...
The simplest approach to removing the false turn-
Figure 2: Example of how false turning points can occur
using naive valley/peak detection algorithms.
ing points involved removing valleys and peaks which
had a depth or height less than some threshold. The
valley depth (and similarly a peak) was measured in
pixels and was calculated as the difference between
the height of the valley and the height of the smallest
of the immediately neighbouring peaks. Four experi-
ments were conducted using this method for removal
of valleys and peaks, which made use of the qual-
ity control technique. Valleys (and similarly peaks)
were removed if a valley’s depth was below a cer-
tain threshold value (measured in pixels). The four
different experiments used four different thresholds –
none, two, three and four. The optimal overall error
rate as well as the breakdown into FAR and FRR are
presented for each of these thresholds in Table 1. As
can be seen from this table, simple removal of small
valleys and peaks clearly has a detrimental effect on
verification accuracy. The only conclusion that can be
drawn then is that valleys and peaks which have only
a very small depth or height are important character-
istics of the signing style.
Even though small valleys and peaks hold impor-
tant detail relating to the signature’s characteristic,
something still needs to be done to remove “false”
turning points. To do this, a different approach was
adopted in which, put simply, at least two “down”
events had to be followed by two “up” events for a val-
ley to be detected. This was slightly different in that
instead of considering the size of the valleys/peaks,
the relative positions of the pen are being considered.
That is, if the pen tip moves in a downward direc-
tion on two samples (without being interrupted by an
“up”), then this is thought to be the start of a gen-
uine valley. If the pen tip then moves back up for two
samples (without being interrupted by a “down”), the
genuine valley is completed and a valley is stored.
See (McCabe and Trevathan, 2007) for a complete
discussion of valley and peak detection algorithms de-
veloped in conjunction with this research.
Performance of the Gupta and Joyce System
Table 1: How removal of small valleys and peaks effects
error rate.
Threshold FAR FRR Overall
None 4.0% 3.1% 7.1%
2 8.3% 9.4% 17.7%
3 9.2% 10.3% 19.6%
4 10.2% 9.2% 19.3%
SECRYPT 2007 - International Conference on Security and Cryptography
52

Table 2: Initial results using the characters A, B, C, D, F.
r F-accept G-reject FAR FRR ER
0.0 45/325 86/609 13.8% 14.1% 27.9%
0.5 69/325 41/609 21.2% 6.7% 27.9%
1.0 107/325 22/609 32.9% 3.6% 36.5%
1.5 154/325 12/609 47.4% 2.0% 49.4%
2.0 188/325 6/609 57.8% 1.0% 58.8%
The (Gupta and Joyce, 1997a) technique was im-
plemented following the experimental procedure de-
scribed in their paper and the results presented in Ta-
ble 2 were obtained. The 27.9% overall error rate was
high because the technique was not capturing enough
detail to discriminate well between signatures (only
the ordering of turning points and the position and du-
ration of pen-ups were captured). Table 2 shows that
the FAR was the major problem, as it was too easy
for a forger to produce the correct ordering of turning
points, even though the actual signature may not be a
very accurate forgery.
Utilising Distance and Direction Characters
Capturing the optimal level of signature detail is
important to the overall success of the signature verifi-
cation. Capturing too much detail leads to a high FRR
since each genuine signature needs to be very similar
to the reference signature(s), while capturing too lit-
tle detail leads to a high FAR because it is easy for the
forgeries to meet the minimal requirements. Table 1
shows that the FAR is high even for low threshold
values. This suggests that the technique is capturing
the shape well since most skilled forgeries reproduce
the signature shape well. Furthermore, the technique
is not capturing enough details other than the shape
which could have reduced the skilled forgeries’ FAR.
Thus a modification of the technique that capture fur-
ther signature details should improve performance.
Previously, only the ordering of the valleys and
peaks in a signature were being captured and this ap-
proach allowed the skilled forgers to get the string
representation similar to the genuine signatures, even
though the forged signature was not an exception-
ally good forgery. It was therefore decided to include
more detail about the signature shape by including in-
formation about the stroke distances in the representa-
tion, which forces a forger (and genuine signer) to get
not only the ordering of the valleys and peaks correct,
but also the spacing between them. Additionally, the
location and duration of “pen-up” occurrences were
added to the signature representation.
How would the stroke distance between the turn-
ing point characters be represented? The distance it-
self may be computed in two different ways. It may be
computed by finding the distance between the coordi-
Table 3: Error rates using the characters A, B, C, D, P, I,
J, K, L... and using the time interval as the distance metric
(distance intervals based on global characteristics).
r F-accept G-reject FAR FRR ER
0.0 48/325 134/609 14.8% 22.0% 36.8%
0.5 55/325 109/609 16.9% 17.9% 34.8%
1.0 60/325 95/609 18.5% 15.6% 34.1%
1.5 71/325 67/609 21.8% 11.0% 32.8%
2.0 77/325 52/609 23.7% 8.5% 32.2%
Table 4: Error rates using the characters A, B, C, D, P, I,
J, K, L... and using the path length as the distance metric
(based on global characteristics).
r F-accept G-reject FAR FRR ER
0.0 51/325 135/609 15.7% 22.2% 37.9%
0.5 57/325 110/609 17.5% 18.1% 35.6%
1.0 60/325 96/609 18.5% 15.8% 34.3%
1.5 74/325 69/609 22.8% 11.3% 34.1%
2.0 81/325 55/609 24.9% 9.0% 33.9%
nates of the two successive valleys/peaks. It may also
be found distance in terms of the number of samples
between successive valleys/peaks. Effectively then,
the second alternative is determining the time lapsed
between the turning point characters. A vector repre-
senting all of the distance values between the turning
points of the signature image may then be obtained.
Using this approach, whatever distance technique
is used, it is necessary to compute distance between
vectors that are often of different sizes which is a dif-
ficult problem. One approach for comparing two vec-
tors was to simply drop the smallest integers from the
larger vector until the two lengths are the same. For
example, suppose the following two vectors represent
the distances between the turning point characters in
two instances of a signature:
1 18 6 28 31 2 16
16 4 32 29 16
If the smallest numbers from the longer vector are re-
moved, the result is:
18 6 28 31 16
16 4 32 29 16
This idea has some merit, but difficulties can arise if
the process leads to poor alignment of the vectors,
therefore the approach was not investigated further.
Instead, it was decided to map the integers to charac-
ters and include the distance information in the string
representation itself.
To map the integers to characters, it was decided
to first divide the distances into four classes. If the dis-
tance fell in the smallest quarter of the distances, the
character I was inserted into the string, next higher
quarter distance were represented by a J, and simi-
IMPLEMENTATION AND ANALYSIS OF A HANDWRITTEN SIGNATURE VERIFICATION TECHNIQUE
53

Table 5: Error rates using the characters A, B, C, D, P, I,
J, K, L... and using the time interval as the distance metric
(distance classes set automatically).
r F-accept G-reject FAR FRR ER
0.0 23/325 100/609 7.1% 16.4% 23.5%
0.5 33/325 59/609 10.2% 9.7% 19.8%
1.0 46/325 35/609 14.2% 5.7% 19.9%
1.5 64/325 26/609 19.7% 4.3% 24.0%
2.0 79/325 13/609 24.3% 2.1% 26.4%
larly the next higher distances were represented by K
and L. A pen-up character P was also included in the
string whenever the pen tip was not in contact with
the writing tablet. Pen-up time was divided into small
and large, where small pen-ups were represented by
a single P and large pen-ups represented as PP. The
limits for each of the four distance classes were mutu-
ally calculated using the distance values for all users
in the database. These limits were found by building
a frequency vector for the distance values, and then
dividing the distance values into four equal groups
based on their magnitude, and assigning a symbol to
each group. The limits for the distance classes were
then used globally on the signature database to ex-
plore this approach’s merit. The initial limits for the
four classes for time and path length distances, and
for pen-up occurrences were:
Time: 0 − 7; 8− 15; 16− 24; > 24
Path Length: 0− 25; 26− 60; 61− 120; > 120
Pen-Up: < 8; > 8
String representations of signatures were gener-
ated using the distance characters and the turning
point characters. Performance evaluation of the tech-
nique using the time interval and the path length as
the distance metric resulted in overall error rates of
32.2% and 33.9% respectively (see Table 3 and Ta-
ble 4).
The above classes used in developing representa-
tions for the distance and the pen-up time were based
on heuristics. Since the distances and the pen-up
times tend to be quite different for different individu-
als, it was decided to select the classes based on typi-
cal distance values for each individual. To do this, five
reference signatures for each individual were used,
and all of the distance values in between turning point
characters were obtained. These distance values were
divided into four equal groups according to their mag-
nitude and each group assigned a symbol. The small
and large pen-up time intervals were also found in
a similar fashion by dividing the pen-up time sizes
into two equal groups according to magnitude. The
performance was evaluated using the individualised
intervals. The results obtained were an 19.8% over-
Table 6: Error rates using the characters A, B, C, D, P, I,
J, K, L... and using the path length as the distance metric
(distance classes set automatically).
r F-accept G-reject FAR FRR ER
0.0 25/325 102/609 7.7% 16.7% 24.4%
0.5 36/325 58/609 11.1% 9.5% 20.6%
1.0 48/325 37/609 14.8% 6.1% 20.9%
1.5 66/325 27/609 20.3% 4.4% 24.7%
2.0 81/325 13/609 24.9% 2.1% 27.0%
all error rate using the time interval as the distance
metric and 20.6% using the path length. Table 5 and
Table 6 show that the best results are obtained when
the threshold value is 0.5. Although these results are
much better than those in Table 3, the FAR is still
high. From the results presented thus far, the time in-
terval seems to be the superior distance metric of the
two. Therefore we only concentrate on the time inter-
val as the distance metric from this point on.
The results show that the FAR was still dominat-
ing the overall error rate indicating that shape was still
the determining factor in the technique, since includ-
ing the distance only improved the shape representa-
tion, but did not include any motion or dynamic in-
formation. One type of information that can be easily
derived is the direction of pen motion at each moment.
It was decided to incorporate details of the direction
of the pen tip in between the valley and peak charac-
ters. To include pen tip direction, the motion direc-
tion was classified into four classes, corresponding to
quadrants on a Cartesian grid. The character to in-
clude between the turning points α, and the turning
point β, can then be found by positioning α at the ori-
gin and determining which quadrant β lies in.
Both the direction and the distance were included
in the signature representation by using one symbol
to represent both. To do this, for example, quadrant
one and distance class one is represented by the char-
acter E, quadrant two and the distance class one is the
character F and so on, until there was a unique charac-
ter for each of the sixteen direction/distance combina-
tions. Table 7 presents the results of evaluating these
two techniques. The results are much better with the
minimum total error at 9.2%.
An extension of the distance/direction approach
involved attaching more weight to longer strokes.
This was done by inserting not only the character ap-
propriate for each stroke, but also the distance char-
acteristic is considered, and the four distance classes
(in order) are represented by the characters W, X, Y
and Z. If the distance between two valleys/peaks falls
into the second largest class Y, then the three char-
acters WXY would be inserted in between the val-
ley/peak characters. This approach was considered
SECRYPT 2007 - International Conference on Security and Cryptography
54

Table 7: Error rates using the characters A, B, C, D, P, E, F,
G, H (direction components used).
r F-accept G-reject FAR FRR ER
0.0 3/325 98/609 0.9% 16.1% 17.0%
0.5 12/325 43/609 3.7% 7.1% 10.8%
1.0 25/325 26/609 7.7% 4.3% 12.0%
1.5 45/325 19/609 13.8% 3.1% 17.0%
2.0 60/325 9/609 18.5% 1.5% 19.9%
2.5 82/325 5/609 25.2% 0.8% 26.1%
3.0 96/325 4/609 29.5% 0.7% 30.2%
Table 8: Error rates using the characters A, B, C, D, P, I, F,
G, H, I, J, K, L (captures ordering, distance and direction).
r F-accept G-reject FAR FRR ER
0.0 1/325 97/609 0.3% 15.9% 16.2%
0.5 6/325 45/609 1.8% 7.4% 9.2%
1.0 15/325 29/609 4.6% 4.8% 9.4%
1.5 30/325 19/609 9.2% 3.1% 12.3%
2.0 47/325 11/609 14.5% 1.8% 16.3%
2.5 68/325 6/609 20.9% 1.0% 21.9%
3.0 76/325 4/609 23.4% 0.7% 24.1%
to have some advantage as (Dimauro et al, 1994)
note that longer strokes are generally more difficult to
forge. Accumulating the characters allows a level of
variability for a genuine signer who only gets a long
stroke slightly wrong. For example, suppose a ref-
erence signature contains the sequence WXYZ. In this
situation, if the user formed the long stroke such that it
was slightly shorter, the test signature would contain
the sequence WXY, so the mismatch would be quite
small. Table 8 presents the results for the cumulative
technique giving a best-case 9.2% overall error rate.
Representing Stroke Length
The approaches implemented thus far had in-
volved increasing the level of detail which is captured
by the signature representation. Table 8 shows that in-
cluding more detail in the signature representation has
improved the overall error rate significantly by lower-
ing the FAR, but the FRR has increased as expected.
Table 9: Error rates obtained using the ‘cumulative’ tech-
nique.
r F-accept G-reject FAR FRR ER
0.0 1/325 96/609 0.3% 15.8% 16.1%
0.5 9/325 46/609 2.8% 7.5% 10.3%
1.0 15/325 30/609 4.6% 4.9% 9.5%
1.5 33/325 19/609 10.1% 3.1% 13.2%
2.0 46/325 12/609 14.2% 1.9% 16.1%
2.5 64/325 7/609 19.7% 1.1% 20.8%
3.0 77/325 4/609 23.4% 0.7% 24.1%
To improve the error rates further, it is necessary to
study the representation and improve it if possible. It
should be noted that including the direction informa-
tion in the signature representation is not necessary
since the direction of pen motion is implied by the
peak-valley representation. For example, if a x-peak
is followed by a y-valley, then the direction of pen
motion between the two must be southwest.
Therefore it was decided to refine the signature
representation yet again. Two changes were intro-
duced, firstly the direction information was removed
since the direction is implicit in the peak-valley repre-
sentation as noted above. Also, the representation of
the distance between each successive turning points
was changed. Using single characters to represent
different distance magnitudes was perhaps leading to
problems since the signatures of each individual have
variations, and if the two corresponding stroke dis-
tances were somewhat different they could well be
represented by different symbols leading to a mis-
match when the signature representations are com-
pared. Therefore a new representation was developed
which retains the valley and peak characters, but in-
stead of using a single character to represent each dis-
tance (or direction or both), multiple identical char-
acters are used to represent it. The number of char-
acters used is proportional to the magnitude of the
distance. The strength of this representation is that
if two corresponding stroke distances are somewhat
different in two signatures, the corresponding repre-
sentation would not be very different, it might only
differ by a single character in a string of characters
that represent those two corresponding distances. Let
the distance be represented by a number of T char-
acters in between the turning point characters. Using
multiple characters also captures pen tip velocity to an
extent, as the number of T characters in between the
segment will be less if the pen is being moved quickly.
It is possible to insert a T character for each signa-
ture sample point, but this can result in strings well
over one thousand characters in length. This not
only results in string matching requiring significant
resources, but leads to an ineffective signature repre-
sentation since the representation mostly consists of
the T characters, and the fifty or sixty turning point
characters do not have a significant influence on the
results of signature comparisons. It is essential that
the number of T characters included to represent the
stroke distances is not much more than the number of
turning point characters. One approach is to insert a T
character for every n signature sample points (or time
units) where n perhaps has a range of 100 to 300).
The characters which are now included are the four
turning point characters A, B, C, D, the pen-up char-
IMPLEMENTATION AND ANALYSIS OF A HANDWRITTEN SIGNATURE VERIFICATION TECHNIQUE
55

Table 10: Error rates using the characters A, B, C, D, P, T.
r F-accept G-reject FAR FRR ER
0.0 0/325 117/609 0.0% 19.2% 19.2%
1.0 9/325 40/609 2.7% 6.5% 9.2%
2.0 17/325 19/609 5.2% 3.1% 8.3%
3.0 24/325 13/609 7.4% 2.1% 9.5%
4.0 36/325 7/609 11.0% 1.2% 13.2%
acter P, and a new character T representing the time
spacing between the turning point characters.
The signature representation now essentially rep-
resents a signature as a description similar to the fol-
lowing: “The pen moved northwest for 100 ms then
southwest for 150 ms then southeast for 75 ms... etc.”
This appears to be a flexible representation which still
captures a significant level of detail.
The results in this section were obtained by insert-
ing a T character for every n time units. This places
a large emphasis on correct spacing of turning points,
but at the same time the direction information is rep-
resented in the ordering of the turning points them-
selves. The representation also captures pen tip ve-
locity to an extent, as the number of T characters in
between a segment will be less if the pen is being
moved quickly. Six sets of results were obtained cor-
responding to different values of n ranging from n= 2
to n = 8. However, only the results which were most
attractive (those which used an n value of four) are
presented (Table 10). The total error rate is now 8.3%
(at a threshold of 2.0) compared to 9.2% in Table 8.
Controlling Reference Signature Quality
A HSV system’s reliability depends on the quality
of the reference signatures. It is assumed that these
signatures provide an accurate indication of how a
person’s signatures vary. A HSV system is going to
have difficulties if the sample signatures are very sim-
ilar, i.e., they show less variation than the person’s
signatures actually do. The system will suffer from a
high FRR but will have a low FAR. Also, if the sam-
ple signatures show more variation than is normal for
the person, then the system will lead to higher FAR
but lower FRR. If possible, a HSV system should try
to protect itself from such problems.
Heuristics have been developed to check the ref-
erence signature quality, and to determine if the level
of variability in the reference signatures is unusually
high or low, and correcting it if it is. The variability
of the reference signatures can be judged by the ratio
of the standard deviation to the mean of the distances
between reference signatures. If this ratio is too small,
then the reference signatures are unusually similar. If
the ratio is large, the reference signatures are unusu-
ally different. It was decided to place a lower limit of
1.75 on this ratio and if the ratio was found to be be-
low 1.75, it was assumed that the reference signatures
were too similar, and the reference standard deviation
was adjusted up to 1.75 times the reference mean. In
experimentation a limit of 1.5 was also considered,
but the limit of 1.75 produced superior results. Im-
posing the lower limit on the ratio should reduce the
FRR although it might increase the FAR somewhat.
The decision on reference signatures being too
different was not based on the ratio of the standard
deviation to the mean of the distances between the ref-
erence signatures. Instead, the ratio of the mean to the
distances between the reference signature representa-
tions to the average length of that person’s signature
representations was examined. If this ratio was large,
then it was assumed that the reference signatures had
too much variation. It was decided to impose an upper
limit of 0.25 on this ratio. If the ratio was greater than
0.25, then the reference mean was reduced to 0.25
times the average length of the reference signatures’
representations. Values of 0.2 and 0.225 were also
considered in experimentation, but performance eval-
uation indicated that the 0.25 limit was superior. This
approach would be expected to reduce the FAR while
still allowing genuine signers a large degree of vari-
ability so as not to significantly raise the FRR.
Modifying the last technique that used multiple
characters to represent distance and imposing the
above upper bound and lower limits on the two ra-
tios, the technique was tested again and the detailed
results are presented in Table 11. A minimum 4.1%
total error rate is obtained which is a very significant
improvement on the results without the limits. The
technique is now quite reliable with a 1.8% FRR and
a 2.3% FRR. Smaller FAR or FRR is possible, but
the total error rates are then higher than the minimum
4.1% total error rate.
It is possible to investigate other modifications of
the techniques that have been investigated. In a practi-
cal system, it may be sufficient to just print a warning
when a user provides the reference signatures if the
variability of the signatures is unusually high or low.
There is then the option of requesting a new set of ref-
erence signatures.
Path Length and Elapsed Time
A slightly different extension to the earlier tech-
nique that used only distance characters involved us-
ing both the path length and the elapsed time in
the signature representation. The approach’s purpose
was to incorporate both the physical spacing and the
elapsed time in between turning points, thereby cap-
turing a notion of pen tip velocity. These features
were incorporated by inserting the appropriate num-
ber of T characters firstly, and then inserting a number
SECRYPT 2007 - International Conference on Security and Cryptography
56

Table 11: Error rates obtained after adjustment of variation.
r F-accept G-reject FAR FRR ER
0.0 0/325 141/609 0.0% 23.2% 23.2%
0.5 0/325 69/609 0.0% 11.3% 11.3%
1.0 3/325 27/609 0.9% 4.4% 5.4%
1.5 6/325 14/609 1.8% 2.3% 4.1%
2.0 8/325 13/609 2.5% 2.1% 4.6%
2.5 23/325 11/609 7.1% 1.8% 8.9%
3.0 37/325 8/609 11.4% 1.3% 12.7%
Table 12: Error rates using path length and elapsed time.
r F-accept G-reject FAR FRR ER
0.0 0/325 140/609 0.0% 23.0% 23.0%
0.5 1/325 72/609 0.3% 11.8% 12.1%
1.0 4/325 29/609 1.2% 4.7% 5.9%
1.5 6/325 15/609 1.8% 2.5% 4.3%
2.0 8/325 14/609 2.4% 2.3% 4.7%
2.5 23/325 12/609 7.1% 2.9% 9.1%
3.0 39/325 9/609 12.0% 1.5% 13.5%
of S characters (one S for every m pixels). Table 12
presents the results using this technique where the op-
timal uses a value of thirty for m and one T for every
four time units. The error rates produced using this
technique were slightly higher than those found in Ta-
ble 11, including an optimal 4.3% overall error rate.
Zero Effort FAR
Tests were performed using other users’ genuine
signatures as zero-effort forgeries. This test’s purpose
was to determine how effective the HSV system was
if the forger had no knowledge of the genuine user’s
signing style, and just signed his or her own signature.
The FAR for such a test should be much smaller than
for skilled forgeries, and ideally should be close to
zero, although it is known that for some feature-based
techniques the zero-effort FAR is not low. The total
number of zero-effort forgeries was 71282, since for
each signature in the database, every signature for ev-
ery other user is a zero-effort forgery. The optimal re-
sult for zero-effort forgeries will always be at r = 0.0
since the FRR is not a problem. At this threshold the
overall zero-effort FAR is 0.0%. However, it is more
realistic to use the same global threshold that was op-
timal for the skilled FAR tests in Table 11. When this
threshold (r = 1.5) was used, the zero-effort FAR is
1.4%, which was quite low.
Fewer Reference Signatures
The experiments performed so far have involved
the use of five reference signatures in order to estab-
lish the normal variability level for a particular user.
Additional experiments were undertaken to explore
the possibility of using fewer reference signatures,
perhaps three or even just one. When only a single
reference signature was used, no value for variability
could be obtained, so the reference mean was set to
0.25 times the length of the reference signature char-
acter string and the reference standard deviation was
set to 1.75 times the reference mean. The overall
error rates using three and one reference signatures
remained quite low at 8.4% and 12.8% respectively.
Few techniques in literature report results this accu-
rate when such a limited reference set is used.
Individual Thresholds
The results reported in this paper have been ob-
tained using the same threshold for all users in each
test. The results would improve significantly if op-
timal threshold values were used for each individ-
ual. Many studies reported in literature use individ-
ual thresholds, although none of them reports how
an individual threshold can be computed given only
the reference signatures. Generally, all studies using
individual thresholds arrive at locally optimal thresh-
olds by using the threshold for the lowest error rate for
each user individually, and then summing these error
rates to determine the overall error rate. If this ap-
proach is used the total error rate reduces from 4.1%
to 1.3%, which consists of a 1.3% FRR and 0% FAR.
The total number of misclassified signatures being
just eight. Additionally, only four users contribute
to this misclassification, meaning that 55 users (i.e.,
93% of the 59 users) would have a 0% overall error
rate if locally optimal thresholds were used. Clearly,
this shows the technique is highly reliable.
4 CONCLUSIONS
The results presented in this paper show that the pro-
posed HSV system is comparable to the highest qual-
ity signature verifiers presented in literature. The fea-
tures which have led to this success include:
The use of a string to represent the signature – this
allows existing string matching algorithms to be used
to determine distances between signatures. Further-
more, this makes the signature verifier quite tolerant
to variations in genuine signatures. For example, in
the signature database there was one individual who
sometimes signed using his middle initial, while other
times signed without his middle initial. When these
signatures are represented as strings, the only real dif-
ference are the characters in the middle of the signa-
ture. The signature verifier handles the situation well,
reporting a 20% FRR and a 0% FAR using the global
optimum threshold. Few other HSV systems perform
this well in such an extreme case.
IMPLEMENTATION AND ANALYSIS OF A HANDWRITTEN SIGNATURE VERIFICATION TECHNIQUE
57

Reference signature quality checking – This is un-
common in literature. It determines if the reference
signature variability is too high/low, and if so, adjust-
ing the reference mean and standard deviation.
Use of a small number of reference signatures –
Using five reference signatures led to a 4.1% overall
error rate. Results using three and even one reference
signature were also quite attractive (as low as 8.7%
using three and 12.5% using just one) when compared
to similar experiments in literature.
The overall results used a single globally optimal
threshold value (i.e., the threshold value was the same
for each user). By choosing a locally optimal thresh-
old for each individual the total error rate drops to just
1.3% FRR and 0% FAR.
REFERENCES
Dimauro, G., Impedovo, S., and Pirlo, G. (1994).
Component-Oriented Algorithms for Signature Veri-
fication. International Journal of Pattern Recognition
and Artificial Intelligence. Vol 8, No 3, 771–793.
Gupta, G.K., and Joyce, R.C. (1997a). A Sudy of Shape in
Dynamic Handwritten Signature Verification. Submit-
ted for publication.
Gupta, G.K., and Joyce, R.C. (1997b). A Sudy of Some Pen
Motion Features in Dynamic Handwritten Signature
Verification. Submitted for publication.
McCabe, A. (2000). Markov Modelling of Simple Direc-
tional Features for Effective and Efficient Handwrit-
ing Verification. R. Mizoguchi and J. Slaney (Eds.):
PRICAI 2000, LNAI 1886, 801(1–12).
McCabe, A. and Trevathan, J. (2007). Pre-processing time
dependent signals in a noisy environment, In Proceed-
ings of the 4
th
International Conference on Informa-
tion Technology - New Generations, 393–397.
Nelson, W., Turin, W. and Hastie, T. (1994). Statistical
Methods for On-line Signature Verification., In Inter-
national Journal of Pattern Recognition and Artificial
Intelligence, vol. 8, No. 3, 749-770.
Trevathan, J. and McCabe, A. (2005). Remote Handwritten
Signature Authentication, In Proceedings of the 2
nd
International Conference on e-Businees and Telecom-
munications Engineers, 335–339.
Wagner, R. A. and Fischer, M. J. (1974). The String-to-
String Correction Problem. Journal of the ACM. Vol
21, No 8, 168–173.
SECRYPT 2007 - International Conference on Security and Cryptography
58
