
FAST SOUND FILE CHARACTERISATION METHOD
Lucille Tanquerel and Luigi Lancieri
France Télécom R&D, 42 rue des coutures, Caen, France
Kewords: Musical similarities, rhythm, variation.
Abstract: This article describes a fast technique of characterization of sound documents based on a statistical measure
of the variation of the signal. We showed that a very limited sampling was sufficient to obtain a reasonable
performance of the characteristic while being 100 times faster to calculate than a complete sampling. During
preliminary tests, we carried out a first validation of our approach by highlighting a correlation of 0.7
between the human perception of the rhythm and our characteristic as well as an error of recognition lower
than 5%. In this new series of tests, we show that our approach makes possible to associate to a cut file its
missing half, with an error rate from approximately 30%.
1 INTRODUCTION
Many sources give a report of needs and strong
commercial potential related to the automated
management of sound documents.
The description of the sound characteristics is a key
element to carry out automatic treatments of audio
data. This type of measurement can be useful not
only to characterize the data but also to describe the
musical tastes of the users on the basis of their
activity of listening. These techniques become
critical taking into account the increasing quantity of
sound documents found on the Web or in content
providers musical data bases. Many works were
completed in this field but the techniques of
treatment remain heavy to implement and are
missing standards.
The objective of this document is to describe a
method making it possible to generate compactly
and rapidly a signature of a sound file by the
extraction of physical characteristics distributed on
the file. The innovation of our proposal relates on
the organization of the extraction of the samples and
on the mode of analysis to provide very quickly a
representative signature of the musical content.
The organization of the extraction defines the way
the samples are taken. It is possible, for example, to
determine the spectrum on the whole musical file or
only over the first minute. Our proposal aims at
carrying out a minimal sequential statistical
sampling distributed on the sound file according to a
particular law of probability.
The first work described in (Tanquerel, 2006)
showed on the one hand the stability of the signature
in spite of a random and limited sampling. In
addition, this work showed that the signature offered
a good representativeness of the rhythmic nature of
the musical contents. In this work, we wished to go
further concerning the capacity of discrimination of
the signature, the objective being to cut a file in two
equal parts in order to see whether the comparison
between the signatures of each half makes it possible
to determine if these two halves are those of the
same file.
2 GENERAL DESCRIPTION
The following figure shows the bases of the
signature process from the analysis of samples taken
from a sound file. The idea is to capture the image of
the swinging of the sound spectrum such as we can
perceive it while observing bars-graph of an audio
reader. The samples to be analyzed are collected by
triplets (E0, E1, etc.) of contiguous specimen of
duration K. In this study, each triplet is collected in a
random way but by respecting a chronological order.
I.e. if one decides to take 10 triplets, the only
constraint will be that the first one precedes the
second one which will have to precede the third one,
etc. The space of time between each triplet could be
unspecified and the sum of all triplets will cover a
limited part of the file.
149
Tanquerel L. and Lancieri L. (2007).
FAST SOUND FILE CHARACTERISATION METHOD.
In Proceedings of the Second International Conference on Signal Processing and Multimedia Applications, pages 149-152
DOI: 10.5220/0002133901490152
Copyright
c
SciTePress
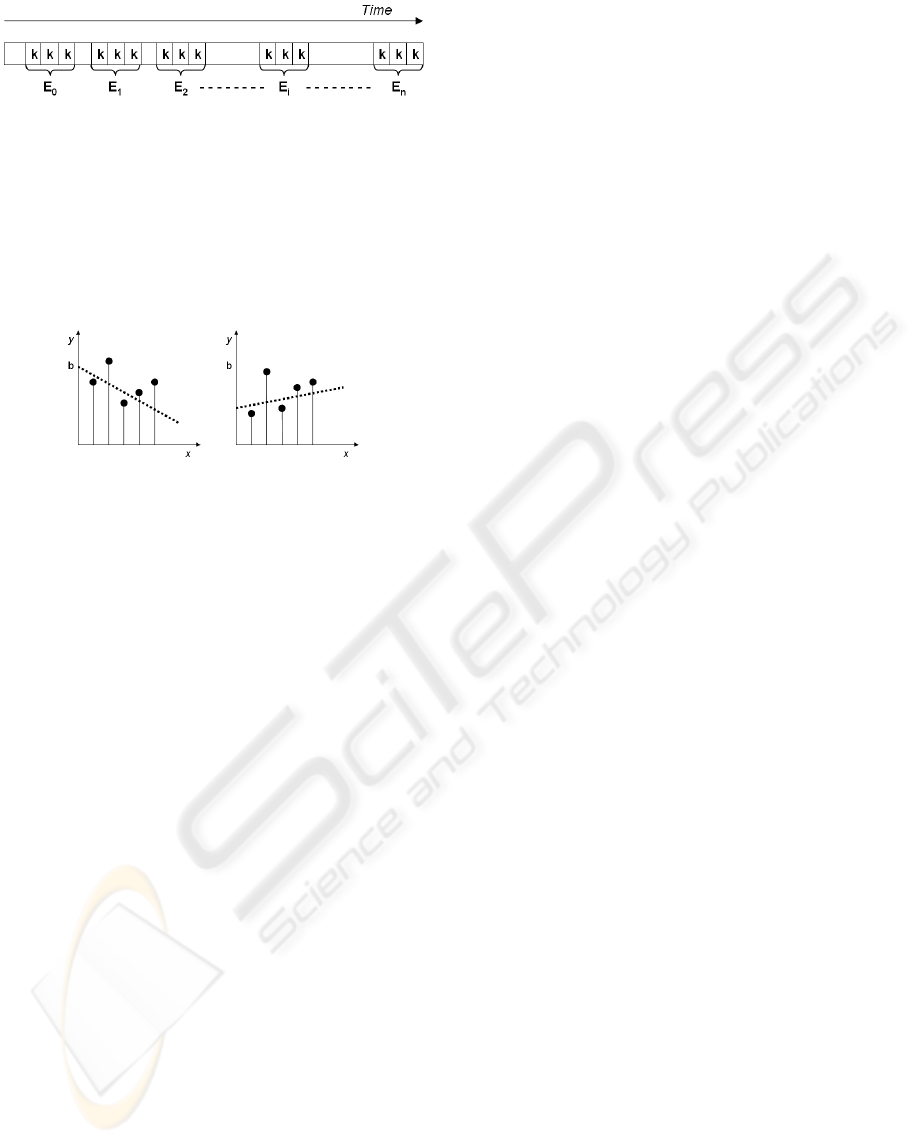
Figure 1: Collect of samples by triplet in a sound file.
On each sample k of each triplet, we compute the
distribution of frequencies within the meaning of
Fourier and the directing coefficient p of the straight
regression line binding the level (y) to each class of
the spectrum frequency (y). This straight regression
line is expressed in the following way: y = px + b.
Figure 2: The slope of the spectrum of 2 elements of a
triplet.
The analysis of the behaviour of p (slope of the
line side of figure 2) will contribute to evaluate the
rhythmic behaviour by measuring the swinging of
the spectrum over one period, and in average value
on the various samples. By reference to mechanics,
this swinging, its speed and its acceleration are
evaluated as follows.
The first stage consists in identifying the number
of triplets as well as their position in the signal. On a
fraction of the sound file, we extract the first triplet
on which we calculate the 3 spectra then the
directing coefficients of the straight regression lines.
Thus 3 values of slope (p11, p12, p13) are obtained.
The speed of swinging is obtained by calculating the
difference between 2 consecutive slopes. We obtain
2 values of speed (v11, v12) for each triplet.
Acceleration a1, single by triplet, is evaluated on
speeds variation. We recompute these data on the
following triplet and so on until the end of the file.
At the end of the operation we have a set of values
of coefficients [(p11, p12, p13), (p21, p22, p23), …,
(pn1, pn2, pn3)], speeds [(v11, v12), (v21, v21), … ,
(vn1, vn2)] and accelerations (a1, a2,…, an) for n
triplets representative of the piece of music. The
behaviour of swinging (position, speed and
acceleration) is obtained by a combination of the
average values and standard deviation of all these
data (pi, vi, ai).
3 STATE OF THE ART
The process described in this document is
distinguishable from former work by a better
descriptive capacity compared to resources
necessary for calculation and storage. The
descriptive capacity is related to the rhythmic
evaluation by the analysis of the swinging structure.
These elements do not need to be obtained on the
whole sound file; a limited statistical sampling is
enough. The signature requires a priori only the
storage of a very limited quantity of numerical data.
In addition, the signature will be almost independent
of the format or the sound quality of the piece, even
if this last one is incomplete.
The existing techniques for the characterization
of musical files and research of similarities (MIR -
Music Information Retrieval) are various. There are
three principal approaches: those based on signal
processing, collaborative filtering, and data mining.
The approaches based on signal processing consist
in analyzing directly the content of the audio file
(signal and spectrum). In general, these
characteristics are modelled by learning systems,
and comparisons are carried out for the research of
similarities (McKay, 2004, Tzanetakis, 2001).
Another example of technology as regards acoustic
SIGMAP 2007 - International Conference on Signal Processing and Multimedia Applications
150

prints is the TRM (This Recognizes Music)
(http://rm.relatable.com). This technology was
developed by the American company Relatable.
Basically, this system allows the recognition of
pieces of music by acoustic analogy exploiting
“audio code bar” type of print which generates a
single signature. As soon as the numerical print was
created, it is sent to the TRM server, which
compares the print with that of an existing song in
the data base of a customer. The last commercial
version of TRM server can manage more than 5000
prints (already extracted) per second, or until several
billion requests per day.
4 PERFORMANCES
To evaluate the performances of our method we
carried out a series of preliminary works which
showed a certain level of representativeness of our
numerical signature, in particular compared to the
human perception of the rhythm. Indeed by
questioning a group of 10 users so as to evaluate
their perception of the rhythm on 2 corpora
respectively composed of 28 and 50 pieces of music.
The first corpus was made up so as to represent a
broad rhythmic spectrum; the second corpus was
made up of audio pieces chosen randomly. The
results showed a level of correlation between the
signature and the opinions of the users of about 0.7.
In a second experiment we sought to evaluate the
validity of the signature in the case of several
sequential samplings of a same piece. This
validation is particularly important taking into
account the very low level of coverage of about 5 to
10% for each audio piece. There still, the results are
rather encouraging because the results of 50
successive signatures are homogeneous in more than
93% of the cases. The reader can refer to this work
(Tanquerel, 2005) for more details.
We present in the continuation of this document
a series of more recent works aiming at confirming
the reliability of our signature under a
complementary point of view. In this case, we
constituted a corpus of 100 pieces so as to cover
various musical kinds.
4.1 Principle of the Validation Method
In this new series of tests, each file is cut out in two
equal parts. The goal is to compare all the halves
between each other in order to see whether the
signature similarity makes it possible to associate to
each half its missing half. Considering the limited
sample size and the limited rate of covering, the
probability of sampling parts musically similar in
each half of the same piece is very weak. Under
these conditions, we consider that the capacity of
recognizing automatically the two parts of the same
audio piece is a good indication of the descriptive
capacity of the signature.
In our approach, we consider that two halves are
associated when the difference (in absolute value) of
their signature is lower than a certain threshold.
For n audio pieces, we will have two sets of halves
(m1a, m2a, m3a… mna) and (m1b, m2b, m3b…
mnb) both of cardinal n. Each mia, i = {1… n} is
compared with each mjb, j = {1… n}.
The results are expressed with percentages:
percentage of recognized exact associations (%rec),
percentage of association errors (%err), and
percentage of dissociation errors (%diss).
4.2 The Tests
For these tests, we used the whole of 100 pieces
describes higher. The principle is to increment the
value of the threshold until the percentage of
recognitions reaches the 100% (which has as a
consequence a null percentage of dissociation errors)
The characteristic of the signature taken into account
is speeds standard deviation (SSD) or accelerations
standard deviation (ASD): the rate of covering is
20% and then 25%, the sample size is 1024, 2048,
4096 and then 8192
Then the goal is to find the optimum. This
one is not inevitably reached for a maximum rate of
recognitions because a maximum rate of
recognitions can be combined at a very important
association error rate.
4.3 Calculation of the Optimum
The concept of optimum is often complex and
difficult to evaluate. This study does not escape the
rule. We thus make two proposals to evaluate the
optimum in our measurements.
First proposal:
the optimum is reached when at least
50% of the pieces were recognized and when the
association error rate is lower than 33%.
Here are some results in the following tables. Each
table is divided into two distinct parts,
corresponding to the two different rates of covering
(20% and 25%). The columns %rec and %err
respectively represent the percentage of recognitions
and the percentage of association errors.
FAST SOUND FILE CHARACTERISATION METHOD
151
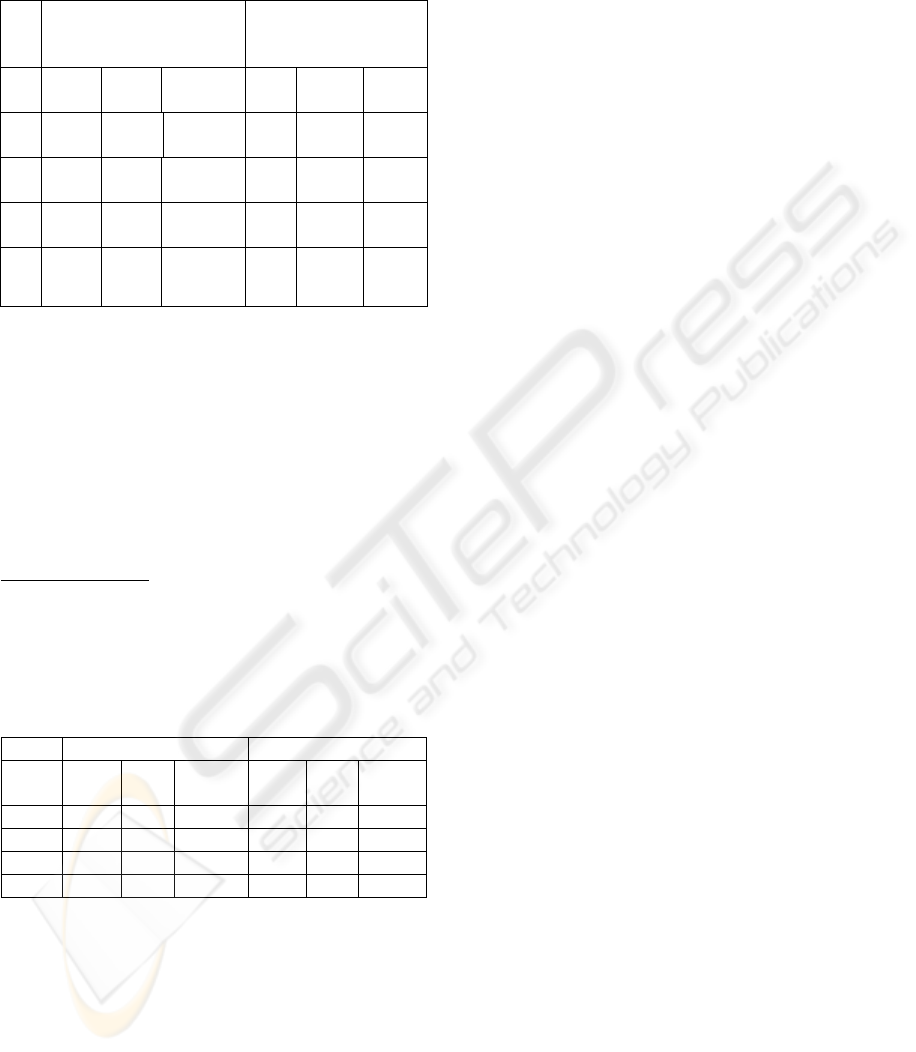
In each box, we can read the value of the fork in
which the optimum is. The best results are indicated
in bold.
S
S
D
20% 25%
%rec %err threshold %rec %err thresho
ld
10
24
50
61
22,77
32,94
105
155
50
69
21,17
32,02
98
150
20
48
50
63
24,04
32,74
97
134
50
70
21,68
32,85
87
133
40
96
50
58
26,2
32,97
83
106
50
68
20,95
32,67
66
104
81
92
50
64
21,13
32,95
43
69
50
70
20,36
32,56
42
67
Figure 3: Results for SSD.
The results for ASD do not appear there but they are
likely the same as SSD. The optimal results are
located in the same boxes for each table (8192 - 20%
or 8192 - 25%). Contrary to what our first work had
us think, a minimal sampling, as well on the level of
the rate of covering as of the sample size, seems not
being really interesting.
Second proposal:
we look at which place the
crossing between the curve of association errors and
the curve of dissociation errors is located. The
principle is the same as that is described here in
former work concerning the robustness of the
signature.
The results are presented with this table (ASD only).
ASD 20% 25%
% err
%
diss
threshol
d
% err
%
diss
threshol
d
1024 35,91 35 242 32,13 32 213
2048 35,49 35 213 31,25 31 193
4096 37,87 37 205 32,07 32 106
8192 34,48 35 129 30,15 29 109
Figure 4: Results for ASD.
Likewise the results concerning the first proposal,
the optimal values are in the boxes 8192 - 20% or
8192 - 25%.
It is noted that the percentage of errors
(association and dissociation) reaches an average
value of 30%, which implies a percentage of
recognitions of 70%. This value is high considering
that the analysed parts of the audio piece are in fact
different. This shows that our method has a good
capacity of intrinsic recognition.
The results of these last tests are rather
promising and it could be interesting in later work to
combine variously the characteristics SSD and ASD
in order to see whether we can increase the
performances of our method.
5 CONCLUSION
The characterization of the musical files represents
an important stake insofar as it makes it possible to
consider the indexing and the automated and
powerful management of multimedia contents. This
automation can be applied of several ways implying
the sound document itself or the user from the point
of view of modelling musical perception.
In this context, we developed and patented a fast
technique of characterization based the variation of
the signal. We showed that a limited sampling of
sequences was sufficient to obtain a reasonable
performance of the characteristic while being more
than 100 times faster to calculate than a complete
sampling. We approached the methodology of
validation according to two different angles: the
matrix of confusion and the comparison with human
perception. Each one of these methods makes it
possible to conclude that the technique offers a
coherent and more than all a fast representation of
the sound files.
This work opens other prospects to us, in particular
in the combination of the various characteristics.
REFERENCES
Tanquerel, L., Lancieri, L., 2005. Mesure rapide de
similarités musicales – Perception du rythme.
CORESA 2006
McKay, C., Fujinaga, I., 2004. Automatic genre
classification using large high-level musical. ISMIR
2004.
Tzanetakis, G., Essl, G., Cook, P., 2001. Automatic
musical genre classification of audio signals. ISMIR
2001
SIGMAP 2007 - International Conference on Signal Processing and Multimedia Applications
152
