TOWARDS BUILDING FAIR AND ACCURATE EVALUATION
ENVIRONMENTS
Dumitru Dan Burdescu and Marian Cristian Mihăescu
Software Engineering Department, University of Craiova, Bvd. Decebal Nr. 107, Craiova, Romania
Keywords: Knowledge acquisition, Knowledge Management, Decision Support System, Measurement,
Experimentation.
Abstract: Each e-Learning platform has implemented means of evaluating learner’s knowledge by a specific grading
methodology. This paper proposes a methodology for obtaining knowledge about the testing environment.
The obtained knowledge is further used in order to make the testing system more accurate and fair.
Integration of knowledge management into an e-Learning system is accomplished through a dedicated
software module that analyzes learner’s performed activities, creates a learner’s model and provides a set of
recommendations for course managers and learners in order to achieve prior set goals.
1 INTRODUCTION
Every e-Learning platform has implemented a
mechanism for assessing the quantity of
accumulated knowledge for a certain discipline. A
problem that frequently arises is that the system in
place may not be fair regarding the ordering of
learners according with accumulated knowledge.
Usually, there are situations when the distributions
of grades is not normal, such that many learners are
clustered although there are differences regarding
their accumulated knowledge.
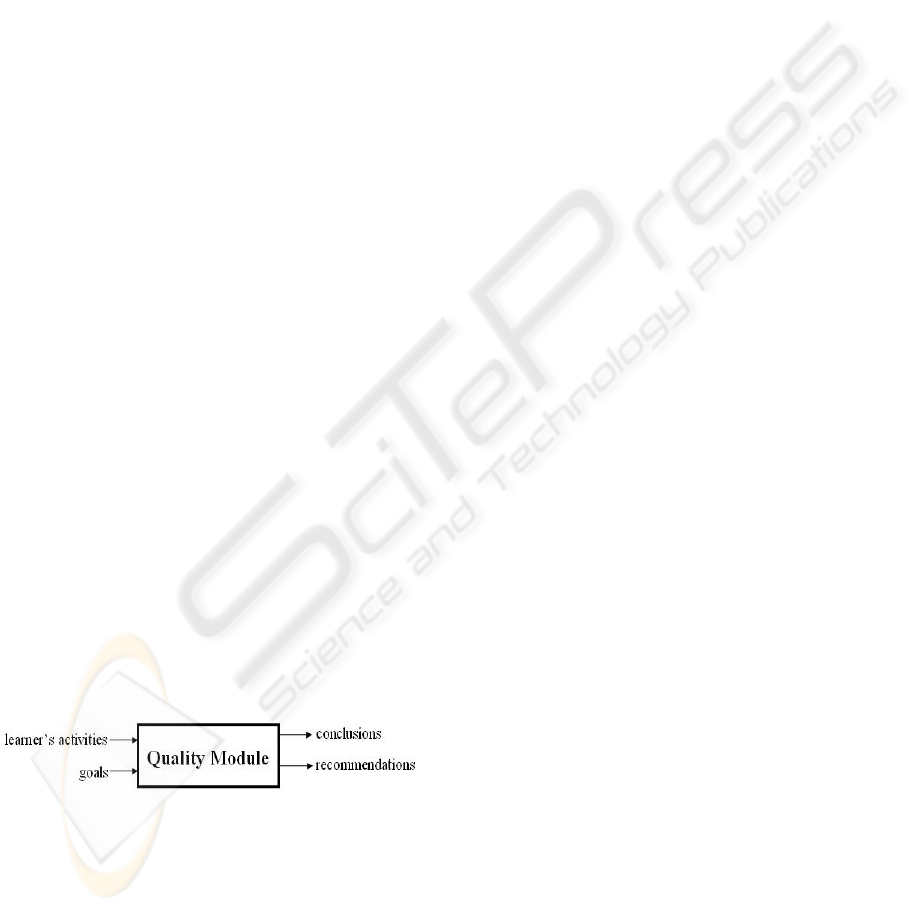
In order to estimate the way a platform evaluates
learners we have developed a separate software
module that has as input the actions executed by
learners and a set of goals and as output conclusions
and a set of recommendations. This module is called
Quality Module (QM) and is presented in Figure 1.
Figure 1: Functionality of Quality Module.
As presented in Figure 1 the input is represented
by learner’s activities and by goals. Learner’s
activities represent the data used for creating
learner’s model. The goals represent the criteria that
need to be optimized in order to obtain a better
evaluation environment.
The evaluation environment is represented by
the setup put in place within an e-Learning platform
for assessment of learners. The setup consists of
course materials and test quizzes that are set up by
course managers. The performed analysis and the
results obtained by QM may be performed only
when all setup has been done.
Learner’s activities are obtained by specific
methods embedded in our e-Learning platform,
called Tesys (D. D. Burdescu, C. M. Mihăescu,
2006). The activities are logged in files and in a
database table and processed off-line by QM. Goals
regard course administrators and learners and are
finally translated into parameters for the QM.
Conclusions obtained by QM regard the level of
fulfilling proposed goals. This is an objective
measure of the quality of the evaluation
environment. On the other hand, the
recommendations represent advice for course
managers and learners. The aim of recommendations
is to increase the quality of the evaluation
environment. The procedure consists of several
steps. Firstly, the platform has to produce enough
data regarding the learner’s performed activities
such that a learner’s model of good quality is
obtained. At this step there are also set up goals.
Course managers set goals regarding their course
and learners set up their own goals. This step is
called SETUP and is considered to be the most
important one since next steps heavily rely on it.
After the model has been obtained the next step
is to obtain recommendations. The recommendations
277
Dan Burdescu D. and Cristian Mih
ˇ
aescu M. (2007).
TOWARDS BUILDING FAIR AND ACCURATE EVALUATION ENVIRONMENTS.
In Proceedings of the Second International Conference on Signal Processing and Multimedia Applications, pages 273-278
DOI: 10.5220/0002136402730278
Copyright
c
SciTePress

are supposed to be strictly followed by course
managers. The period in which course managers
carry out the recommendations is called EEI
(Evaluation Environment Improvement). The
activities performed by learners in this period will
not be taken into consideration regarding in the
learner’s model or recommendations by the QM.
After the EEI period ends a new dataset of learner’s
performed actions is recorded. This dataset is used
for rebuilding the learner’s model and reevaluation
of initially set goals. This step is called EER
(Evaluation Environment Reevaluation).
Regarding the learner’s recommendations, the e-
Learning platform has implemented means of
keeping track of recommendations made to learners
and the way the recommendations were followed.
This is accomplished also in EER step. The QM
provides at this step conclusions regarding the
quality of recommendations by evaluating whether
or not the learners were helped to reach their goals
or not.
Figure 2: Logic of Quality Module.
This three step process may have as many
iterations as needed. Each reevaluation step
compares a challenger learner’s model with initial
model in terms of classification accuracy. The model
with best accuracy will be further used for making
recommendations to learners. The challenger model
is based also on newly recorded data from the time
old model has been obtained. It is a primary concern
to continuously improve the learner’s model in terms
of classification accuracy. This is the basis for
obtaining valuable recommendations for learners
and course managers.
For course managers, the reevaluation step
checks if recommendations for course managers
helped in reaching their goals. Besides measuring
the progress made in reaching their goals, a new set
of recommendations is obtained for the new status of
the evaluation environment.
As presented, the QM has as primary tasks
obtaining a learner’s model and estimating the
distribution of learners when classifying them
according to accumulated knowledge. This
represents the Knowledge Management (KM) part
of the QM. In this way we present a way in which
learning can profit from available KM concepts and
technologies (R. Ericet. al. 2005).
Knowledge is considered to be “the information
needed to make business decisions” (
P. Manchester,
1999
), and so knowledge management is the
“essential ingredient of success” for 95 per cent of
CEOs (
P. Manchester, 1999).
The following picture presents the relation
between the e-Learning platform and QM.
Figure 3: Relation between Quality Module and e-
Learning platform.
An important aspect regarding the QM is the
structure of data set as input and how the goals are
specified.
Within the e-Learning platform there were
implemented specific mechanism of logging and
recording performed activities in structured format.
This is accomplished in a table from the database
which has the structure presented in Table 1.
Table 1: Structure of activity table.
Field Description
id primary key
userid
identifies the user who performed the
action
date
stores the date when the action was
performed
action stores a tag that identifies the action
details stores details about performed action
level specifies the importance of the action
Regarding the goals, when the QM is set up
there are created two sets: one with goals for
learners and one with goals for course managers.
Each learner or course manager may set up his own
goals in the SETUP step by choosing one goal form
the set of goals. This step ends when there has been
enough activity registered such that an accurate
learner’s model is created.
QM used machine learning and modelling
techniques as business logic. The KM techniques
that we use are decision trees and clustering
methods. In short, decision trees are used for
verifying the “goodness” of data and obtaining the
learner’s model while clustering is used for
SIGMAP 2007 - International Conference on Signal Processing and Multimedia Applications
278
obtaining conclusions and recommendations. The
whole process is accomplished the standard
modelling steps: defining the objective, preparing
the sources of web data, selecting the methodology,
processing and evaluating the model, validating the
model, implementing and maintaining the model
(Olivia Parr Rud, 2001).
2 EMPLOYED KNOWLEDGE
MANAGEMENT CONCEPTS
AND TECHNOLOGIES
As presented in introduction, the QM produces
recommendations for learners and for course
managers. The recommendations are obtained by
analyzing a learner’s model that is created based on
performed actions.
Within Tesys e-Learning platform the actions are
represented by all performed activities that are
logged or other information that may be derived
(e.g. average grade of tests, number of tests). Among
the logged activities that are part of model’s
parameters are: logging into the Tesys platform,
taking a test, sending a message to a course
manager, downloading course materials.
Besides activity data, Tesys platform has
implemented a transfer function that associates the
amount of transferred data with the corresponding
action that triggered the transfer. The data traffic that
is transferred by learners represent another feature of
the learner model that is created.
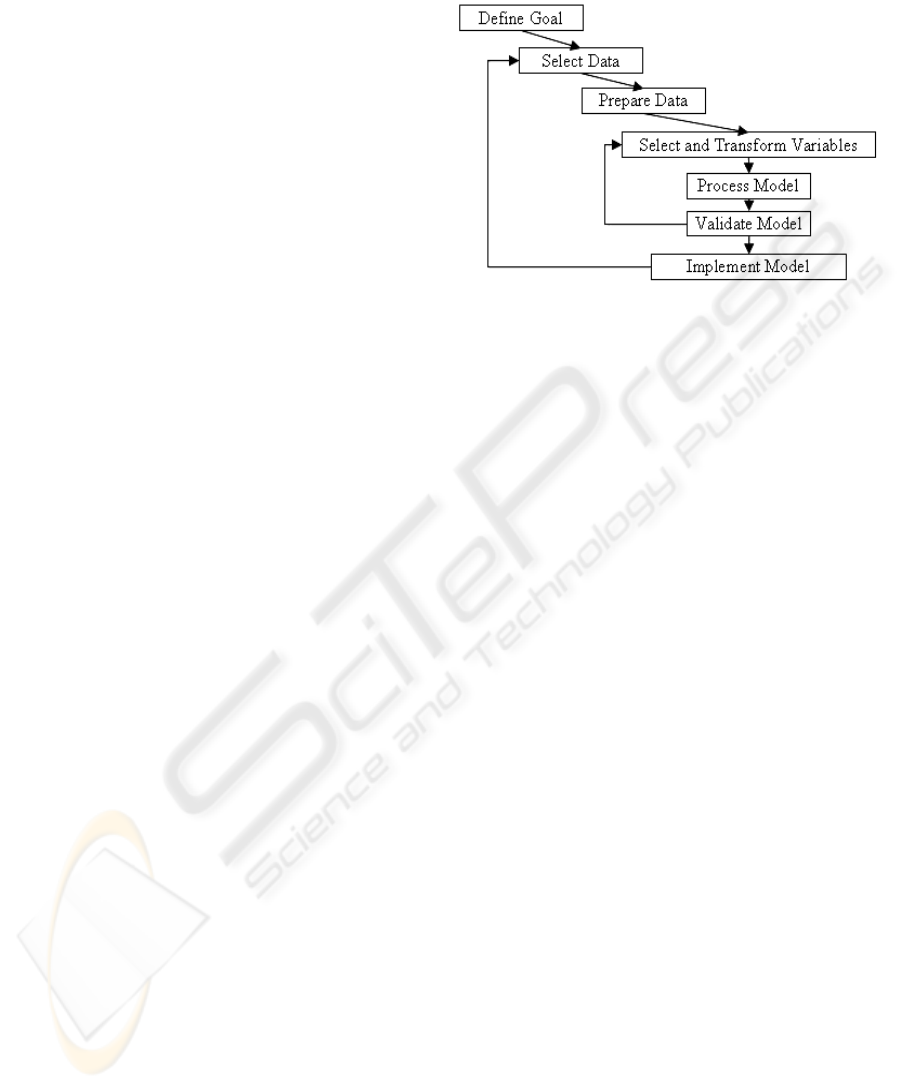
The whole process is conducted following the
steps of target modelling (see figure 4) (Olivia Parr
Rud, 2001).
Defining the goal represents the first step. Our
goal is to create a model of analysis for Tesys e-
Learning platform that is to be used for optimizing
the criteria specified by learners and course manager
goals. Setting up the goals is accomplished by
formally defining the criteria that is to be evaluated
and optimized. Selection and preparation of data are
the next steps. Here, we have to determine the
necessary data that will enter the modelling process.
The preparation gets that data and puts it into a form
ready for processing of the model. Since the
processing is done using machine-learning
algorithms implemented in Weka workbench (Ian H.
Witten et. al. 2000), the output of preparation step is
in the form of an arff file. Under these
circumstances, we have developed an offline Java
application that queries the platform’s database and
crates the input data file called activity.arff. This
process is automated and is driven by a property file
in which there is specified what data will lay in
activity.arff file.
Figure 4: Steps for target modeling.
For a learner in our platform we may have a very
large number of attributes. Still, in our procedure we
used only three: the number of loggings, the number
of taken tests and the number of sent messages. Here
is how the arff file looks like:
@relation activity
@attribute noOfLogins {<10,<50,<70,<100,>100}
@attribute noOfTests {<10,<20,<30,<50,>50}
@attribute noOfSentMessages {<10,<20,<30,<50,>50}
@attribute dataTraffic {<10,<20,>20}
@data
<50,<10,<10,<10
>100,<20,<20,<20
As it can be seen from the definition of the
attributes each of them has a set of nominal values
from which only one may be assigned. The values of
the attributes are computed for each of the 650
learners and are set in the @data section of the file.
For example, the first line says that the learner
logged in less than fifty times, took less than ten
tests, sent less than ten messages to professors and
had a data traffic less than 10MB.
Now, since we have prepared the data we start
analyzing it. Choosing between two learning
algorithms given a single dataset is not a trivial task
(R. Agrawal et. al. 1994). Firstly, we make sure the
data is relevant. We test the “goodness” of data
trying to build a decision tree like C4.5 (R. Quinlan,
1993) from data. A decision tree is a flow-like-chart
tree structure where each internal node denotes a test
on an attribute, each branch represents an outcome
of the test and leaf nodes represent classes (Jiawei
Han et. al., 2001).
The basic algorithm for decision tree induction is
a greedy algorithm that constructs the decision tree
in a top-down recursive divide-and-conquer manner
(Jiawei Han et. al., 2001).
The computational cost of building the tree is
O(mn log n)(I. H. Wittenet. al., 2000). It is assumed
TOWARDS BUILDING FAIR AND ACCURATE EVALUATION ENVIRONMENTS
279

that for n instances the depth of the tree is in order of
log n, which means the tree is not degenerated into
few long branches.
The information gain measure is used to select
the test attribute at each node in the tree. We refer to
such a measure an attribute selection measure or a
measure of goodness of split. The algorithm
computes the information gain of each attribute. The
attribute with the highest information gain is chosen
as the test attribute for the given set (Jiawei Han et.
al., 2001).
Finally, the cross-validation evaluation technique
measures the correctly and incorrectly classified
instances. We consider that if there are more than
80% of instances correctly classified than we have
enough good data. The obtained model is further
used for analyzing learner’s goals and obtain
recommendations. The aim of the QM is to “guide”
the learner on the correct path in the decision tree
such that he reaches the desired class.
Regarding fulfilling course manager’s goals we
use a method for classification of learners. For this,
we employed a clustering method, which is the
process of grouping a set of physical or abstract
objects into classes of similar objects (Jiawei Han et.
al., 2001). For our platform, we create clusters of
users based on their activity and data transfer.
As a product of clustering process, associations
between different actions on the platform can easily
be inferred from the logged data. In general, the
activities that are present in the same profile tend to
be found together in the same session. The actions
making up a profile tend to co-occur to form a large
item set (R. Agrawal et. al.,1994).
There are many clustering methods in the
literature: partitioning methods, hierarchical
methods, density-based methods such as (Ester M.et.
al.. 1996), grid-based methods or model-based
methods. Hierarchical clustering algorithms like the
Single-Link method (Sibson, R., 1973) or OPTICS
(Ankerst, M. et. al.,1999) compute a representation
of the possible hierarchical clustering structure of
the database in the form of a dendrogram or a
reachability plot from which clusters at various
resolutions can be extracted.
Because we are dealing with numeric attributes,
iterative-based clustering is taken into consideration
from partitioning methods. The classic k-means
algorithm is a very simple method of creating
clusters. Firstly, it is specified how many clusters are
being thought: this is the parameter k. Then k points
are chosen at random as cluster centers. Instances
are assigned to their closest cluster center according
to the ordinary Euclidean function. Next the
centroid, or the mean, of all instances in each cluster
is calculated – this is the “means” part. These
centroids are taken to be the new center values for
their respective clusters. Finally, the whole process
is repeated with the new cluster centers. Iteration
continues until the same points are assigned to each
cluster in consecutive rounds, at each point the
cluster centers have stabilized and will remain the
same thereafter (I. H. Wittenet. al., 2000).
From a different perspective for a cluster there
may be computed the following parameters: means,
standard deviation and probability (μ, σ and p). The
EM algorithm that is employed is a k-means
clustering algorithm type. It takes into consideration
that we know neither parameters. It starts with initial
guess for the parameters, use them to calculate the
cluster probabilities for each instance, use these
probabilities to estimate the parameters, and repeat.
This is called the EM algorithm for “expectation-
maximization”. The first step, the calculation of
cluster probabilities (which are the “expected” class
values) is “expectation”; the second, calculation of
the distribution parameters is “maximization” of the
likelihood of the distributions given the data (I. H.
Wittenet. al., 2000).
The quality of clustering process is done by
computing the likelihood of a set of test data given
the obtained model. The goodness-of-fit is measured
by computing the logarithm of likelihood, or log-
likelihood: and the larger this quantity, the better the
model fits the data. Instead of using a single test set,
it is also possible to compute a cross validation
estimate of the log-likelihood.
3 EXPERIMENTAL RESULTS
The study starts by setting up the e-Learning
platform. This means that all the learners and course
managers accounts have been created and the
evaluation environment has been set up.
At this time the QM is also set up by specifying
the set of goals for learners and course managers.
For learners the set of goals from which they may
choose is:
- Minimization of the time in which a certain
level of knowledge is reached. This is accomplished
by specifying a desired grade.
- Obtaining for sure a certain grade. The learner
has to specify the grade he aims for.
Course managers may choose from two goals:
- Having a normal distribution of grades at
chapter level.
- Having a testing environment that ensures a
minimum time in which learner reaches a knowledge
level for passing the exam.
For these goals there were created two sets of
recommendations. Learners may obtain one of the
following recommendations:
SIGMAP 2007 - International Conference on Signal Processing and Multimedia Applications
280

- More study is necessary for chapter X.
- You may go to the next chapter.
- You need to take more tests at chapter X.
For course managers the set of recommendations
is:
- At chapter X there are needed harder/easier
questions.
- At chapter X there are to few/many questions.
This platform is currently in use and has three
sections and at each section, four disciplines. Twelve
professors are defined and more than 650 learners.
At all disciplines, there are edited almost 2500
questions. In the first month of usage, almost 500
tests were taken. In the near future, the expected
number of learners may be close to 1000.
Recording learner’s activity under these
circumstances provides great information regarding
user traffic. After six month of usage, there are more
than 40,000-recorded actions.
With data from database (especially from
activity table), we follow the presented methodology
of analyzing the platform. We look at three different
ways in which the input can be massaged to make it
more amenable for learning schemes: attribute
selection, attribute discretization and data cleansing
(I. H. Wittenet. al., 2000). In many practical
situations, there are far too many attributes for
learning schemes to handle, and some of them –
perhaps the overwhelming majority – are clearly
irrelevant or redundant. Consequently, the data must
be preprocessed to select a subset of attributes to use
in learning. Of course, learning schemes themselves
try to select attributes appropriately and ignore
irrelevant and redundant ones, but in practice, their
performance can frequently be improved by
preselection.
Therefore, we define the set of attributes that are
used in our process. Choosing the attributes is highly
dependent on data that we have, domain knowledge
and experience. For our classification we choose
four attributes: nLogings – the number of loggings,
nTests – the number of taken tests, avgTests – the
average of taken tests and nSentMessages – the
number of sent messages, dataTraffic – the quantity
of data traffic transferred by learner. For each
registered learner the values of these attributes are
determined based on the data from the presented
relations. Each learner is referred to as an instance
within the process.
The values of attributes are computed for each
instance through a custom developed off-line Java
application. The outcome of running the application
is in the form of a file called activity.arff that will
later be used as data source file.
Now we are ready to start processing the model.
The first step estimates the “goodness” of data. After
running the algorithm, the obtained decision tree had
17 leaves (which represent in fact classes) and 25
nodes. The time to build the model was 0.13
seconds. The stratified cross-validation evaluation
technique revealed that 575 (88.6 %) instances were
correctly classified and 75 (11.4%) were incorrectly
classified. The confusion matrix showed exactly the
distribution of incorrectly classified instances among
classes. The results prove that obtained model is
accurate enough for creating recommendations
based on it.
For obtaining recommendations for course
managers we have used the EM algorithm. Running
the EM algorithm created four clusters. The
procedure clustered 130 instances (20%) in cluster 0,
156 instances (24%) in cluster 1, 169 instances
(26%) in cluster 2 and 195 instances (30%) in cluster
3. For these clusters, we compute the likelihood of a
set of test data given the model. Weka measures
goodness-of-fit by the logarithm of the likelihood, or
log-likelihood: and the larger this quantity, the better
the model fits the data. Instead of using a single test
set, it is also possible to compute a cross validation
estimate of the log-likelihood. For our instances, the
value of the log-likelihood is -2.61092, which
represents a promising result in the sense that
instances (in our case learners) may be classified in
four disjoint clusters based on their activity.
After the model has been created the
recommendations towards course managers were
made and the evaluation environment was altered
accordingly. After this EEI step (see Figure 2) the
QM started offering recommendations to learners.
The recommendations and the behavior of
learners (whether or not they followed
recommendations) were logged for further analysis.
The behavior of learners has a very important
role in obtaining challenger learner’s models that at
some point may replace the current one.
On the other hand, checking whether or not the
learners followed the recommendations may lead to
conclusions regarding the quality of
recommendations and of currently employed
learner’s model.
4 CONCLUSIONS
This paper presents a module that runs along an e-
Learning platform and makes it a better evaluation
environment .
The platform has built in capability of
monitoring and recording learner’s activity. Stored
activity and data traffic represents the data that we
analyze to obtain improve the quality of the
evaluation environment.
TOWARDS BUILDING FAIR AND ACCURATE EVALUATION ENVIRONMENTS
281

Our QM produces recommendations for learners
and course managers using different machine
learning techniques on the activity data obtained
from the platform. We use Weka workbench (I. H.
Wittenet. al., 2000) as environment for running
state-of-the-art machine learning algorithms and data
preprocessing tools. We have developed a custom
application that gets the activity data from the
platform and transforms it into the specific file
format used by Weka, called arff.
A decision tree learner is used for estimating
whether or not the data may be used to obtain
significant results. The outcome of decision tree
validation is the percentage of correctly classified
instances. We say that a value of over 80% in correct
classified instances is a promise that we might
finally obtain useful knowledge.
Clustering is used for estimating the
classification capability evaluation environment.
This is mainly performed to obtain
recommendations for course managers.
We have tested this procedure on data obtained
from the e-Learning platform on which 650 learners
were enrolled and had activity for six month. The
results are satisfactory and prove that the evaluation
environment can be successfully used in an e-
Learning process.
We plan using the QM on the same evaluation
environment (same disciplines and same test and
exam questions) but on different set of learners. This
may lead to further and continuous improvement of
the evaluation environment.
The QM may also run near other evaluation
environments in order to analyze goals and produce
recommendations. This would add important domain
knowledge and may significantly improve the
feature selection process and the business logic of
the QM.
REFERENCES
D. D. Burdescu, C. M. Mihăescu (2006). Tesys: e-
Learning Application Built on a Web Platform.
Proceedings of International Joint Conference on e-
Business and Telecommunications, Setubal, Portugal,
pp. 315-318.
Ras Eric, Memmel Martin, Weibelzahl Stephan (2005).
Integration of E-learning and knowledge management
- barriers, solutions and future issues. Biennial
Conference on Professional Knowledge Management -
WM 2005, Kaiserslautern, Germany, pp. 155-164.
Olivia Parr Rud (2001). Data Mining Cookbook –
Modeling Data for Marketing, Risk, and Customer
Relationship Management. Wiley Computer
Publishing.
Jiawei Han, Micheline Kamber (2001). Data Mining –
Concepts and Techniques. Morgan Kaufmann
Publishers.
I. H. Witten, E. Frank (2000). Data Mining – Practical
Machine Learning Tools and Techniques with Java
Implementations. Morgan Kaufmann Publishers.
R. Agrawal and R. Srikant (1994). Fast algorithms for
mining association rules. Proc. of the 20th VLDB
Conference, Santiago, Chile, pp. 487-499.
R. Quinlan (1993). C4.5: Programs for Machine Learning.
Morgan Kaufmann Publishers, San Mateo, CA.
S. Salzberg (1997). On Comparing Classifiers: Pitfalls to
Avoid and a Recommended Approach”. Data Mining
and Knowledge Discovery 1:3, pp. 317-327.
Nasraoui O., Joshi A., and Krishnapuram R. (1999).
Relational Clustering Based on a New Robust
Estimator with Application to Web Mining. Proc. Intl.
Conf. North American Fuzzy Info. Proc. Society
(NAFIPS 99), New York.
B. Mobasher, N. Jain, E-H. Han, and J. Srivastava (1996).
Web mining: Pattern discovery from World Wide Web
transactions. Technical Report 96-050, University of
Minnesota.
Ester M., Kriegel H.-P., Sander J., Xu X. (1996). A
Density-Based Algorithm for Discovering Clusters in
Large Spatial Databases with Noise. Proc. KDD’96,
Portland, OR, pp.226-231.
Sibson, R. (1973). SLINK: An Optimally Efficient
Algorithm for the Single-link Cluster Method. The
Computer Journal, 16(1): 30-34.
Ankerst, M., Breuing, M., Kriegel, H-P., Sander, J. (1999).
OPTICS: Ordering Points to Identify the Clustering.
Structure. In SIGMOD’99, 49-60.
Philip, Manchester (1999). Survey – Knowledge
Management. Financial Times.
SIGMAP 2007 - International Conference on Signal Processing and Multimedia Applications
282
