SEARCHING FOR A ROBUST MFCC-BASED
PARAMETERIZATION FOR ASR APPLICATION
J. V. Psutka, Luboš Šmídl and Aleš Pražák
Department of Cybernetics, University of West Bohemia, Pilsen, Czech Republic
Keywords: MFCC parameterization, critical band-pass filters, robust front-end.
Abstract: The paper concerns with searching for areas of robust setting a MFCC-based parameterization as regards
numbers of band-pass filters and computed coefficients. Settings that are theoretically recommended for
telephone and microphone speech are compared with a large number of experimental results and a new
technique for determination of robust areas of {<# of band-pass filters>×<# of coefficients>} is designed.
1 INTRODUCTION
The state of the art parameterization techniques used
in ASR systems try to model the process of human
hearing. In speech processing terminology these
techniques are known as MFCC (Zheng and Song,
2001) and PLP parameterizations. It is well known
that both these techniques attempt to accommodate
the parameter estimation process to the way of
human hearing and how human perceive sounds
with various frequencies. However, one question
that we have to deal with is a selection of an
"optimal" number of critical band-pass filters and a
number of computed coefficients. In papers
published in many prestige world conferences we
usually find nearly always the same settings without
necessary analysis of the task conditions and
reference e.g. to the used sampling frequency of
speech signal (perhaps it is influenced by the default
setting the software tool HTK, which is frequently
used at many research labs). On the other hand, from
the relatively rich experience of building many ASR
systems we known that there isn't only one universal
setting which would yield for given "quality" of
speech signal the most successful results of
recognition experiments. Experimental results
however indicate that the best classification results
create in the space {<number of band-pass filters> ×
<number of coefficients>} certain areas in which the
successfulness is high and it doesn't change too
much (i.e. it doesn't dependent on the change of the
number of critical band-filters and the number of
coefficients). The goal of described works is to find
settings (i.e. the number of filters and derived
coefficients), which correspond to the best
recognition results and then for such solutions to
specify "areas of robust setting".
The whole work is done with the MFCC
parameterization and for speech data of telephone
(F
v
=8 kHz) and microphone (F
v
=44.1 kHz) quality.
2 MFCC BASED PROCESSING
The computational algorithm of the MFCC
parameterization is realized by the bank of
symmetric overlapping triangular filters spaced
linearly in a mel-frequency axis, according to
auditory perceptual considerations. The spacing as
well as bandwidth of the particular filters is
determined by a critical-band concept. To execute
this process we have to perform following steps:
•Computation of short-term speech spectrum.
•Non-linear frequency transformation and critical-
band spectral resolution – triangular band-pass
filters in a mel-frequency axis.
Table 1: Recommended numbers of filters for different
values of sampling frequency.
• Computation of cepstral coefficients.
• Applying an inverse discrete Fourier transform.
Sampling
frequency
F
v
[kHz]
Band
width
[kHz]
Band
width
[mell]
Number
of filters
M
8 0÷4 0÷2146 15
16 0÷8 0÷2840 20
44.1 0÷22 0÷3921 27
196
V. Psutka J., Šmídl L. and Pražák A. (2007).
SEARCHING FOR A ROBUST MFCC-BASED PARAMETERIZATION FOR ASR APPLICATION.
In Proceedings of the Second International Conference on Signal Processing and Multimedia Applications, pages 192-195
DOI: 10.5220/0002140401920195
Copyright
c
SciTePress

cul
c
ul
AA
,,Max,,
max
><><
=
,argmax
,,
Max
,
cul
c
ul
Ac
><
><
=
Max
UL
>< c,c
f
><
UL
c,c,f
A
For the final acoustic modelling we extended the
original MFCC representation with derived delta
and delta-delta features. See Table 1 for
recommended numbers of filters based on a
critical-band concept for different values of
sampling frequency.
3 SEARCHING FOR ROBUST
AREAS
We suggested following approach to the
determination of areas of robust parameter settings:
Searching for lower boundary of the number of
band-pass filters.
To find the lower boundary of a
robust area, i.e. left from the point of view a
minimum number of applied band-pass filters (see
Table 2 and 3), we chose such a statistic which
calculates for each number of band-pass filters the
average of the 5 best recognition results (
Acc)
obtained for different number of coefficients. Let us
define the recognition accuracy for
f band-pass
filters and
c coefficients as A
f,c
. Then to determine
the average value of the 5 best recognition results for
given number of band-pass filters we have to order
firstly results
A
f,c
according to the size, i.e. we define
A
f,[i]
, where A
f,[1]
≥ A
f,[2]
≥ .... and then we compute
desired statistic as
.
5
1
5
1
][,
5,
∑
=
=
i
if
f
AA
(1)
Now we find the maximum of for
f0< f
min
, f
max
>,
where
f
min
is minimum and f
max
maximum values of
the number of band-pass filters, for which
measurements were performed, i.e.
(2)
The lower boundary of the robust area (from the
point of view applied band-pass filters) we can
define so that we determine the first (for increasing
number of filters) value of the number of filters
f
Lbou ,
for which the value is greater or equal than 99%
of , so
.argmin
5,Max5,
99.0
5,
Lbou AA
f
f
f
Af
≥
=
(3)
Determining lower and upper boundaries of a
number of coefficients.
Considering that the
recognition results don’t vary too much for
increasing number of band-pass filters and a fixed
number of used coefficients it is possible to derive
the lower and upper boundary of robust area for the
whole set of recognition results. A detail analysis of
all results (in Table 2 and 3 we could show – owing
to limited space – the results of only a small segment
of nearly one thousand performed experiments)
indicates that the area of the “best” results shifts
slightly towards higher number of coefficients. For
that reason the robust area was looked for as the
interval <
f
l
, f
u
> = <f
Lbou
, f
Lbou+9
>; <f
Lbou+10
, f
Lbou+19
>;
A block of 10 band-pass filters was chosen so that
the resulting area might contain sufficient number of
measurements and calculated statistics could be
considered to be evidential (Freund,1998). For
individual values of a number of coefficients
c,
c0<c
min
, c
max
> (where c
min
and c
max
are respectively
values of minimum and maximum number of
coefficients for which measurements were
performed) we determined average values
Ā
<l,u>,c
(in
intervals <
f
l
, f
u
>)
(4)
Now we can define
Ā
<l,u>, Max
as
(5)
and then to determine the value of a number of
coefficients for which this maximum occurred
(6)
where
c0<c
min
, c
max
>. Now we can define the lower
c
L
<l,u>
and upper c
U
<l,u>
boundary of the robust
setting from the point of view a number of
coefficients. The desired interval was defined by the
values which don’t fall below 99% of
Ā
<l,u>,c
(7)
(8)
For this area we can define the value as the
number of filters for which attains its
maximum (i.e. its “optimum” or rather “reco-
mmended” value of a number of band-pass filters)
for <
f
l
, f
u
>. Now we can define
(9)
(10)
The area of robust setting. From the above
recommendations we can now determine the area of
robust setting of the number of band-pass filters and
coefficients as
robust area = (11)
The mean and deviation computed from recognition
results in this area give us a measure of quality for
given settings.
5,f
A
5,Max
A
5,f
A
>∈<=
><><
ul
ccf
f
cc
fffAA ,,max
ULUL
,,, Max,
>∈<=
><
><
ul
ccf
f
cc
fffAf ,,argmax
UL
UL
,,
Max
,Max,
.max
5,5,Max f
f
AA =
><∈
+−
=
∑
=
><
maxmin,
,,
,,
1
1
cccA
lu
A
u
li
ci
cul
,argmin
Max,,,,
99.0
,,
L
,
><><
≥
><
><
=
ulcul
AA
cul
c
ul
Ac
,argmax
Max,,,,
99.0
,,
U
,
><><
≥
><
><
=
ulcul
AA
cul
c
ul
Ac
},,{
U
,
L
,
><∈×><∈
><>< ululul
cccfff
SEARCHING FOR A ROBUST MFCC-BASED PARAMETERIZATION FOR ASR APPLICATION
197
5Max,
A
4 EXPERIMENTAL RESULTS
As was presented above, all experiments were
performed using speech data sets of two different
qualities: telephone and microphone. The
telephone-based corpus consists of Czech read
speech transmitted over a telephone channel. One
hundred speakers were asked to read various sets of
40 sentences. The
microphone-based corpus (high-
quality speech) is a read-speech database consisting
of speech of 100 speakers. Each speaker read a set of
40 sentences (same as in the telephone-based case).
The telephone and microphone test sets consisted of
100 sentences randomly selected from utterances of
100 different speakers who were not included in the
training databases. The vocabulary in all our test
tasks contained 528 different words. There were no
OOV words. The basic speech unit of our system is
a triphone. Each individual triphone is represented
by a three states HMM; each state has 8 mixtures of
multivariate Gaussians. In all recognition
experiments a language model based on zerograms
was applied. For that reason the perplexity of the
task was 528.
MFCC parameterization with telephone data
To find areas of robust settings we systematically
built and tested nearly one thousand ASR systems.
In fact it was for f0<8,45> and c0<4,30>.
Recognition results of these experiments are
summarized in Table 2 and depicted in Figure 1 (for
lack of space Table 2 shows only a part of these
results).
5
10
15
20
25
30
35
40
45
0
5
10
15
20
25
30
50
55
60
65
70
75
80
85
90
A
cc [%]
Number of
filters
Number of static
coefficients
Figure 1: MFCC telephone-quality data.
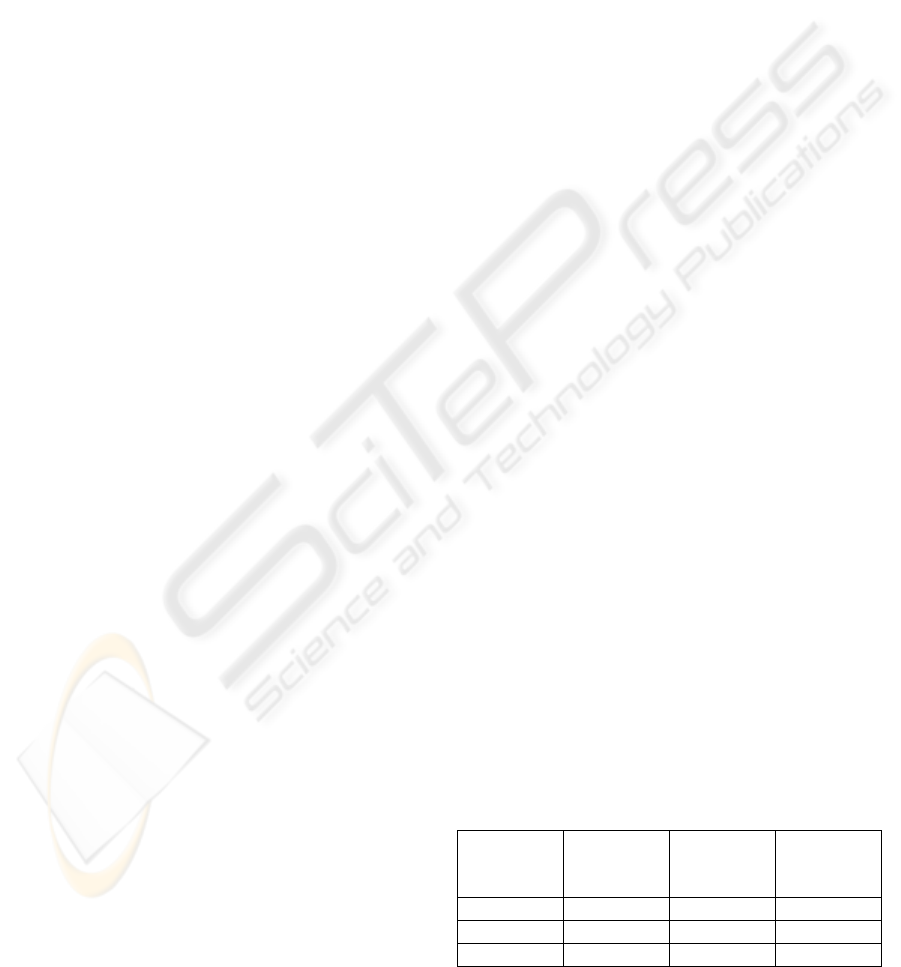
Figure 2 shows the dependency of the average of the
5 best results on the number of band-pass filters. The
frequency for which the
5,f
A exceeds 0.99
5Max,
A is
f
Lbou
=14. In Table 4 you can find all important
statistics needed to determine areas of robust
settings. It is evident that from the point of view the
number of band-pass filters the first area begins by
crossing boundary f
Lbou
. An increasing number of
applied band-pass filters above this boundary has
practically no influence to the recognition accuracy.
82
83
84
85
8 13 18 23 28 33 38 43
A
Max,5
N
umbe
r
of filters
A
f,5
[%]
0,99A
Max,5
Figure 2: Dependency of
5,f
A on the number of filters.
The robust area f0<12, 21>×c0<10,14> and the
recommended setting f =15 and c=12 are in a very
good agreement with theoretically derived value
(M=15) enumerated in Table 1. Also the default
HTK setting (i.e. 13 coefficients) can be considered
to be correct even though a smaller number
coefficients (c0<10, 14>) is also appropriate.
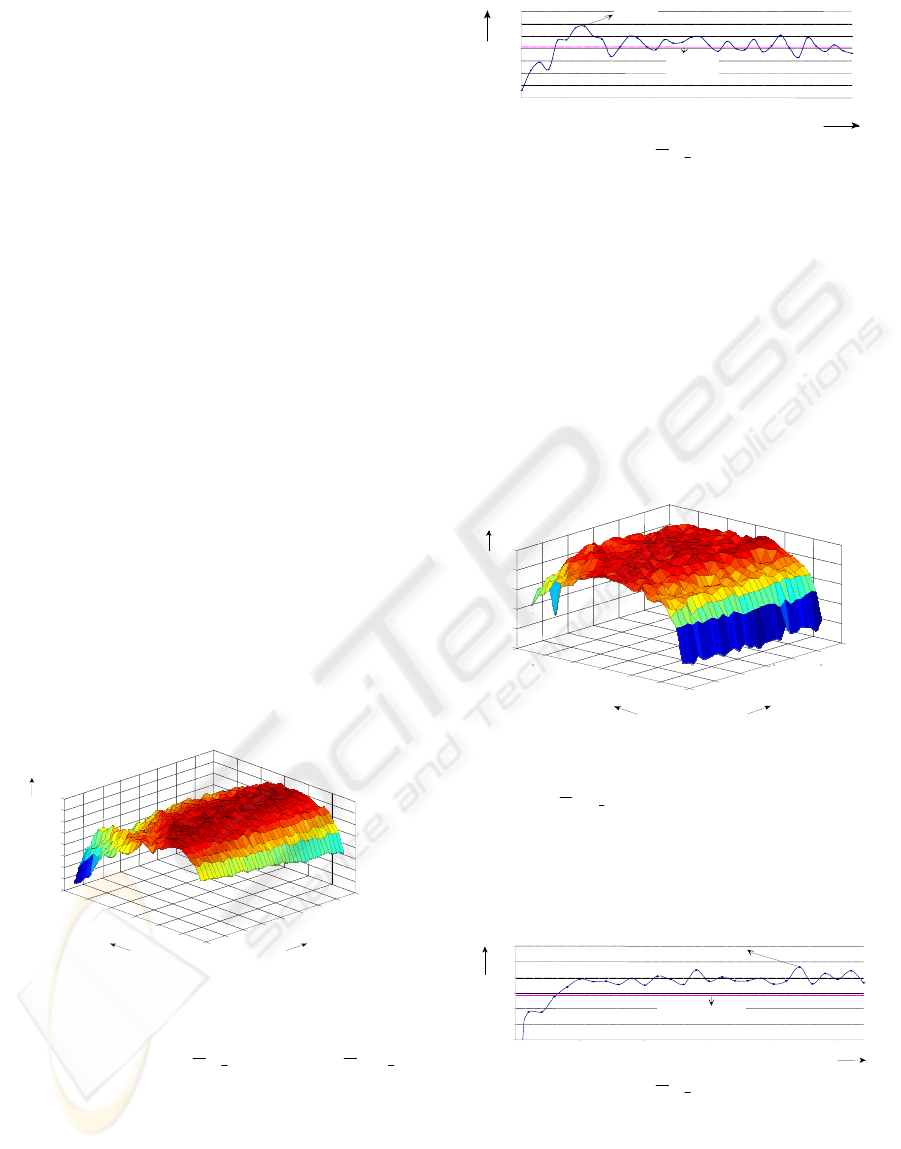
MFCC parameterization with microphone data
The area of robust setting for microphone data was
searched in fact for f0<18,45> and c0<4,30>.
Results of recognition experiments are summarized
in Table 3 and depicted in Figure 3.
N
umber of static
coefficients
Acc [%]
Number of
filters
15
20
25
30
35
40
45
0
5
10
15
20
25
30
70
75
80
85
90
95
Figure 3: MFCC microphone-quality data.
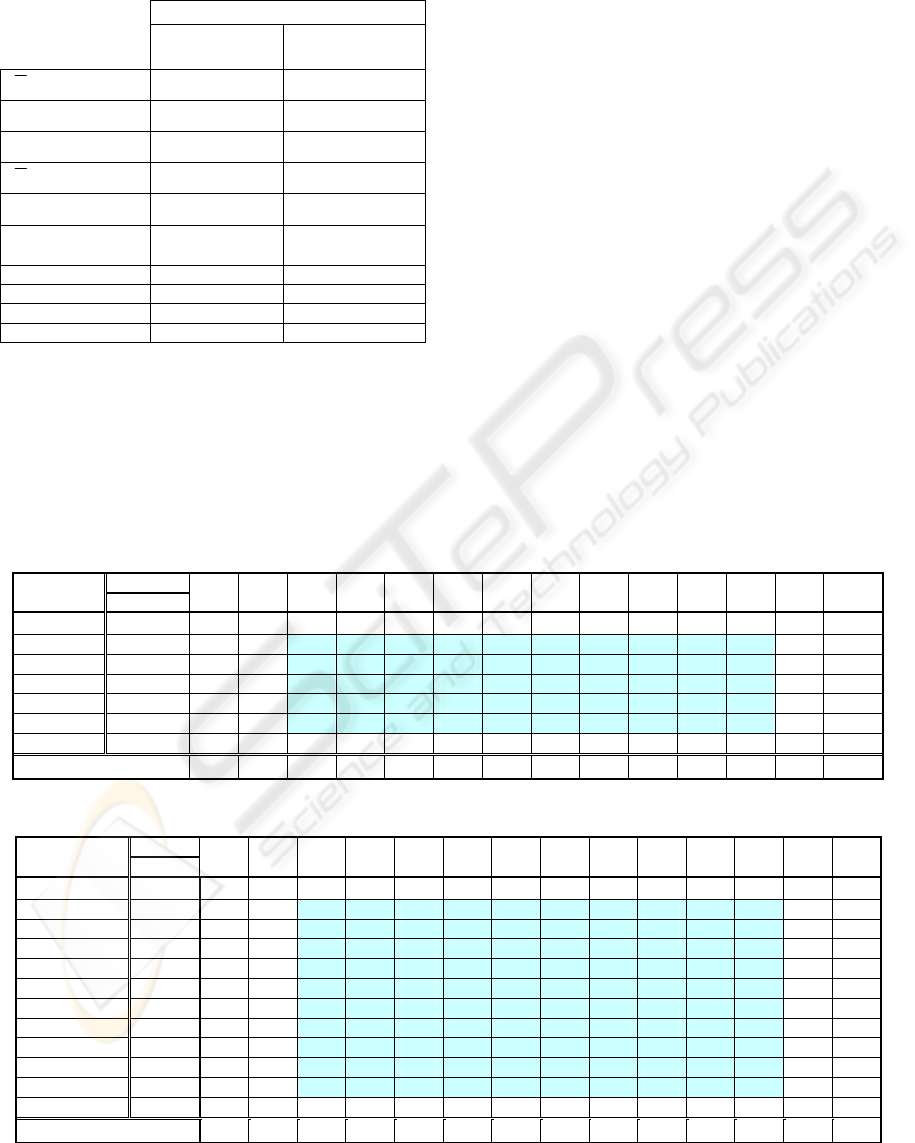
Figure 4 shows that for microphone speech the value
exceeds 0.99 for f
Lbou
=25. Similarly as in a case
of telephone speech the recognition accuracy
changes for increasing number of band-pass filters
only slightly. However the area of robust setting is
here broader, c0<14,23>.
N
umber of filters
A
f,5
[%]
88,0
89,0
90,0
91,0
18 23 28 33 38 43
0,99
A
Max,5
A
Max,5
Figure 4: Dependency of
5,f
A on the number of filters.
Let us note that this interval doesn’t contain the
HTK default setting, i.e. the value of 13 coefficients.
The robust area f0<22,31>×c0<14,23> and the
recommended setting f=29 and c=17 are again in a
relatively good agreement with theoretically derived
value (M=27) given in Table 1.The mean and
SIGMAP 2007 - International Conference on Signal Processing and Multimedia Applications
198
deviation computed from recognition results in this
area give us a measure of quality for given settings.
Table 4: Statistics for telephone/microphone data.
f 0 < f
l
, f
u
>
l=12, u=21
(telephone)
l=22, u=31
(microphone)
[%]
Max,u,l
A
><
84,60 89,73
Max
>< u,l
c
12 17
L
,
>< ul
c
/
U
,
>< ul
c
10 / 14 14 / 23
[%]
UL
Max, >< c,c
A
84,83 89,62
Max
UL
>< c
,
c
f
15 29
Robust area
f 0<12,21>×
× c 0<10, 14>
f 0<22,31>×
× c0<14,23>
Recomm. setting f =15; c=12 f =29; c=17
# of measures 50 100
Average of Acc 84,24 89,40
Deviation of Acc 0,76 0,53
5 CONCLUSIONS
The MFCC-based parameterization is a very
efficient tool for description of speech in ASR
systems. We showed that the theory of critical-bands
of hearing is both for telephone (F
v
=8kHz) and
microphone (F
v
=44.1kHz) speech data in a good
agreement with experimental results. Very useful
conclusions were obtained for the numbers of
"robust" coefficients for which the ASR system
demonstrates comparable recognition accuracy.
ACKNOWLEDGEMENTS
This paper was supported by the AVCR, project no.
1QS101470516 and the project of the EU 6
th
FP no.
IST-034434.
REFERENCES
Fang Zheng, Guoliang Zhang and Zhanjiang Song,
Comparison of Different Implementations of MFCC,
J. Computer Science & Technology, 16(6): Sept. 2001.
Freund, J.E., "Modern elementary statistics", Prentice-
Hall, Englewood Cliffs, New Jersey 07632, 1988.
Psutka, J., Müller, L., Psutka, J.V., "Comparison of MFCC
and PLP Parameterization in the Speaker Independent
Continuous Speech Recognition Task",
EUROSPEECH'2001, Aalborg, 2001.
Table 2: Recognition accuracy for various numbers of filters and parameters for telephone data.
# filters
Average for
f
0<12
,
21>
# coeff.
10 11 12 13 14 15 16 17 18 19 20 21 22 23
83,12
9
83,98 82,95 83,76 83,10 83,76 83,25 83,32 82,88 82,81 82,95 81,93 83,39 82,15 82,07
84,01
10
84
,
13 83
,
47 85
,
67 84
,
50 84
,
86 83
,
91 83
,
10 85
,
01 83
,
84 83
,
10 83
,
54 83
,
32 82
,
81 82
,
51
84,25
11
83
,
84 83
,
61 84
,
42 84
,
13 84
,
42 84
,
20 84
,
42 84
,
86 83
,
76 83
,
91 84
,
20 84
,
20 84
,
28 83
,
61
84,60
12
83
,
17 83
,
10 83
,
32 84
,
79 84
,
42 85
,
75 84
,
35 84
,
28 85
,
16 85
,
01 84
,
86 84
,
06 82
,
95 83
,
47
84,47
13
81
,
78 82
,
22 85
,
82 83
,
91 85
,
08 85
,
45 84
,
72 83
,
98 82
,
88 83
,
47 84
,
57 85
,
30 84
,
42 84
,
42
83,86
14
79
,
50 81
,
63 81
,
85 84
,
42 84
,
64 84
,
86 83
,
91 83
,
54 82
,
59 83
,
84 84
,
35 84
,
64 84
,
28 83
,
54
83,46
15
80
,
53 80
,
68 81
,
78 81
,
56 85
,
16 84
,
57 83
,
32 83
,
69 82
,
22 83
,
84 84
,
50 83
,
91 83
,
76 84
,
72
Average of the 5 83,45 83,16 84,34 84,35 84,83 84,91 84,50 84,38 83,69 84,07 84,50 84,42 84,07 83,95
Table 3: Recognition accuracy for various numbers of filters and parameters for microphone data.
# filters
Average for
f
0<22
,
31>
# coeff.
20 21 22 23 24 25 26 27 28 29 30 31 32 33
88,62
13
87,51 89,29 88,15 86,72 87,08 87,79 88,51 89,94 89,65 89,65 89,36 89,36 89,65 89,22
89,34
14
88
,
72 88
,
87 88
,
87 88
,
65 89
,
44 90
,
01 89
,
08 89
,
51 89
,
58 89
,
44 89
,
42 89
,
44 89
,
52 89
,
44
89,36
15
89
,
01 88
,
94 89
,
29 88
,
08 89
,
01 89
,
44 89
,
51 90
,
22 89
,
36 89
,
22 89
,
65 89
,
86 89
,
51 89
,
72
89,60
16
88
,
94 89
,
72 89
,
72 90
,
15 89
,
65 89
,
08 89
,
36 89
,
51 89
,
36 89
,
35 90
,
01 89
,
79 90
,
22 89
,
51
89,73
17
88
,
87 89
,
22 90
,
08 89
,
58 89
,
44 90
,
01 89
,
58 89
,
94 89
,
58 89
,
88 89
,
36 89
,
86 90
,
29 89
,
62
89,67
18
88
,
15 89
,
08 89
,
02 89
,
68 89
,
36 89
,
31 89
,
44 89
,
88 89
,
58 90
,
51 89
,
94 89
,
94 89
,
51 89
,
72
89,58
19
88
,
65 88
,
87 90
,
08 89
,
36 89
,
58 89
,
36 88
,
87 89
,
41 89
,
86 90
,
01 89
,
94 89
,
36 90
,
36 89
,
51
89,43
20
88
,
72 89
,
65 89
,
29 90
,
08 88
,
87 90
,
29 89
,
86 89
,
44 89
,
01 88
,
29 90
,
08 89
,
08 89
,
79 90
,
22
89,39
21
88
,
94 89
,
58 89
,
15 88
,
94 88
,
87 89
,
65 89
,
22 89
,
35 90
,
15 90
,
01 89
,
35 89
,
22 90
,
08 89
,
58
89,19
22
87
,
51 86
,
37 88
,
44 89
,
72 89
,
22 89
,
58 89
,
51 88
,
72 89
,
22 89
,
79 88
,
94 88
,
79 90
,
22 89
,
36
89,40
23
87
,
08 86
,
80 87
,
22 89
,
86 91
,
22 89
,
22 89
,
79 88
,
87 89
,
94 89
,
72 88
,
94 89
,
22 88
,
94 90
,
01
88,78
24
85
,
94 87
,
15 86
,
94 89
,
94 88
,
37 88
,
65 89
,
79 88
,
72 89
,
29 89
,
22 88
,
65 88
,
22 88
,
51 89
,
72
Average of the 5 best
88
,
9 89
,
39 89
,
69 89
,
95 89
,
87 89
,
88 89
,
78 89
,
97 89
,
75 90
,
04 89
,
94 89
,
78 90
,
23 89
,
88
SEARCHING FOR A ROBUST MFCC-BASED PARAMETERIZATION FOR ASR APPLICATION
199
