
UNSUPERVISED NON PARAMETRIC DATA CLUSTERING BY
MEANS OF BAYESIAN INFERENCE AND INFORMATION THEORY
Gilles Bougeni
`
ere, Claude Cariou, Kacem Chehdi
TSI2M Laboratory, University of Rennes 1 / ENSSAT, 6 rue de Kerampont, 22300 Lannion, France
Alan Gay
Institute of Grassland and Environmental Research (IGER), Plas Gogerddan, Aberystwyth, Ceredigion, SY23 3EB, UK
Keywords:
Clustering, Classification, Bayesian method, Maximum A Posteriori, Information theory, Remote sensing,
Multispectral images.
Abstract:
In this communication, we propose a novel approach to perform the unsupervised and non parametric cluster-
ing of n-D data upon a Bayesian framework. The iterative approach developed is derived from the Classifica-
tion Expectation-Maximization (CEM) algorithm, in which the parametric modelling of the mixture density
is replaced by a non parametric modelling using local kernels, and the posterior probabilities account for the
coherence of current clusters through the measure of class-conditional entropies. Applications of this method
to synthetic and real data including multispectral images are presented. The classification issues are compared
with other recent unsupervised approaches, and we show that our method reaches a more reliable estimation
of the number of clusters while providing slightly better rates of correct classification in average.
1 INTRODUCTION
Merging objects having similar characteristics is a
very important problem in various contrasting re-
search fields such as medicine, genetics, chemistry,
computer vision, etc. Despite several decades of re-
search in this area, the task is still difficult because of
the continual improvement of the technology and the
increase of the size of the data to be analyzed. With-
out any prior information, the grouping of objects has
to be done in an unsupervised way. This processing
is called clustering, in contrast to the classification
which is the grouping of samples in a supervised way.
The different groups are then called clusters, and they
are formed of the closest individuals, according to a
similarity measure. In the particular case of clustering
of multispectral images, the individuals are the pixels
which are grouped on their spectral information char-
acteristics. To help the clustering of image pixels, one
can also use the spatial information and the fact that
two neighboring pixels are more likely to belong to
the same cluster (Cariou et al., 2005).
Clustering methods can be distinguished by the
similarity function used to realize the clustering (Tran
et al., 2005). The similarity functions fall in two cat-
egories: the deterministic similarity functions and the
probabilistic similarity functions.
In the deterministic case, a distance function is of-
ten used. This is the case of the well known k-means
algorithm (MacQueen, 1967) which associates each
object with the cluster label for which the correspond-
ing representative object (typically the centroid of the
objects in that cluster) is the closest according to the
distance function used. At each iteration the centroid
is computed again. This algorithm is very simple and
has been improved since its initial development until
recently (Huang and Ng, 2005; Laszlo and Mukher-
jee, 2006). For instance, a modified version which can
automatically associate a weight to each feature dur-
ing the clustering process has been developed, leading
to a more accurate result (Huang and Ng, 2005). Ge-
netic algorithms have also been proposed as a reliable
approach of determining centers of clusters (Laszlo
and Mukherjee, 2006).
The k-means algorithm provides a hard partition-
ing of the individuals which involves a lack of pre-
cision, particularly in case of overlapping between
clusters. The fuzzy c-means (FCM) algorithm (Dunn,
1973; Bezdek, 1981) is the fuzzy equivalent of the
k-means algorithm. Each object is potentially asso-
101
Bougenière G., Cariou C., Chehdi K. and Gay A. (2007).
UNSUPERVISED NON PARAMETRIC DATA CLUSTERING BY MEANS OF BAYESIAN INFERENCE AND INFORMATION THEORY.
In Proceedings of the Second International Conference on Signal Processing and Multimedia Applications, pages 101-108
DOI: 10.5220/0002141301010108
Copyright
c
SciTePress

ciated to different clusters, the degree of membership
to each cluster being determined according to the dis-
tance function. This algorithm is known to yield bet-
ter results than the k-means algorithm in most cases.
The FCM-GK algorithm (Gustafson and Kessel, 1979)
uses an adaptive distance and thus it can more effi-
ciently fit the different cluster sizes and shapes.
In the probabilistic case, one makes use of the
Bayesian paradigm, which in most cases requires a
parametric modelling of class-conditional probability
density functions (pdf). A parametric modelling of
class-conditional pdfs is often difficult to obtain be-
cause of some non trivial cluster shapes which can
occur as in multispectral and hyperspectral image pro-
cessing. It is the case of the mixture modelling meth-
ods based on a statistical approach. Each cluster is
modelled by a multivariate distribution f with param-
eters θ
c
and the dataset is described by a linear com-
bination of those conditional distributions. A max-
imization of the likelihood is often used to find the
best parameters of each cluster. This maximization is
often performed by using the iterative EM algorithm
(Dempster et al., 1977). However the SEM algorithm,
which is a stochastic version of the EM algorithm, can
avoid some drawbacks of the EM algorithm such as its
slow convergence (Celeux and Diebolt, 1987). Using
one of these parameters estimation methods, a classi-
fication can be obtained for instance by associating to
each individual the class label with the highest poste-
rior probability.
In order to avoid the use of parametric (e.g. Gaus-
sian) conditional distributions, a recent approach us-
ing a Fourier-based description of those distributions
has been proposed (Zribi and Ghorbel, 2003). This
approach guarantees that the conditional distributions
are smooth enough to correctly model the variability
of each cluster without any parametric modeling as-
sumption, despite the fact that ”negative” probabili-
ties may artificially occur in the course of the itera-
tions.
Another approach to clustering is density-based
clustering. Its principle is to estimate the conditional
densities using the data samples. The high density
areas are characteristic of a cluster whereas the low
density areas correspond to the boundaries. A density
threshold and a volume are necessary to compute the
local densities, and then the number of clusters fol-
lows automatically. However, density based cluster-
ing methods often have difficulty to handling high di-
mensional data because of the very odd-shaped clus-
ter densities. In (Tran et al., 2006), a new algorithm
named KNNClust dealing with this problem is pre-
sented.
We present in this paper a new clustering algo-
rithm, based on the SEM algorithm called the Non
Parametric SEM algorithm (NPSEM). It is a non para-
metric and unsupervised clustering algorithm which
has the ability to estimate the number of clusters dur-
ing the clustering process. The originality of the work
is in the extension of the SEM algorithm to the es-
timation of non parametric conditional distributions
and the weighting of the posterior probabilities by a
coherence function which is based on the conditional
entropy of each cluster. It allows to regularize the es-
timation and to stabilize the decision step result.
The second section is devoted to the presentation
of our algorithm and its links to and inspirations from
the SEM and the k-means algorithm. In the third sec-
tion we present some results on different datasets.
Comparisons with other state of the art algorithms are
also given. Finally, a conclusion is given in the fourth
section.
2 PROPOSED CLUSTERING
METHOD
In this section we present the NPSEM clustering
method and show its similarities with the k-means and
SEM algorithms.
The SEM algorithm, as for the algorithm EM from
which it rises, aims to maximize, in an iterative way,
the likelihood of a parametric model when this model
depends on incomplete data. In the case of a mixture
density, the goal of the EM and SEM algorithms is to
estimate the mixture parameters of K distributions:
f(X) =
K
∑
k=1
f(X|θ
k
)p
k
, (1)
where { f(X|θ
k
)},k = 1. ..K are the conditional dis-
tributions of parameters θ
k
and p
k
are the clusters
prior probabilities. Although this algorithm is ba-
sically dedicated to parameter estimation, its use in
classification is also possible, in particular via the
Classification EM algorithm (CEM) (Celeux and Go-
vaert, 1992; Masson and Pieczynski, 1993). The dif-
ference between the algorithms EM and SEM comes
from the introduction into the latter of a stochastic
step aiming to produce a current partition of the data
(pseudo-sample), at each iteration, using a random
sampling according to the posterior distribution com-
puted thanks to the current parameter estimates. The
CEM algorithm was recognized as a generalization of
the k-means algorithm (Same et al., 2005). The SEM
is also close to it, and particularly at two points: (i) the
maximization step is mostly very similar, and consists
of parameter estimation of the clusters formed; (ii) the
SIGMAP 2007 - International Conference on Signal Processing and Multimedia Applications
102

construction of a posterior pseudo-sample is carried
out by updating the estimated parameters. However,
the major difference between the two approaches is
in the purely deterministic feature of the k-means and
CEM algorithms: at each iteration, the label of an in-
dividual is given according to a decision criterion of
minimal distance to the current cluster representative
in the case of the k-means, or according to the MAP
criterion for the CEM. This deterministic aspect has a
major disadvantage, namely the convergence to a lo-
cal likelihood maximum, whereas the SEM algorithm
makes it possible to avoid this problem. In order to
carry out a compromise between the SEM and CEM
approaches, we first propose to re-examine the E (Es-
timation) step of the SEM algorithm, by computing
membership posterior pseudo-probabilities of the in-
dividuals x
m
,1 ≤ m ≤ M to each cluster k in the fol-
lowing way:
p
α
(C = k|X = x
m
) =
[p
k
f(X = x
m
|θ
k
)]
α
∑
K
k=1
[p
k
f(X = x
m
|θ
k
)]
α
(2)
where C is the (random) cluster label of an individ-
ual, α ∈ [1,+∞[ is a parameter controlling the de-
gree of determinism in the construction of the pseudo-
sample: α = 1 corresponds to the SEM (stochastic) al-
gorithm, while α → +∞ corresponds to the CEM (de-
terministic) algorithm.
In the above form, the algorithm only allows the
use of parameterized conditional distributions (for ex-
ample normal distributions), which can sometimes be
insufficient to manage complex shaped clusters, as for
instance in multispectral imagery. Consequently, we
have taken into account this constraint by replacing
at each iteration the parameterized conditional distri-
butions in (2) by non parametric conditional distribu-
tions f(X|C), estimated from the pseudo-sample by
the use of a Gaussian isotropic kernel g
γ
(x) with aper-
ture γ. This aperture can be fixed automatically with
respect to the dimensionality of the data, as soon as it
is centered and reduced. The joint distribution, esti-
mated by:
f(X = x
m
,C = k) =
∑
M
l=1
g
γ
(x
l
− x
m
) 1
C(m)=k
∑
M
m=1
∑
M
l=1
g
γ
(x
l
− x
m
)
, (3)
∀ 1 ≤ k ≤ K, ∀ 1 ≤ m ≤ M
where C(m) represents cluster label affected to the in-
dividual with index m in the current iteration, makes
it possible to estimate the prior probabilities p
k
and
the conditional distributions f(X = x
m
|C = k). Those
conditional distributions cannot be directly used in the
above algorithm because the mixture distribution is no
longer identifiable. We then propose a further modi-
fication of the posterior distribution computation by
introducing a regularizing heuristic as follows:
p
α
(C = k|X = x
m
) =
h
p
k
f(X = x
m
|C = k) e
−H(X|k)
i
α
∑
K
k=1
p
k
f(X = x
m
|C = k) e
−H(X|k)
α
, (4)
where H(X|k) measures the conditional entropy of
the current k-th cluster. Its effect on the posterior
probabilities is as follows: a low entropy conditional
distribution will support the membership of an indi-
vidual x
m
to the corresponding cluster if this individ-
ual strongly contributes to the coherence of this clus-
ter. This heuristic thus tends to agglomerate the indi-
viduals according to coherent and low entropy clus-
ters (and conditional distributions). Finally, the clus-
tering itself is carried out by using the MAP criterion,
i.e. one chooses for each individual m the cluster k
which maximizes Equation (4).
An important consequence of the proposed algo-
rithm is to allow the estimation of the number of clus-
ters. Indeed, starting from an upper bound of the num-
ber of clusters, the algorithm reduces the number of
clusters as soon as a cluster proportion is lower than
a previously specified threshold of representativeness.
In this case, the individuals which belong to the clus-
ter which disappears are redistributed into the remain-
ing clusters.
3 EXPERIMENTS AND RESULTS
In this section, we evaluate the efficiency of NPSEM
on the following three real datasets for which a
ground truth is available: (1) Fisher’s iris dataset (150
individuals with 4 variables partitioned in 3 classes)
(Fisher, 1936); (2) The wine dataset, composed of
178 individuals of 3 types (clusters) and 13 variables
per individual (Aeberhard et al., 1992); (3) the Morfa
dataset is a portion of a CASI hyperspectral image,
composed of 747 pixels with 48 spectral radiance
measurements each (equally spaced from 405nm to
947nm). This dataset was acquired in 2006 by the
IGER (Institute of Grassland and Environmental Re-
search) in Morfa Mawr, Wales, UK, during the survey
of a barley crop field containing two different species
which are infected or not by the mildew (4 classes). In
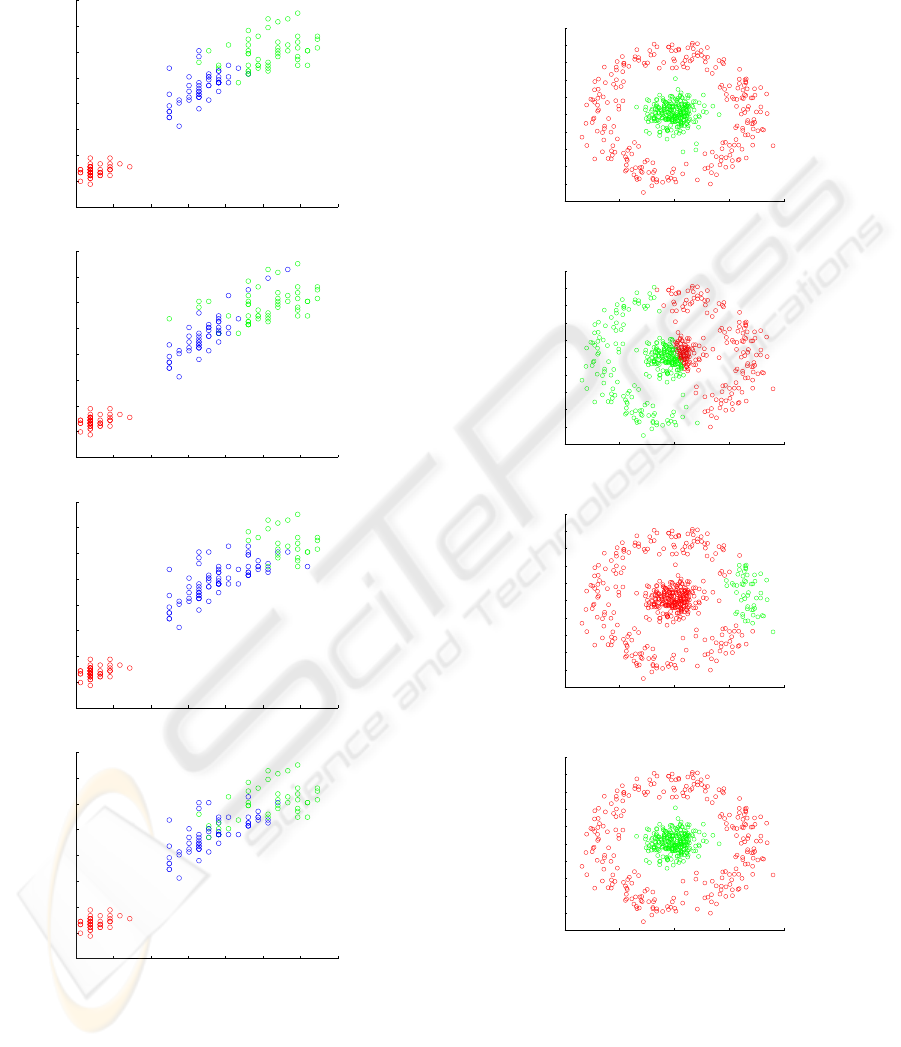
addition we have used an additional synthetic dataset
used to assess our algorithm on non Gaussian data.
This 2D dataset is composed by two classes as shown
by the ground truth in Figure 5-a.
Comparisons have been carried out with some
other partitioning algorithms from the state of the art:
k-means, FCM, FCM-GK, EM-GM, witch is a clus-
tering algorithm based upon a Gaussian Mixture ob-
UNSUPERVISED NON PARAMETRIC DATA CLUSTERING BY MEANS OF BAYESIAN INFERENCE AND
INFORMATION THEORY
103
tained thanks to the EM algorithm, and the KNNClust,
a non parametric, non supervised version of the KNN
(k nearest neighbors) algorithm which can also es-
timate the number of clusters. This algorithm also
shares with the NPSEM the property that it is not de-
terministic, i.e. it can provide a different clustering
result at each run. The ground truth is available for
each dataset which makes it possible to compute the
correct classification rate obtained by the different al-
gorithms in our experiments.
For the wine and Morfa datasets, the clustering
has been performed after a data reduction consisting
of keeping the first three components resulting from
the principal component analysis (PCA).
A correct classification rate is computed, as well
as the κ index which is a classification rate weighted
to compensate the effect of chance on the clustering
results. The κ index is computed as follows :
κ = (P
o
− P
e
)/(1− P
e
) (5)
where P
o
is the correct classification rate and
P
e
=
1
M
2
∑
K
k=1
n
clust
k
∑
K
k=1
n
truth
k
with n
clust
k
the number of individuals associated to
cluster k during the clustering process and n
truth
k
the
number of samples that are in cluster k according to
the ground truth. K is the number of clusters and M
the number of individuals to cluster.
Table 1: Correct classification rates (in %) obtained by the
clustering algorithms on the different datasets and their av-
erage.
Synth Wine Iris Morfa avg.
k-means 62.3 88.9 78.0 64.3 73.4
EM-GM 61 92.7 94 72.6 80.1
FCM 57 97.1 88.0 73.8 79.0
FCM-GK 57.4 95.5 91.3 75.9 80.0
KNNClust 61.4 95.5 83.3 73.0 78.3
NPSEM 99.4 95.4 83.0 73.9 87.9
Table 2: Kappa index of agreement (in %).
Synth Wine Iris Morfa avg.
k-means 24.6 83.6 66.0 52.4 56.6
EM-GM 21 88.9 91.3 63.5 66.2
FCM 13.9 95.8 82.0 65.1 64.2
FCM-GK 14.7 93.3 87.0 67.9 65.7
KNNClust 22.3 91.3 75.0 63.9 63.1
NPSEM 98.8 93.1 76.9 65.2 83.5
For the KNNClust algorithm, different values for
the number of nearest neighbors have been tried.
Also, in all experiments with the NPSEM algorithm,
(a) ground truth
(b) FCM-GK
(c) KNNClust
(d) NPSEM
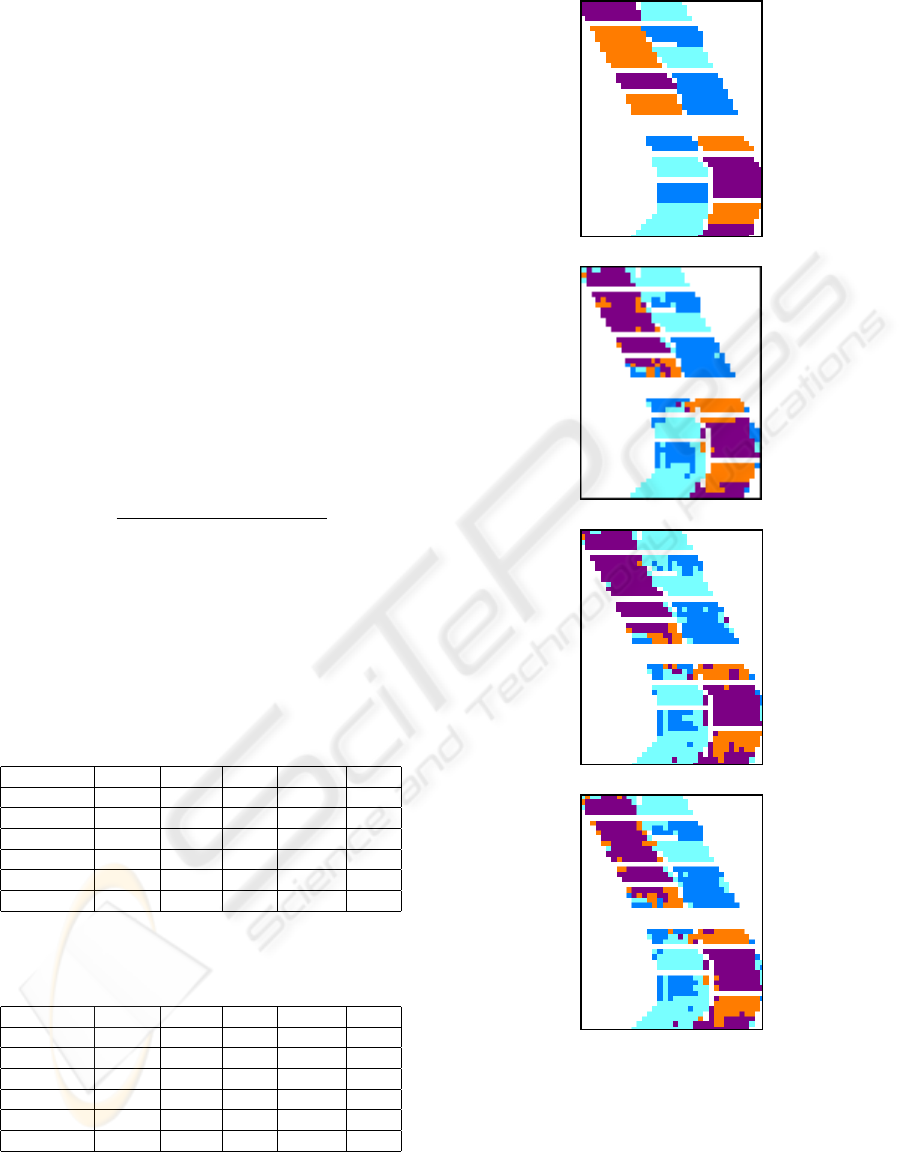
Figure 1: Ground truth of Morfa hyperspectral image (48
bands, 4 classes) and clustering results by the FCM-GK, the
KNNClust and the NPSEM algorithm.
the upper bound for the number of clusters was fixed
to
¯
K = 5, the Gaussian kernel aperture in Eq. (3)
to γ = 0.2 and the pseudo-probabilities reinforcement
coefficient in Eq. (4) to α = 1.2 . For each algo-
SIGMAP 2007 - International Conference on Signal Processing and Multimedia Applications
104

Table 3: Rate of correct estimation (in %) of the number of
clusters for fully unsupervised methods.
Wine Iris Morfa average
KNNClust 95 45 65 68.3
NPSEM 100 80 80 86.7
rithm, only the best results have been kept. To com-
pute the correct classification rate for the KNNClust
and the NPSEM algorithms, which both can estimate
the number of clusters, we have taken into account
the only results where the correct number of clusters
has been found. The correct classification rates are
shown in Table 1, and the κ index results are given
in Table 2. Table 3 shows the behavior of those two
algorithms regarding the estimation of the number of
clusters. For the other algorithms, the correct number
of clusters K was given a priori.
The overall correct classification and kappa rates
show better results for the NPSEM algorithm. More
precisely we can see that the results obtained on real
datasets are equivalent to the GK version of the FCM,
the KNNClust and the NPSEM with a little advantage
to FCM-GK. But on our synthetic dataset all the algo-
rithms have failed to recover the two clusters, except
our NPSEM algorithm.
Moreover, as is shown in Table 3, the NPSEM
gives more reliable estimates of the number of clus-
ters than the KNNClust. This reliability is also con-
firmed in the iris dataset, where the correct number of
clusters has been obtained in 80% of the experiments
for the NPSEM against only 45% for the KNNClust,
both reaching nearly the same correct classification
rate when the correct number of clusters was found.
Moreover, the overall κ index is slightly better for
the NPSEM method compared to the KNNClust method
which reveals a better agreement of the classification
with the ground truth.
Figure 1 shows typical classification results given
by the FCM-GK, NPSEM and KNNClust on the Morfa
dataset. On this example, the correct classification
rate is 75.9% for the FCM-GK, 73.9% for the NPSEM
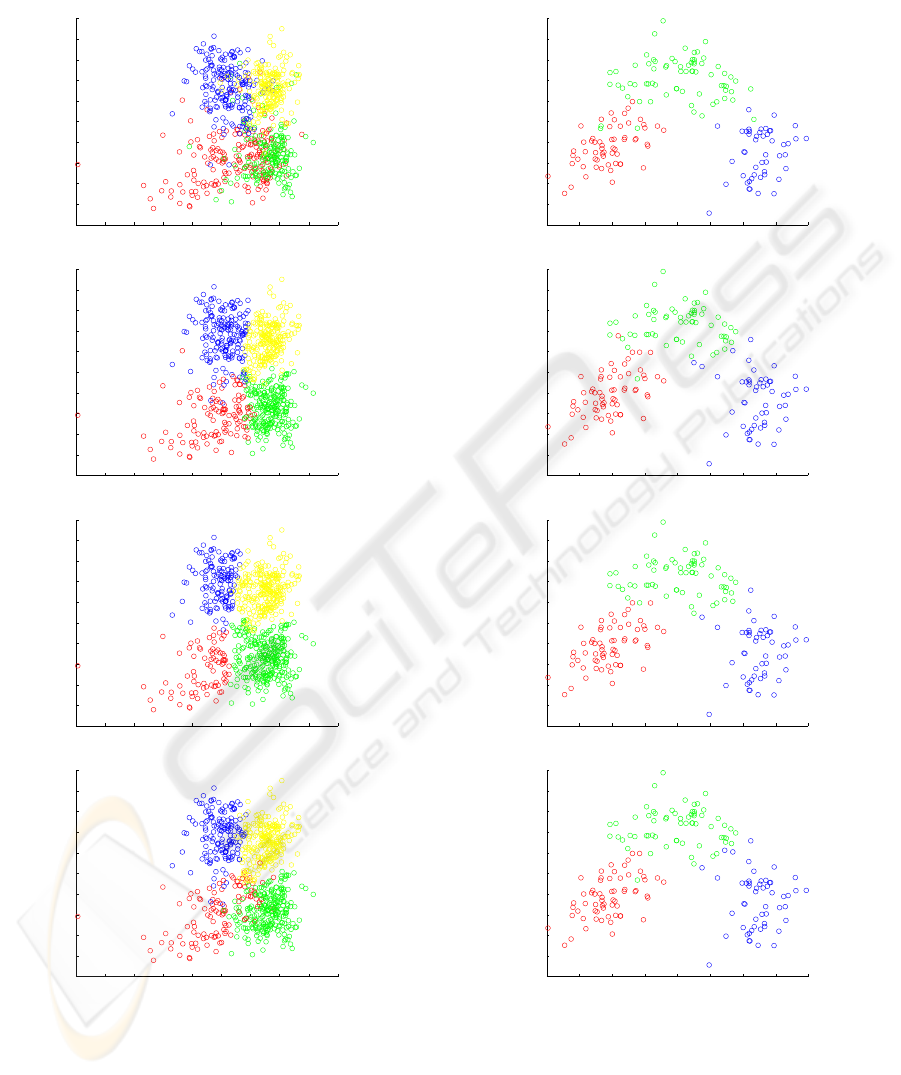
and 73% for the KNNClust. Figure 2 depicts the same
clustering results in the feature space, through a pro-
jection onto the first two principal axis resulting from
the PCA of the Morfa dataset. Figure 3 shows the
ground truth and clustering results which were ob-
tained for the wine dataset, Figure 4 the ground truth
and clustering results obtained for the iris dataset and
Figure 5 the ground truth and clustering results ob-
tained for our synthetic dataset.
4 CONCLUSION
In this communication, we have described the be-
haviour of a new clustering algorithm, the Non-
Parametric Stochastic Expectation Maximisation
(NPSEM) algorithm. This algorithm, inspired from
the SEM algorithm and based on the use of a kernel
function and an entropy based weighting, has the ad-
vantage to deal with non parametric conditional pdfs.
This enables the algorithm to best fit different shapes
of cluster. This feature is very important in the case
of multispectral image clustering where the shape of
clusters may be very different. Our algorithm can also
estimate the number of clusters during the clustering
process. The only parameter which is needed is an
upper bound estimate of the number of clusters.
We have tested this algorithm on three different
datasets, and we have compared the results with five
other clustering algorithms. four of them were clas-
sical algorithms (k-means, EM-GM, FCM, FCM-GK)
which are well known for their efficiency and/or sim-
plicity. Their main drawback is that they are not fully
unsupervised in the sense that the number of clusters
must be given. The fifth one is the KNNClust algo-
rithm which can also estimate the number of clusters
automatically. This method also requires one param-
eter, i.e. the number of neighbors which most of the
time is not easier to determine than the number of
clusters.
The results of our first experiments are promising:
NPSEM has shown to be more efficient in terms of
estimation of the number of clusters while giving in
average better classification rates than other compara-
ble approaches on datasets with clusters of different
shapes.
In further works, we plan to consider especially
the case of multispectral and hyperspectral image seg-
mentation by adding spatial information to the spec-
tral information for each pixel. By doing so, we hope
to be able to improve the clustering results, whilst
keeping the advantage of reliable estimation of num-
bers of clusters.
ACKNOWLEDGEMENTS
This work is supported by the European Union and
co-financed by the ERDF and the Regional Council of
Brittany through the Interreg3B project number 190
PIMHAI.
UNSUPERVISED NON PARAMETRIC DATA CLUSTERING BY MEANS OF BAYESIAN INFERENCE AND
INFORMATION THEORY
105

REFERENCES
Aeberhard, S., Coomans, D., and deVel, O. (1992). The
classification performance of RDA. Technical report,
92-01, Dept. of Computer Science and Dept. of Math-
ematics and Statistics, James Cook University, North
Queensland, Australia.
Bezdek, J. (1981). Pattern Recognition With Fuzzy Objec-
tive Function Algorithms. Plenum Press, New York.
Cariou, C., Chehdi, K., and Nagle, A. (2005). Gravita-
tional transform for data clustering - application to
multicomponent image classification. In Proc. IEEE
ICASSP 2005, volume 2, pages 105–108, Philadel-
phia, USA.
Celeux, G. and Diebolt, J. (1987). A probabilistic teacher
algorithm for iterative maximum likelihood estima-
tion. In Classification and Related Methods of
Data Analysis, pages 617–623. Amsterdam: Elsevier,
North-Holland.
Celeux, G. and Govaert, G. (1992). A classification EM
algorithm for clustering and two stochastic versions.
In Computational Statistics and Data Analysis, num-
ber 3, pages 315–332.
Dempster, A., Laird, N., and Rubin, D. (1977). Maximum
Likelihood from Incomplete Data via the EM Algo-
rithm. Journal of the Royal Statistical Society. Series
B (Methodological), 39(1):1–38.
Dunn, J. (1973). A fuzzy relative of the ISODATA process
and its use in detecting compact well-separated clus-
ters. Journal of Cybernetics, 3(3):32–57.
Fisher, R. (1936). The use of multiple measurements in
taxonomic problems. Annals of Eugenics, 7(2):179–
188.
Gustafson, D. and Kessel, W. (1979). Fuzzy clustering with
a covariance matrix. IEEE Conference on Decision
and Control, pages 761–766.
Huang, J. and Ng, M. (2005). Automated variable weight-
ing in k-means type clustering. IEEE Transac-
tions on Pattern Analysis and Machine Intelligence,
27(5):657–668.
Laszlo, M. and Mukherjee, S. (2006). A genetic algorithm
using hyper-quadtrees for low-dimensional k-means
clustering. IEEE Transactions on Pattern Analysis
and Machine Intelligence, 28(4):533–543.
MacQueen, J. (1967). Some methods for classification and
analysis of multivariate observations. Proceedings of
the Fifth Berkeley Symposium on Mathematical Statis-
tics and Probability, 1:281–297.
Masson, P. and Pieczynski, W. (1993). SEM algorithm and
unsupervised statistical segmentation of satellite im-
ages. IEEE Transactions on Geoscience and Remote
Sensing, 31(3):618–633.
Same, A., Govaert, G., and Ambroise, C. (2005). A mix-
ture model-based on-line cem algorithm. In Advances
in Intelligent Data Analysis, 6th International Sym-
posium on Data Analysis, IDA 2005, 8-10 Oct. 2005,
Madrid, Spain.
Tran, T., Wehrens, R., and Buydens, L. (2005). Clustering
multispectral images: a tutorial. Chemometrics and
Intelligent Laboratory Systems, 77:1–2.
Tran, T., Wehrens, R., and Buydens, L. (2006). KNN-kernel
density-based clustering for high-dimensional multi-
variate data. Computational Statistics and Data Anal-
ysis, 51:513–525.
Zribi, M. and Ghorbel, F. (2003). An unsupervised and
non-parametric bayesian classifier. Pattern Recogni-
tion Letters, 24(1):97 – 112.
SIGMAP 2007 - International Conference on Signal Processing and Multimedia Applications
106
−6 −5 −4 −3 −2 −1 0 1 2 3
−2.5
−2
−1.5
−1
−0.5
0
0.5
1
1.5
2
2.5
(a) ground truth
−6 −5 −4 −3 −2 −1 0 1 2 3
−2.5
−2
−1.5
−1
−0.5
0
0.5
1
1.5
2
2.5
(b) FCM-GK
−6 −5 −4 −3 −2 −1 0 1 2 3
−2.5
−2
−1.5
−1
−0.5
0
0.5
1
1.5
2
2.5
(c) KNNClust
−6 −5 −4 −3 −2 −1 0 1 2 3
−2.5
−2
−1.5
−1
−0.5
0
0.5
1
1.5
2
2.5
(d) NPSEM
Figure 2: Ground truth and clustering results on Morfa
dataset after selection of the first three principal compo-
nents. The data is projected onto the first two principal axis.
−2 −1.5 −1 −0.5 0 0.5 1 1.5 2
−2.5
−2
−1.5
−1
−0.5
0
0.5
1
1.5
2
2.5
(a) ground truth
−2 −1.5 −1 −0.5 0 0.5 1 1.5 2
−2.5
−2
−1.5
−1
−0.5
0
0.5
1
1.5
2
2.5
(b) FCM-GK
−2 −1.5 −1 −0.5 0 0.5 1 1.5 2
−2.5
−2
−1.5
−1
−0.5
0
0.5
1
1.5
2
2.5
(c) KNNClust
−2 −1.5 −1 −0.5 0 0.5 1 1.5 2
−2.5
−2
−1.5
−1
−0.5
0
0.5
1
1.5
2
2.5
(d) NPSEM
Figure 3: Ground truth and clustering results on wine
dataset after selection of the first three principal compo-
nents. The data is projected onto the first two principal axis.
UNSUPERVISED NON PARAMETRIC DATA CLUSTERING BY MEANS OF BAYESIAN INFERENCE AND
INFORMATION THEORY
107
−1.5 −1 −0.5 0 0.5 1 1.5 2
−2
−1.5
−1
−0.5
0
0.5
1
1.5
2
(a) ground truth
−1.5 −1 −0.5 0 0.5 1 1.5 2
−2
−1.5
−1
−0.5
0
0.5
1
1.5
2
(b) FCM-GK
−1.5 −1 −0.5 0 0.5 1 1.5 2
−2
−1.5
−1
−0.5
0
0.5
1
1.5
2
(c) KNNClust
−1.5 −1 −0.5 0 0.5 1 1.5 2
−2
−1.5
−1
−0.5
0
0.5
1
1.5
2
(d) NPSEM
Figure 4: Ground truth and clustering results on iris dataset.
The data is projected onto the first two principal axis.
100 150 200 250 300
100
120
140
160
180
200
220
240
260
280
300
(a) ground truth
100 150 200 250 300
100
120
140
160
180
200
220
240
260
280
300
(b) FCM-GK
100 150 200 250 300
100
120
140
160
180
200
220
240
260
280
300
(c) KNNClust
100 150 200 250 300
100
120
140
160
180
200
220
240
260
280
300
(d) NPSEM
Figure 5: Ground truth and clustering results on a 2D syn-
thetic dataset.
SIGMAP 2007 - International Conference on Signal Processing and Multimedia Applications
108
