
FIDELITY AND ROBUSTNESS ANALYSIS OF IMAGE ADAPTIVE
DWT-BASED WATERMARKING SCHEMES
Franco Del Colle and Juan Carlos G
´
omez
Laboratory for System Dynamics and Signal Processing
FCEIA, Universidad Nacional de Rosario, Argentina
Keywords:
Image Digital Watermarking, Discrete Wavelet Transform, Perceptual Distortion Metrics.
Abstract:
An Image Adaptive Watermarking method based on the Discrete Wavelet Transform is presented in this paper.
The robustness and fidelity of the proposed method are evaluated and the method is compared to state-of-the-
art watermarking techniques available in the literature. For the evaluation of watermark transparency, an image
fidelity factor based on a perceptual distortion metric is introduced. This new metric allows a perceptually
aware objective quantification of image fidelity.
1 INTRODUCTION
Digital Watermarking refers to techniques that are
used to protect digital data by imperceptibly embed-
ding information (the watermark) into the original
data in such a way that always remains present. A
set of requirements should be met by any watermark-
ing technique. The main requirements are perceptual
transparency, payload of the watermark and robust-
ness. Perceptual transparency refers to the property
of the watermark of been imperceptible to the human
eye by simple inspection. Payload of the watermark
refers to the amount of information stored in the wa-
termark. Finally, robustness refers to the capacity of
the watermark to remain detectable after alterations
due to processing techniques or intentional attacks.
Good overviews on the state of the art of classical
watermarking techniques can be found in the recent
textbooks (Barni and Bartolini, 2004) and (Cox et al.,
2002), and in (Podilchuk and Delp, 2001), (Petitcolas,
2000) and the references therein.
Several techniques have been proposed in the lit-
erature for the watermarking of still images. The wa-
termark embedding is achieved by first extracting a
set of features from the image to be watermarked,
and then modifying them according to an embedding
rule. Different approaches have been proposed and
they can be classified taking into account: (i) the
domain in which the watermark is being embedded,
leading to a classification in spatial domain and trans-
form domain techniques; (ii) the watermark adapta-
tion to the particular image leading to Image Adaptive
Watermarking (IAW) methods ((Barni et al., 2001),
(Podilchuk and Delp, 2001)), and Image Indepen-
dent Watermarking (IIW) methods (Cox et al., 1997).
This paper will focus on Image Adaptive Discrete
Wavelet Transform (IADWT) domain watermarking
techniques since they have proved to yield better re-
sults regarding transparency and robustness.
In this paper, a watermarking scheme in the DWT
domain is proposed as a modification of the one
in (Podilchuk and Zeng, 1998). This is done in sec-
tion 2. A new criterion for watermark transparency
evaluation based on perceptual distortion metrics is
proposed in section 3. A watermark robustness eval-
uation criterion is introduced in section 4. A com-
parison between the proposed method and the one
in (Podilchuk and Zeng, 1998) during insertion and
detection is performed in section 5. Finally, some
concluding remarks are given in section 6.
2 IADWT WATERMARKING
Image adaptive watermarking methods make use of
visual models in order to determine the maximum
length and power of the watermark according to the
image capacity to ”hide information” without being
perceptible. This capacity is calculated by means
of the so called Just Noticeable Differences (JND)
thresholds, which measure the smallest difference be-
tween images which is perceptually detectable by the
human eye. In the DWT domain, these thresholds al-
393
Del Colle F. and Carlos Gómez J. (2007).
FIDELITY AND ROBUSTNESS ANALYSIS OF IMAGE ADAPTIVE DWT-BASED WATERMARKING SCHEMES.
In Proceedings of the Second International Conference on Signal Processing and Multimedia Applications, pages 383-387
DOI: 10.5220/0002141503830387
Copyright
c
SciTePress

lows to determine the location of the transform coef-
ficients and the amount that they can variate without
being noticeable in the spatial domain.
In the watermark embedding scheme in
(Podilchuk and Zeng, 1998), the watermark is
modulated by the JND, and the coefficients are
marked whenever they are greater than the JND
threshold, i.e.
b
X
w
(u,v) =
b
X(u,v) + J(u, v)w(ℓ)
b
X(u,v) > J(u,v)
b
X(u,v) othewise
(1)
where
b
X(u, v) and
b
X
w
(u,v) are the DWT coefficients
of the original image and the watermarked image re-
spectively, J(u, v) is the JND matrix at the u, v fre-
quency in the DWT domain, and w(ℓ) is a zero mean,
unit variance, normally distributed random sequence.
In this way, the watermark weighted by the JND
thresholds has lower power than the maximum power
that can be inserted without causing noticeable distor-
tions in the image.
The JND thresholds are computed based on the
perceptual model of the Human Visual System (HVS)
introduced in (Watson et al., 1997). This model takes
into account frequency sensitivity, local luminance
and contrast masking effects to determine an image-
dependent quantization matrix, which provides the
maximum possible quantization error in the DWT co-
efficients which is not perceptible by the HVS.
In the watermark detection scheme the JND are
calculated using the original image, then, the DWT
coefficients of the original image are subtracted from
the ones of the image suspected to be watermarked,
and this difference is divided by the JND in order to
obtain the received watermark. The correlation be-
tween the extracted watermark and the original one
is then performed and the maximum value is deter-
mined, i.e.
w
e
(ℓ) =
b
X
w
(u,v) −
b
X(u, v)
J(u, v)
if
b
X(u, v) > J(u, v) (2)
r
w,w
e
=
w
e
(ℓ) ∗w(−ℓ)
E
w
e
.E
w
(3)
where E
w
e
and E
w
are the energies of the extracted
watermark sequence, w
e
(ℓ), and the original water-
mark sequence, w(ℓ), respectively.
The following modification to the IADWT inser-
tion scheme in (1) can be introduced
b
X
w
(u,v) =
b
X(u,v) + J(u, v)w(ℓ)
b
X(u,v) > J(u,v) > T
b
X(u,v) othewise
(4)
This modified insertion scheme will be hereafter
denoted as IADWT
T
. The rationale for the con-
strain J(u, v) > T is that when the JND thresholds
are too small, the magnitude of the marking term in
(4) becomes negligible. The introduction of the lower
bound T has then the advantage of reducing the wa-
termark length, improving in this way the fidelity and
also the robustness, as will be illustrated in section 5.
The detection scheme in (2) has to be modified
to take into account the modification in the insertion
scheme, as follows
w
e
(ℓ) =
b
X
w
(u,v) −
b
X(u, v)
J(u, v)
if
b
X(u, v) > J(u,v) > T
(5)
3 FIDELITY EVALUATION
In the evaluation of image watermarking methods it
may be of interest to judge the fidelity of the wa-
termarked image, that is the similarity between the
images before and after the watermark insertion. To
avoid the dependence on human judgement in the fi-
delity evaluation, it would be desirable to objectively
quantify the fidelity of watermarked images based on
a metric that takes into account the characteristics of
the HVS.
Image fidelity metrics appeared in the context of
imaging applications to quantify the distortion in im-
ages produced by image processing algorithms such
as compression, halftoning, printing, etc. Different
metrics have been proposed in the literature to mea-
sure image distortion (Winkler, 2005), (Zhang et al.,
2004)). Among them, the ones based on the charac-
teristics of the HVS have proved to deliver the best re-
sults, since they take into account the different sensi-
tivity of the human eye for color discrimination, con-
trast masking and texture masking.
A metric widely used to measure image fidelity
is the S-CIELAB metric (Zhang, 1996) (based on
CIE94 (CIE: International Commission on Illumina-
tion, 1995)) that specifies how to transform physi-
cal image measurements into perceptual differences
(∆E
94
) and incorporates the different spatial sensitiv-
ities of the three opponent color channels. In (Zhang
and Wandell, 1998) the authors test how well the S-
CIELAB metric predicts image fidelity for a set of
color images by comparison with the widely used root
mean square error (RMSE) computed in un-calibrated
RGB values.
Since the S-CIELAB metric takes into account the
perceptual characteristics of the HVS, such as color
discrimination, different spatial sensitivity, etc., this
metric represents a natural choice for the quantifica-
tion, in an objective way, of the fidelity of the water-
marked image. To the best of the authors’ knowledge,
SIGMAP 2007 - International Conference on Signal Processing and Multimedia Applications
394

Figure 1: Left: Original Image. Center: Noisy Image.
Right: Distortion Map.
this perceptual metric has not been considered before
in the context of watermark fidelity evaluation.
To illustrate the use of the S-CIELAB metric, a
region of the left image in Figure 1, delimited by
the white square in the center image, is corrupted
with zero mean unit variance additive Gaussian white
noise. The right image shows the image distor-
tion map corresponding to the noise corrupted image,
where the S-CIELAB ∆E
94
values are shown with a
grayscale color map. The pixels where the S-CIELAB
∆E
94
values are above a specified threshold are then
marked in green. For reference purposes the edges
of the original image are displayed in white. Note
the reader that there are no perceptible differences be-
tween the original and corrupted images.
The idea in this paper is to use distortion maps to
compare watermarked image fidelity for the two in-
sertion methods described in section 2. Due to the
spatial distribution of the S-CIELAB ∆E
94
errors in
the distortion maps (the green marks in the right im-
age of Figure 1) it is difficult to make a comparison of
the different methods. To provide a unique parameter
quantifying this fidelity, a pooling of the S-CIELAB
∆E
94
error is proposed as follows:
F ,
1−
∑
M
i=1
∑
N
j=1
S∆E
94
(i, j)Mask(i, j)
∑
M
i=1
∑
N
j=1
√
X
L
(i, j)
2
+X
a
(i, j)
2
+X
b
(i, j)
2
×100
(6)
where M and N are the rows and columns of the
image, S∆E
94
is a matrix with the values of the S-
CIELAB ∆E
94
errors for each pixel, i.e. the image
distortion map, Mask is a mask with ones in the posi-
tions where the S-CIELAB ∆E
94
errors are above the
threshold and zeros otherwise, and X
L
, X
a
and X
b
are
the image components in the Lab color space.
The performance of the proposed metric is com-
pared with that of a standard non perceptual metric
based on the RMS error. This metric, namely Root
Mean Square Fit (RMS
FIT
), is obtained by making a
pooling of the RMS errors, resulting in:
RMS
FIT
,
1−
∑
M
i=1
∑
N
j=1
√
∆X
R
(i, j)
2
+∆X
G
(i, j)
2
+∆X
B
(i, j)
2
∑
M
i=1
∑
N
j=1
√
X
R
(i, j)
2
+X
G
(i, j)
2
+X
B
(i, j)
2
!
×100
(7)
where the subindexes R, G and B denote the corre-
sponding image components in the RGB color space.
A.
B. C.
D. E.
Figure 2: A. Im 1, B. Im 2, C. Im 3, D. Im 4 and E. Im 5.
4 ROBUSTNESS EVALUATION
Another important issue when evaluating image wa-
termarking methods is the robustness, i.e., the capac-
ity of the watermark to survive standard image pro-
cessing alterations, such as lossy compression, scal-
ing, cropping, printing and scanning, etc..
In this paper, robustness of the watermark against
JPEG compression is evaluated by computing a
degradation coefficient, D, which quantifies the
degradation in the watermark detectability caused by
this image processing tasks. To perform the robust-
ness test, the watermarked image is subjected to the
above mentioned attack, and then the watermark is
extracted following the procedure described in sec-
tion 2. The normalized cross-correlation, r
w,w
e
(k), be-
tween the original, w(ℓ), and the extracted, w
e
(ℓ), wa-
termarks is then computed. The detectability degra-
dation coefficient is then defined as,
D , (1−r
w,w
e
(0)) ×100. (8)
5 RESULTS
In order to compare the performance of the proposed
watermarking scheme IADWT
T
and the IADWT in
(Podilchuk and Zeng, 1998), a set of (256×256) nat-
ural color images was used (only five are shown due to
space limitations, Im 1 to Im 5 inFigure 2). To make
the results independent of the particular set of natu-
ral images considered, the same tests were also per-
formed on synthetic images with large uniform areas
(like Im 4 in Figure 2.D) and images with predomi-
nant high frequency regions (like Im 5 in Figure 2.E).
5.1 Fidelity Evaluation Results
In this section two separate tests to evaluate fidelity
will be performed. The purpose of Fidelity Test 1 is
FIDELITY AND ROBUSTNESS ANALYSIS OF IMAGE ADAPTIVE DWT-BASED WATERMARKING SCHEMES
395

Figure 3: Original (left) and Watermarked (right) images.
to illustrate the fact that the fidelity factor
F defined
in (6) provides a much better assessment of image
quality than the standard RMS
FIT
. Fidelity Test 2
is designed to compare the fidelity of the two DWT
based insertion schemes described in Section 2.
Fidelity Test 1: In order to illustrate the fact
that the RMS
FIT
does not provide an objective
assessment of image quality, a watermarked image
with a strong watermark was generated with the IIW
embedding technique proposed in (Cox et al., 1997).
The original and the marked images are shown in
the left and right sides of Figure 3, respectively.
In this case the α parameter was chosen equal to
0.25, resulting in a fidelity factor
F = 34.04% and
a RMS
FIT
= 91.26%. Based only on the RMS
FIT
one would expect no noticeable distortions on the
watermarked image which is not the case for this
example (particularly in the sky portion at the top
of the image). The fidelity factor
F in turn gives a
better assessment of image quality.
Fidelity Test 2: The values of the watermark
length L, the normalized watermark energy E com-
puted as the normalized mean square error between
the original and the watermarked images, the fidelity
factor
F , and the RMS
FIT
were computed for the five
images in Figure 2, marked using the IADWT and
IADWT
T
insertion schemes described in Section 2.
The results are shown in Table 1.
As can be observed from the fifth column in Ta-
ble 1 there is no noticeable difference between the
fidelity, as measured by the RMS
FIT
, using both in-
sertion schemes. The difference is more noticeable
using the proposed fidelity factor, as can be observed
from the values in the fourth column.
The values of the fidelity factor,
F , in Table 1
show that the IADWT
T
method consistently outper-
forms the IADWT method regarding fidelity. Even for
the case of images with large uniform color regions,
like Im 4 in Figure 2.D, where the image adaptive
methods are supposed to work poorly (Podilchuk and
Zeng, 1998), the IADWT
T
method produces non per-
ceptible watermarks. On the other hand, the IADWT
Table 1: Results on Fidelity Evaluation for Im 1 to Im 5.
L E F RMS
FIT
(×10
−3
) (%) (%)
Im 1
IADWT 8347 1.40 92.27 97.45
IADWT
T
874 0.38 98.37 99.20
Im 2
IADWT 9314 1.26 94.13 97.52
IADWT
T
1036 0.37 98.50 99.22
Im 3
IADWT 8196 1.76 92.59 97.11
IADWT
T
1117 0.65 98.03 98.90
Im 4
IADWT 3002 0.12 99.63 99.17
IADWT
T
1138 0.07 99.82 99.67
Im 5
IADWT 11336 1.06 95.52 97.56
IADWT
T
1458 0.33 98.63 99.05
method introduces visible distortions, as can be ob-
served from the first row in Figure 4 (see for instance
the spots in the green regions in the left image).
The left columns in Figure 4 show the water-
marked images corresponding to Im 1 and Im 4
using the above mentioned watermarking schemes.
The right columns show the corresponding distortion
maps obtained after applying the S-CIELAB ∆E
94
metric. As expected, the distortion is larger in the re-
gions with high frequency components, which results
in a less perceptible watermark due to the masking
phenomenon of the HVS.
5.2 Robustness Evaluation Results
In this subsection the robustness of the water-
marked images against JPEG compression is evalu-
ated, for both image adaptive DWT-based watermark-
ing schemes. The detectability degradation coeffi-
cient
D , as defined in (8), is computed when JPEG-
compression with quality factors in the range [95%-
75%] is applied. The results for Im 1, Im 4 and Im
5 are shown in Figure 5 from top to bottom respec-
tively. As can be observed the IADWT
T
watermark-
ing scheme consistently outperforms the IADWT one
regarding robustness against JPEG compression.
6 CONCLUDING REMARKS
An image fidelity factor based on the S-CIELAB per-
ceptual distortion metric has been introduced in this
paper for the purposes of evaluating the distortion
introduced by different IADWT watermark insertion
SIGMAP 2007 - International Conference on Signal Processing and Multimedia Applications
396
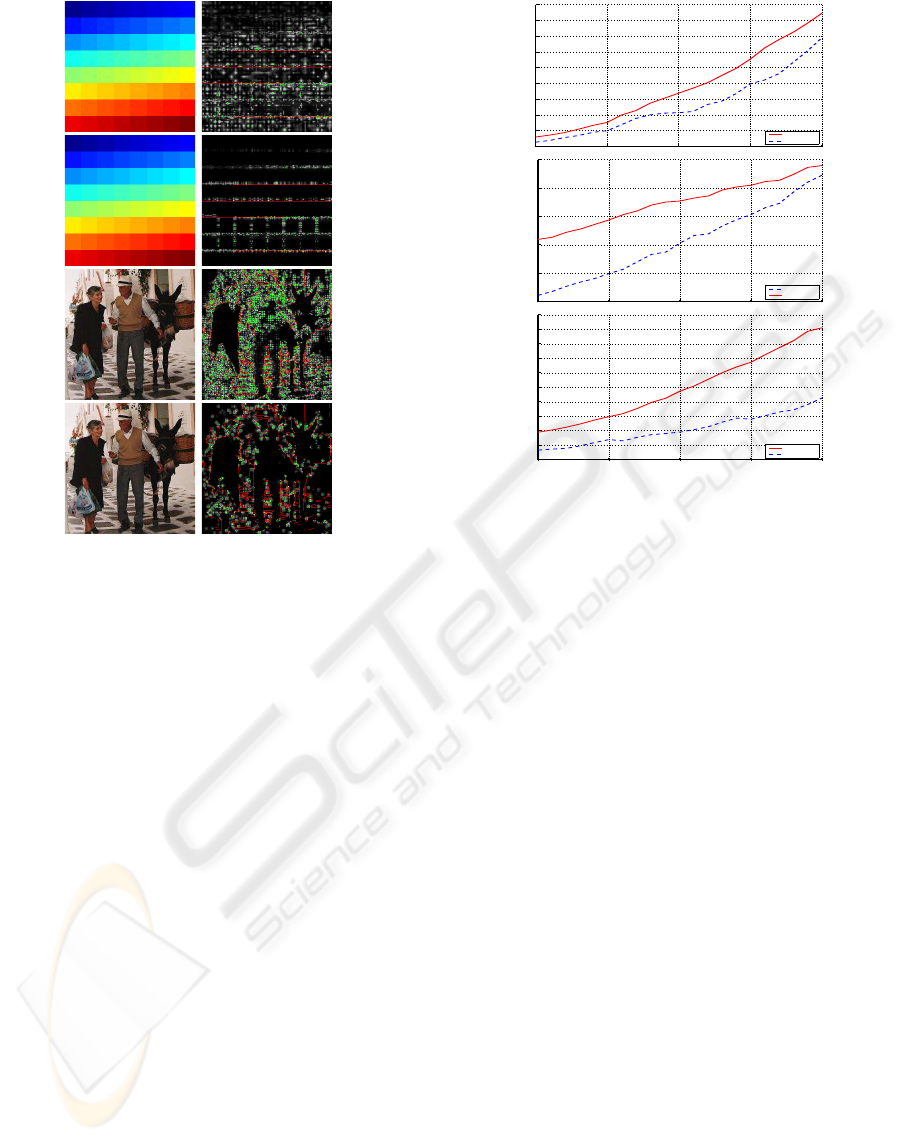
Figure 4: Left Column: IADWT marked Im 4 (first row),
IADWT
T
marked Im 4 (second row), IADWT marked Im
1 (third row), IADWT
T
marked Im 1 (fourth row). Right
Column: Corresponding distortion maps.
schemes. The use of this metric allows a perceptu-
ally aware objective quantification of image fidelity.
Simulation results show the suitability of the pro-
posed metric in the framework of still image digital
watermarking. Further, a new IADWT watermark-
ing scheme has been introduced, and its robustness
against compression, and fidelity have been investi-
gated. The results show that the proposed technique
outperforms other methods available in the literature.
REFERENCES
Barni, M. and Bartolini, F. (2004). Watermarking Systems
Engineering - Enabling Digital Assets and Other Ap-
plications. Marcel Dekker, Inc., New York.
Barni, M., Bartolini, F., and Piva, A. (2001). Im-
proved wavelet-based watermarking through pixel-
wise masking. IEEE Trans. on Image Process.,
10(5):783–791.
CIE: International Commission on Illumination (1995). In-
dustrial colour difference evaluation. Tech. Rep. CIE
116-95, Austria.
Cox, I., Kilian, J., Leighton, F., and Shamoon, T. (1997).
Secure spread spectrum watermarking for multimedia.
IEEE Trans. on Image Process., 6(12):1673–1687.
7580859095
0
2
4
6
8
10
12
14
16
18
D [%]
IADWT
IADWT
T
7580859095
10
15
20
25
30
35
D [%]
IADWT
T
IADWT
7580859095
0
2
4
6
8
10
12
14
16
18
20
Quality Factor [%]
D [%]
IADWT
IADWT
T
Figure 5: From Top to Bottom: Detectability degradation
coefficient vs. JPEG Quality Factor for Im 1, Im 4 and Im
5.
Cox, I., Miller, M., and J.Bloom (2002). Digital Water-
marking. Morgan Kaufmann, San Francisco.
Petitcolas, F. (2000). Watermarking schemes evaluation.
IEEE Signal Process. Magazine, 17(5):58–64.
Podilchuk, C. and Delp, E. (2001). Digital watermarking:
Algorithms and applications. IEEE Signal Process.
Magazine, 18(4):33–46.
Podilchuk, C. and Zeng, W. (1998). Image-adaptive wa-
termarking using visual models. IEEE J. on Selected
Areas in Communications, 16(4):525–539.
Watson, A., Yang, G., Solomon, J., and Villasenor, J.
(1997). Visibility of wavelet quantization noise. IEEE
Trans. on Image Process., 6:1164–1175.
Winkler, S. (2005). Digital Video Quality Vision Models
and Metrics. John Wiley & Sons Ltd, Chichester, UK.
Zhang, X. and Wandell, B. (1998). Color image fidelity
metrics evaluated using image distortion maps. Signal
Process., 70:201–214.
Zhang, Z. (1996). A spatial extension to CIELAB for digi-
tal color image reproduction. Society for Information
Display Symposium Technical Digest, 27:731–734.
Zhang, Z., Bovik, A., Sheikh, H., and Simoncelli, E. (2004).
Image quality assessment: From error visibility to
structural similarity. IEEE Trans. on Image Process.,
13(4):600–612.
FIDELITY AND ROBUSTNESS ANALYSIS OF IMAGE ADAPTIVE DWT-BASED WATERMARKING SCHEMES
397
