
LSGENSYS - AN INTEGRATED SYSTEM FOR PATTERN
RECOGNITION AND SUMMARISATION OF MULTI-BAND
SATELLITE IMAGES
Hema Nair
C.T.R.F., 813, 7
th
Main, 1
st
Cross, HAL 2
nd
Stage, Bangalore 560008, India
Keywords: Data mining, pattern recognition, image analysis, feature extraction, blackboard component, linguistic
summary, intelligent system.
Abstract: This paper presents a new system developed in Java
®
for pattern recognition and pattern summarisation in
multi-band (RGB) satellite images. Patterns such as land, island, water body, river, fire in remote-sensed
images are extracted and summarised in linguistic terms using fuzzy sets. Some elements of supervised
classification are introduced in the system to assist in the development of linguistic summaries. Results of
testing the system to analyse and summarise patterns in SPOT MS images and LANDSAT images are also
discussed.
1 INTRODUCTION
The processes and techniques that comprise data
mining, analyse raw data to discover implicit
patterns that are useful for decision-making. Pattern
recognition is another form of data mining because
both concentrate on the extraction of information or
relationships from data. A particular data mining
technique may be successful with one type of
multimedia such as images, but the same technique
may not be well suited to many other types of
multimedia due to varying structure and content.
A system that classifies and summarises patterns
such as land, island, water body, river, and fire, was
described in (Nair, 2004). The system utilised fuzzy
logic to describe these patterns. (Nair, 2006)
introduced some significant changes to the system.
A few of these changes have been implemented in
C.T.R.F.
®
’s
LSGENSYS. LSGENSYS (Linguistic
S
ummary Generation System) draws upon the
earlier techniques of utilising fuzzy logic, but also
adds a new significant element of user interaction
via the blackboard architecture component
(described in Section 2). This paper is organised as
follows. Section 2 explains the architecture and
design of the system. Section 3 explains the
methodology and approach. Section 4 presents
results of testing the system for image analysis,
pattern recognition and summarisation on
LANDSAT and SPOT MS satellite images. Section
5 presents the conclusions and future work.
2 SYSTEM ARCHITECTURE
LSGENSYS is an integrated system that allows the
user to analyse images, extract feature descriptors
such as area, length, location etc of patterns and then
use these descriptors to form linguistic summaries of
these patterns. This system also provides an
interactive environment, wherein, the user may
suggest some possible linguistic summaries for the
image patterns. The system would evaluate the
fitness of these user-summaries. Alternately, the
system could, without user intervention, generate
some possible summaries and evaluate their fitness
and suitability with respect to the image patterns.
The system architecture is shown in Figure 1. The
input image is analysed and some feature descriptors
extracted. These descriptors are stored thereafter in a
relational table in the database. The blackboard
holds the current state in the process of developing
summaries. This paper presents the system with the
significant change where, presently, the user has the
choice of suggesting concepts such as descriptions
of area, length, location of patterns etc. The
knowledge base uses geographic facts to define
feature descriptors using fuzzy sets. It interacts with
a built-in library of linguistic labels, which also
478
Nair H. (2007).
LSGENSYS - AN INTEGRATED SYSTEM FOR PATTERN RECOGNITION AND SUMMARISATION OF MULTI-BAND SATELLITE IMAGES.
In Proceedings of the Ninth International Conference on Enterprise Information Systems - AIDSS, pages 478-482
DOI: 10.5220/0002345204780482
Copyright
c
SciTePress
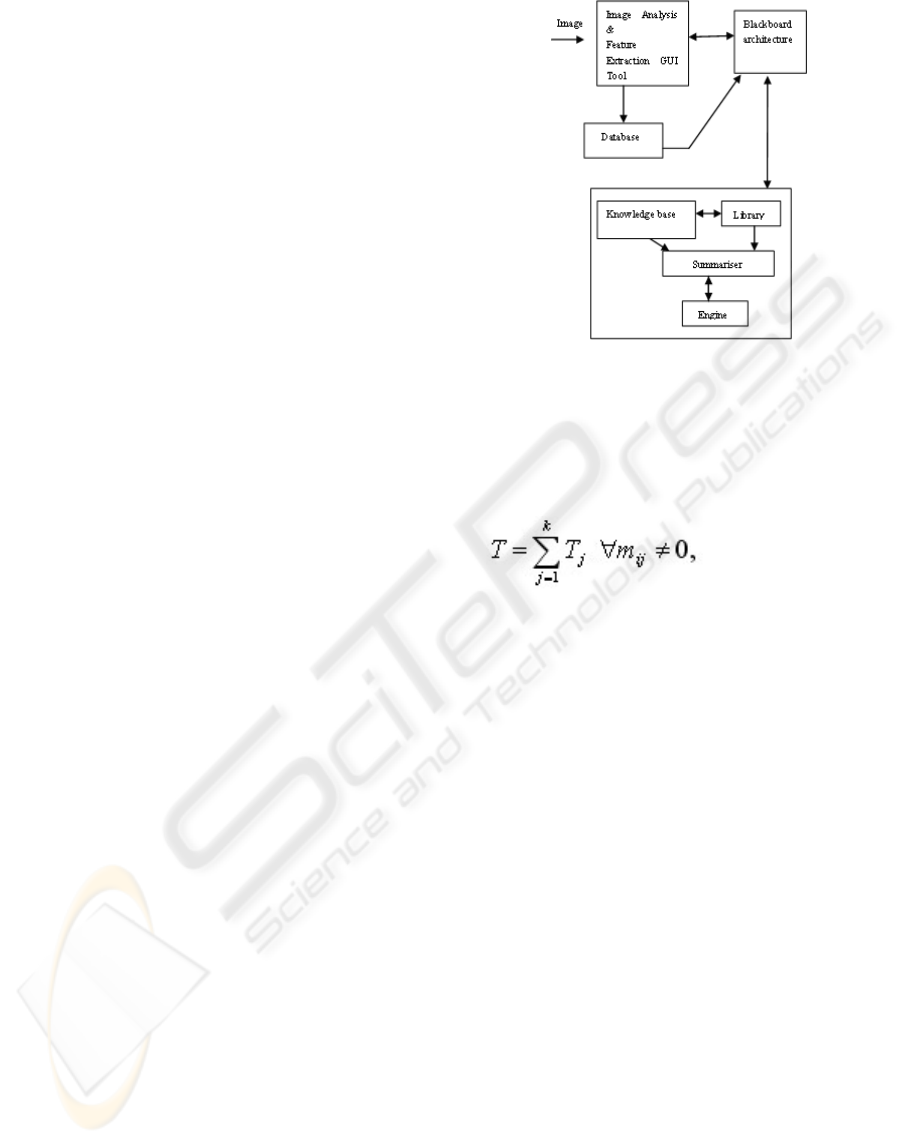
interacts with the summariser as it supplies the
necessary labels to it. The summariser receives input
from these components and performs a comparison
between actual feature descriptors of the image
patterns stored in the database, the concepts
suggested by the user, and the feature definitions
stored in the knowledge base. After this comparison,
the summariser uses the linguistic labels supplied by
the library to formulate some possible summaries for
each pattern/object in the database. These summaries
are stored in the blackboard. From among these
summaries, the most suitable one describing each
pattern is selected by interaction with the engine
(genetic algorithm). As the GA evolves through
several generations, it generates better summaries
(indicated by higher fitness, as defined in Section 4)
which are then stored and indicated on the
blackboard. Thus, the system has been improved and
enhanced to include some elements of supervised
classification and summarisation. The classification
rules that classify land, island, water body, river, and
fire are the same as in (Nair, 2006).
3 APPROACH
As in (Nair, 2006), area, length, location (X, Y pixel
co-ordinates of centroid of pattern in image),
Additional Information or Pattern Id, grey level
intensity, are the attributes of the patterns/objects
that are used to develop their linguistic summaries.
These attributes are calculated/extracted
automatically by the GUI tool. The linguistic
summary of patterns/objects is evaluated as follows.
If
p21
y,...y,yY = (1)
then
truth(y
i
isF)=μ
F
(y
i
):i=1,2,...,p, (2)
where μ
F
(y
i
) is the degree of membership of y
i
in the fuzzy set F and 0 ≤ μ
F
(y
i
) ≤ 1. The linguistic
proposition y
i
is F could be instantiated as for
example, River is relatively long.
In order to generate such summaries, it is
necessary to formulate fuzzy sets that quantify
area/length attributes of the object/pattern.
Triangular and trapezoidal fuzzy sets (totally twenty
nine sets) have been formulated. The linguistic
description is calculated as follows:
njj2j1j
m...mmT ∧∧=
, (3)
where m
ij
is the matching degree (Kacprzyk,
Ziolkowski, 1986) of the ith attribute in the jth tuple.
m
ij
∈[0,1] is a measure of degree of membership of
the ith attribute value in a fuzzy set denoted by a
fuzzy label. The logical AND (∧) of matching
degrees is calculated as the minimum of the
matching degrees (Kacprzyk, Ziolkowski, 1986).
(4)
T in equation (4) is a numeric value that
represents the truth of a possible set of summaries of
the k objects in the database. The next section
discusses how the GA evolves the most suitable
linguistic summary for all the objects by maximising
T.
4 IMPLEMENTATION ISSUES
This section explains the implementation of the
system, including the genetic algorithm approach
and then discusses the results from applying this
approach to analysing images.
4.1 GA Approach
Biological evolutionary theories are emulated by the
genetic algorithm (GA) as it attempts to solve
optimisation problems (Filho et al., 1994),
(Goodman, 1996), (Smith et al., 1994). Each binary
chromosome string in a population represents a
possible linguistic summary for a pattern. Such a
population of strings is manipulated by selection,
cross-over and mutation operators in the GA (Filho
et al., 1994) such that as the GA evolves through
several generations, only those strings with highest
fitness survive. The evaluation or fitness function for
Figure 1: System architecture.
LSGENSYS - AN INTEGRATED SYSTEM FOR PATTERN RECOGNITION AND SUMMARISATION OF
MULTI-BAND SATELLITE IMAGES
479
the linguistic summaries or descriptions of all
objects in the table is
f=max(T), (5)
where T is evaluated as shown in the previous
section.
4.2 Results and Discussion
Image objects/patterns are classified at the highest
level into land, water or fire. Land is further
classified into island and other land. Water is further
classified into river and other water body. The fuzzy
sets that quantify area or length are defined with
reference to geographic facts such as:
• Largest continent is Asia with area of
44579000 km
2
• Largest freshwater lake is Lake Superior
with area of 82103 km
2
• Smallest continent is Australia/Oceania
with area of 7687000 km
2
In (6), the triangular fuzzy set for considerably
large expanse of water is shown.
waterof expanse largely considerab
μ
(x)=
1-(55068.66-x)/27034.33, for
28034.33≤x≤55068.66
=1-(x-55068.66)/27034.33, for 55068.66≤x≤
82103
=0, x< 28034.33
=0, x> 82103 (6)
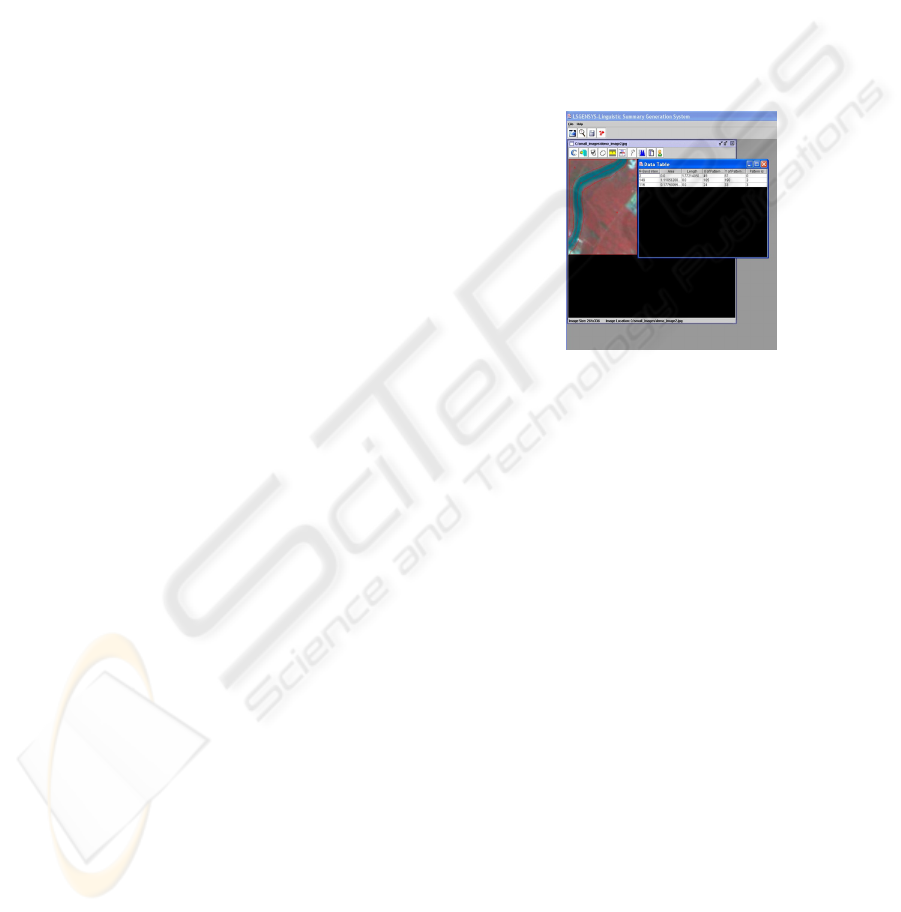
An example SPOT MS satellite image to be
analysed is shown in Figure 2. Figure 2 shows the
image analysis tool of the system as it extracts area
and length attributes of three patterns in the image.
These attributes are calculated and displayed in the
data table in the figure. Pattern id attribute denotes
numbers as follows: 0= River, 1=Water Body,
2=Island, 3=Land, 4=Fire. Location is indicated by
X, Y pixel co-ordinates of centroid of pattern/object.
For river, its length is the most significant attribute
for calculation, whereas for all other patterns, area is
the most significant attribute for calculation.
The user may choose, at this stage, to interact with
the system and suggest some possible summaries.
The system can evaluate the fitness of the user-
summaries and inform the user if they are most
suitable to describe the image patterns in the table.
After the user chooses triangular fuzzy sets in the
knowledge base, the system displays triangular
fuzzy set definitions (lower-left window in Figure
3) in order to guide the user to select the appropriate
fuzzy set for area or for length of different patterns
such as land, island, water body, river etc. With the
aid of these fuzzy set definitions, the user then
constructs some possible pattern summaries as
shown in Window 1. The fitness value (1.0) of these
possible summaries is calculated and displayed in
Window 1. Thereafter, the user may verify the
correctness of these summaries and their suitability
with respect to the image patterns by running the GA
Inference Engine.
Figure 4 shows a snapshot of the GA Inference
Engine as it runs (in the top left window) and
evolves the most suitable summaries with higher
fitness, over several generations.
Figure 2: The image analysis tool of the system as it
extracts area and length of patterns in a SPOT MS image.
Approximate scale of image 1: 0.000019.
The summaries generated by the engine are
captured in a text file as displayed in the top right
window of Figure 4. The user may also chose to
bypass the summary construction process, and
directly invoke the inference engine (by pressing the
Run button in Figure 3) to construct and generate the
most suitable summaries. This would resemble
unsupervised classification and description.
The GA is run with following input parameter
set. These parameter values are set after several trial
runs.
No: of bits in a chromosome string of the
population = 10
Generations per cycle = 27
Population size = 200 strings
Probability of cross-over = 0.535
Probability of mutation = 0.001
After 216 generations, the linguistic summaries
generated for the data in Table 1 are:
• A short river at the top left
• A small area of land at the top left
• A small area of land at the right
Thus, the possible summaries formulated by the
user compare well with the summaries generated by
the inference engine.
ICEIS 2007 - International Conference on Enterprise Information Systems
480
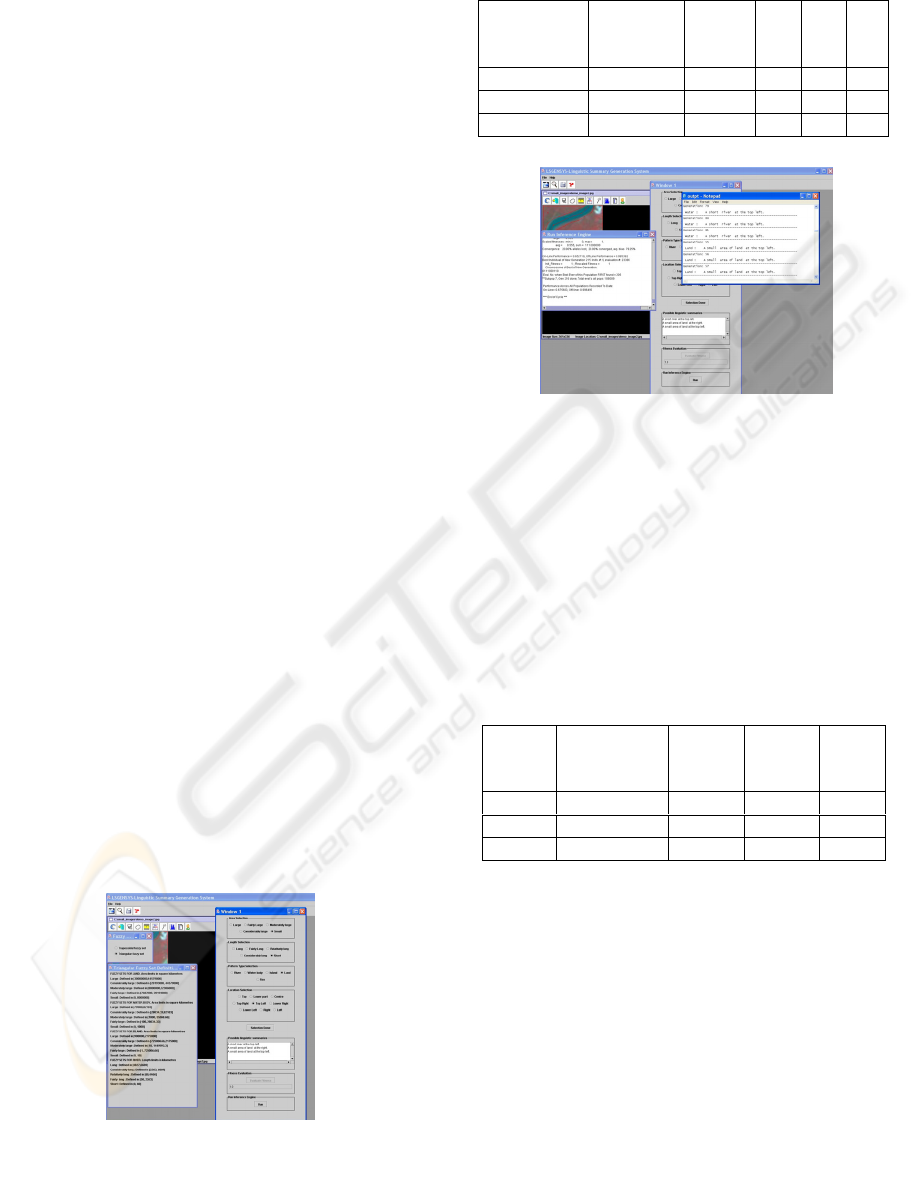
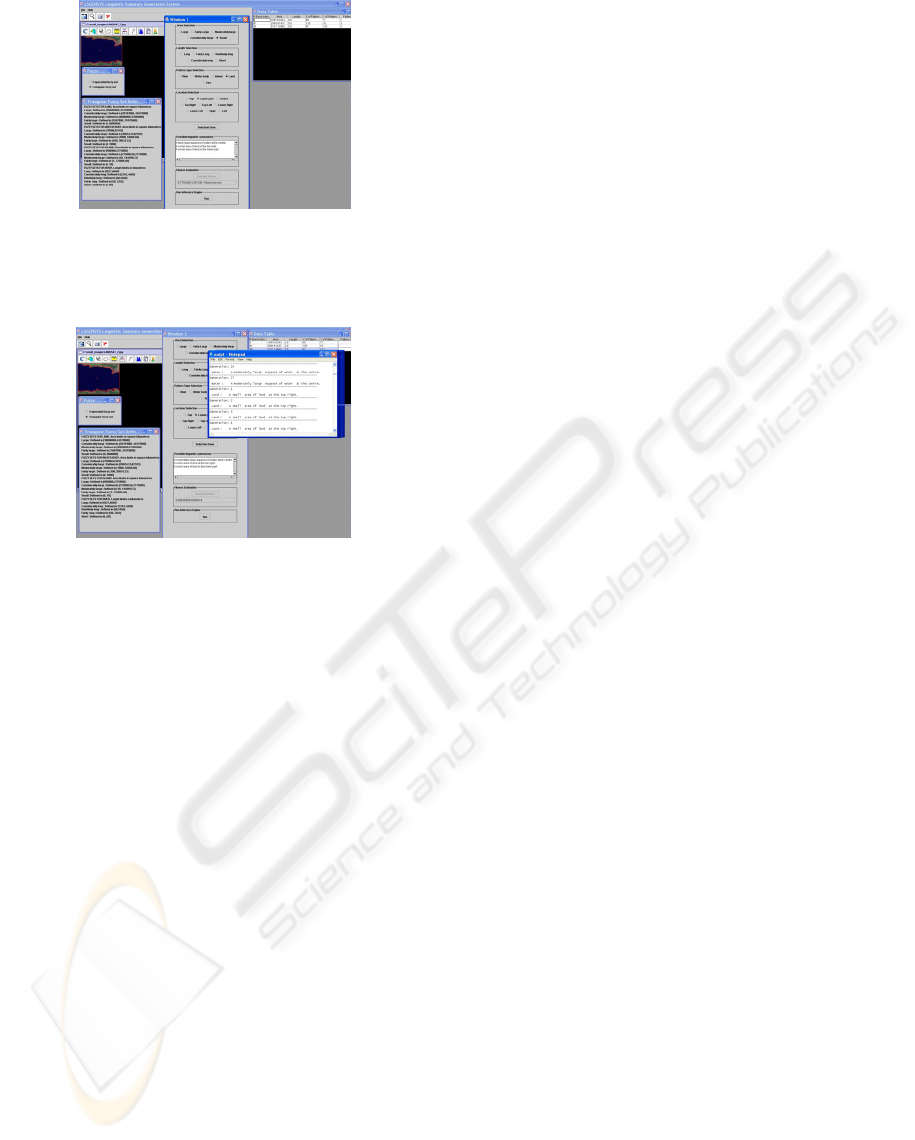
Figure 5 and Figure 6 show the same procedure
as applied to a LANDSAT image. Table 2 shows the
data calculated from the image patterns. In Figure 5,
the system evaluates and displays the fitness of the
summaries formulated by the user. In this case, the
fitness value calculated is 0.778, which is considered
by the system to be too low. Therefore, the system
rejects the summaries and the user re-formulates
some possible summaries as shown in Figure 6. The
fitness of this set of summaries is higher at 0.888,
and the system accepts this possible set of user
summaries.
The GA Inference Engine is invoked by the user
to verify and validate the suitability of the possible
set of summaries. The resulting summaries from the
inference engine are enumerated below. The GA is
run with the same input parameter set as before, with
the exception that cross-over probability is set to
0.538.
After 216 generations, the linguistic summaries
generated for the data in Table 2 are:
• A small area of land at the top right
• A small area of land in the lower part
• A moderately large expanse of water at
the centre.
These summaries match the user-formulated
summaries in Figure 6.
The blackboard architecture component of the
system has been implemented via the user
interaction process. The sequence of windows such
as Fuzzy Set Type selection window, Fuzzy Set
Definitions window, Window 1, Run Inference
Engine Window, and the Outpt window are
programs integral to the blackboard architecture
component. The Data Table and possible set of user-
formulated summaries in Window 1 are part of the
blackboard data structure. Control in the blackboard
architecture directs the order in which the programs
are invoked depending on the user-formulated
summaries stored in the blackboard.
Table 1: Data calculated from image in Figure 2.
Figure 4: Snapshot of the GA Inference Engine as it runs
and evolves the most suitable summaries that fit all the
patterns extracted from the image.
5 CONCLUSIONS AND FUTURE
WORK
This paper has presented a new system developed in
Java for image analysis and pattern recognition in
multi-band satellite images.
Table 2: Data calculated from image in Figure 5.
The system architecture and design have been
described. The system has been tested successfully
with a SPOT MS image and a LANDSAT image and
the results have been presented and discussed. Some
directions of future work include: adding the
provision to upload ground data in order to help
classify more patterns such as vegetation in satellite
images using supervised classification techniques,
adding enhancements to image analysis functions,
adding a scripting feature that allows the user to
program a sequence of image analysis instructions in
a user-friendly language.
R-band grey
level
Approx
Area
Approx
Length
X
Y Id
2 - 1.772 49 87
0
149 1.1186 - 185 190
3
116 0.1775 - 24 33
3
R-band
grey
level
Approx
Area
sq km
X
Y
Id
5 18979.83 88 71 1
91 2565.61 135 10 3
36 2317.14 97 133 3
Figure 3: The user icon on the second horizontal menu bar
is clicked in order to start the user interaction process.
LSGENSYS - AN INTEGRATED SYSTEM FOR PATTERN RECOGNITION AND SUMMARISATION OF
MULTI-BAND SATELLITE IMAGES
481
REFERENCES
Filho, J.L.R., Treleaven, P.C., and Alipi, C., 1994. Genetic
Algorithm programming environments. In IEEE
Computer, pp. 28-43
Goodman E.D., 1996. An Introduction to Galopps-the
Genetic ALgorithm Optimized for Portability and
Parallelism System(Release 3.2). Technical Report
No. 96-07-01, Genetic Algorithms Research and
Applications Group, Michigan State University.
Kacprzyk, J., Ziolkowski, A., 1986. Database queries with
fuzzy linguistic quantifers. In IEEE Transactions on
Systems, Man and Cybernetics, pp. 474-479.
Nair, H., 2004. A system for interpretation and description
of some patterns in images, In International Journal of
Computational Intelligence, 1(4), pp. 368-373.
Nair, H., 2006. Development of summaries of certain
patterns in multi-band satellite images. In
Proceedings of 8
th
International Conference on
Enterprise Information Systems, pp. 278-284.
Smith, R.E., Goldberg, D.E., Earickson, J.A., 1994. SGA-
C:A C-language implementation of a Simple Genetic
Algorithm. TCGA Report No.91002.
Figure 5: A LANDSAT image is analysed by the system
and some possible summaries formulated by the user.
Approximate scale of image is 1: 0.952 sq km.
Figure 6: For the image in Figure 5, a different set o
f
summaries as formulated by the user and fitness re-
evaluated by the system.
ICEIS 2007 - International Conference on Enterprise Information Systems
482
