DESIGNING AN E-BASED REAL TIME QUALITY CONTROL
INFORMATION SYSTEM FOR DISTRIBUTED
MANUFACTURING SHOPS
Iraj Mahdavi
a
, Babak Shirazi
a
, Maghsud Solimanpur
b
and Shahram Ghobadi
c
a
Mazandaran University of Science & Technology, Babol, Iran
b
Urmia University, Urmia, Iran
c
Iran University of Science and Technology, Tehran, Iran
Keywords: Distributed manufacturing shop, e-based quality control, Information system, Real-time process.
Abstract: Advanced manufacturing systems need to be developed for an enterprise to survive in the increasingly
competitive global market. Statistical e-based quality control approach combines statistical quality analysis
and reporting capabilities with web technology to deliver process optimization solutions. In this paper we
develop a structured profile for statistical e-based quality control to provide the capacity to access required
data anywhere. It helps enterprises to develop customized quality information systems, create and distribute
reports via the internet, and provide real-time display of quality profiles for process monitoring. Quality
engineers and managers have been dependent on information system (IS) departments to secure access to
such data. Statistical e-based quality profile is designed to bridge the gap between the raw data and genuine
quality improvement efforts by providing a powerful web-based solution for real-time quality process.
1 INTRODUCTION
The global diffusion of advanced manufacturing
systems naturally resulted in the needs for distant
product development, which in turn requires the
provision of production information and control on
its procedures across product life cycle. In a
distributed manufacturing shop (DMS), factories
possessing various machines and tools are at
different geographical shop floor, and different
manufacturing capabilities are often selected to
achieve the highest production quality.
Manufacturing operations can be performed by
different machines and tools at different locations.
Distributed manufacturing enables the enterprises to
achieve better product quality, lower production cost
and reduced management risk.
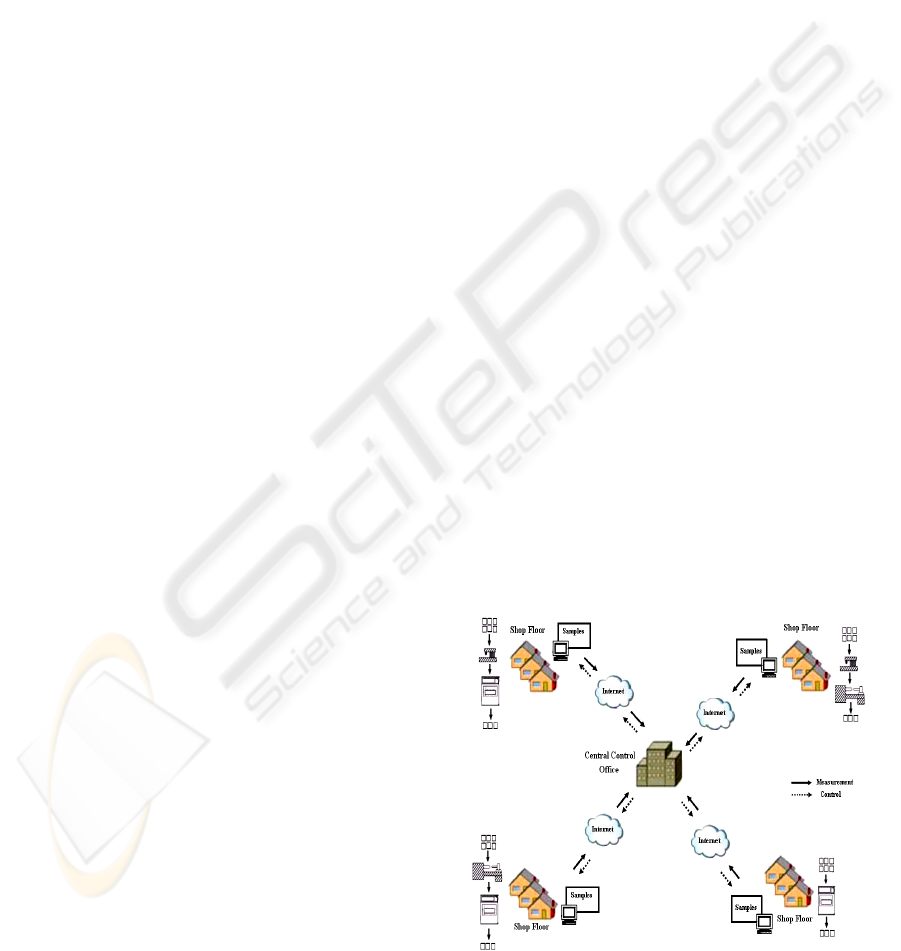
Quality information system (QIS) controls the
quality related information flow between the shop
floors that are combined in a production network in
a geographically distributed manufacturing shops as
shown in Figure 1.
Implementation of a distributed quality
information system requires the data gathering,
processing, storage and distribution among any shop
floors and central control office. In response to this
need, the research community has come with a
solution called e-Based DMS, which is defined as
‘‘an Internet-based computational architecture that
supports the sharing and transfer of knowledge and
information about the product and manufacturing
process amongst geographically distributed shops”
(Rodriguez and Al-Ashaab, 2002; Molina et al.,
1995; Ka Chi Lam and Thomas Ng., 2006).
Figure 1: The distributed manufacturing shops (DMS).
159
Mahdavia I., Shirazia B., Solimanpurb M. and Ghobadic S. (2007).
DESIGNING AN E-BASED REAL TIME QUALITY CONTROL INFORMATION SYSTEM FOR DISTRIBUTED MANUFACTURING SHOPS.
In Proceedings of the Ninth International Conference on Enterprise Information Systems - ISAS, pages 159-163
DOI: 10.5220/0002356701590163
Copyright
c
SciTePress
The aim of this paper is to improve the quality of
production and reduce loss through systematic
tracking and the use of information as continuous
feed-back to production lines by central control
office through a real time quality control information
system (RTQCIS). The proposed paradigm is to aid
quality engineers in distributed shops to send data
and obtain reliable results pertaining to
manufacturing. The RTQCIS architecture also
satisfies all the fundamental requirements for DMS
about statistical quality control in a real time
environment.
2 STATISTICAL E-BASED
QUALITY CONTROL FOR A
DMS
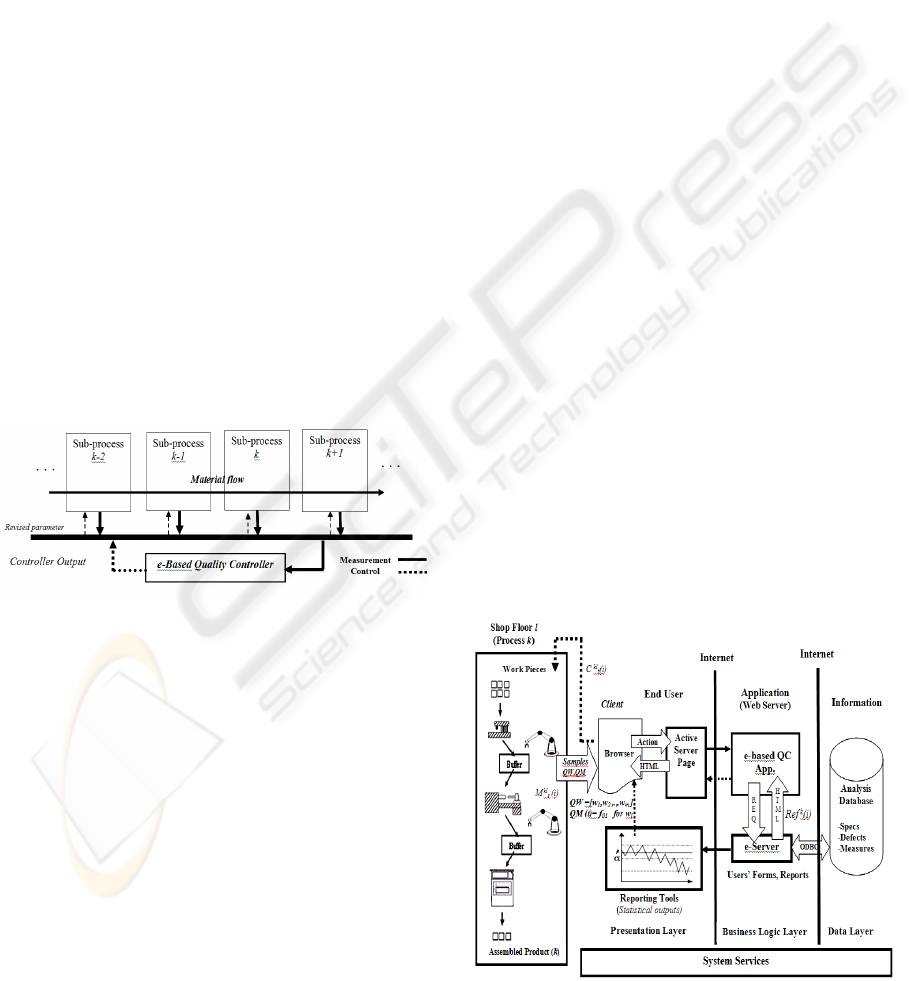
In general, an internet-based manufacturing system
must consist of all processes related to shops
(Sangyoon et al., 2004). The work-pieces in shop are
processed in the sub-processes until the final product
is obtained. In each sub-process the work-piece
quality must be measured. This system must be
connected to internet (or any world-wide
information area network) according to Figure 2.
Figure 2: The model of e-based manufacturing sub-
processes.
Statistical e-based QC has combined statistical
quality analysis and reporting capabilities with
revised policy over web to deliver a process
optimization system that will give everyone in an
enterprise (from the manufacturing floor to the
central executive suite) the information they need to
monitor, analyze, and improve important processes.
Statistical e-based QC must be designed to help
enterprise to bridge the gap between the raw
data and genuine quality improvement. It must
provide a powerful web-based solution for real-time
data to be shared anywhere in the enterprise any
time in a secure environment.
Quality managers have used quality control
systems such as statistical process control,
production part approval process, failure mode
effects analysis, gage calibration and document
control to access key attribute of production process.
Manufacturers currently measure process key
parameter and performance to improve quality in
production (Vijayaram et al., 2006). Statistical e-
based quality control enables continuous quality
improvement through easy and cost-effective access
to quality data. It requires an internet-enabled
software solution to allow individuals to access the
quality data for various analysis. It also needs a
dynamic web-based application that serves as a
quality portal, so that users can easily and cost-
effectively integrate a wide variety of information
for quality improvement.
Any internet-based system architecture is
structured around a three-layered framework:
information, application and end user layer
(Rodriguez and Al-Ashaab, 2005). The end user
layer is connected to the application web server
(application layer), which in turn is connected to the
information databases (information layer). The
application layer consists of two elements: decision
support applications and information management
tools. The web-based interface of the end-user layer
helps users to view and use different decision
support applications and tools. The product data is
produced and used by different engineering
applications throughout the entire production
processes.
For implementing such a system, we need a
client-server architecture that allows the appropriate
database management system (e-Server) to be
connected to the quality control database in
information layer as shown in Figure 3.
Figure 3: Client server architecture.
ICEIS 2007 - International Conference on Enterprise Information Systems
160

Statistical e-based quality controller utilizes
statistical e-server to perform all data access,
transformation, analyses and output creation.
e-Server is a module used for statistical analysis
and seamless integration of new or existing
applications. Users request an action from within the
graphical user interface in a browser (the
presentation layer) by hitting a button, selecting a
menu or completing a form. Once the request is
received by the presentation layer, the presentation
layer (Active Server Pages) handles the request and
directs it to the application (Business Logic
Application layer) for processing. The application
processes the request and determines appropriate
actions needed to complete the request via
interaction between e-based quality control
application and e-server. For computation, analysis
and graphics (SPC charts), the application analyses
data with the help of database to response the
request via ODBC tools. After directing the requests
to this platform, computations performed and results
return in the form of HTML table or data file to the
reporting tools (i.e. accept data from the application,
process the request, generating an SPC chart, and
return the resulting graph in the form of image file
or HTML, check SPC rules and make alarm by
sending rule violation information to the
application).
It should also be able to perform real-time display of
quality control charts to monitor processes. It should
be a flexible, full-featured analysis required for
continuous quality improvement. Data preprocessing
procedure for customer analysis tracks various
online activities of customers. This involves
capturing information about individual user,
constructing logical user “session”, and creating key
terms or variables. For a DMS, our model captures
key terms of the quality information on assembled
products (AP), sub-assembled products (SAP) and
parts or components (P). To implement a
mathematical model of e-QC layer, we present
internal blocks of e-based quality control module as
shown in Figure 4.
In order to supply the controller itself with the
complete information about the current process state,
a detector unit is introduced which receives the
measurement M
kl
t
(i) for frequency of n times, and
passes the state information S
kl
t
(i) to the controller.
The measurement at the end of each sub-process is
received only in the step of the work-pieces that are
passing through and the control output is
determined. (Where k is sub-process number, l is
location number, i is attribute number and t is time
period). The control problem is now to find a
controller output C
kl
t
(i). In general, this may need
a sequence steps until Ref
k
(i) can finally be
reached. A process is called controllable in one step
for any given state S
kl
t
(i), if the measurement M
kl
t
(i) can reach the reference value Ref
k
(i) such that:
Lim | Ref
k
(i) - M
kl
t
(i) | → 0
3 STATISTICAL QUALITY
PROFILE
In this section, a mathematical model is introduced
to provide a real time display of quality profile. The
following notations are considered.
Notations:
w
i
attribute i
M
kl
t
(i) measurements vector at time t in shop
floor l for process k on attribute i
S
kl
t
(i) state information at time t in shop floor l
for process k on attribute i
Ref
k
(i) reference value for process (product) k
on attributes i
f
k
ijl
frequency of quality key attribute i for
process k at location l in product j
LSL
k
(i) lower specification limit for process k on
attribute i
USL
k
(i) upper specification limit for process k on
attribute i
LCL
k
lower control limit for process k
CL
k
central control limit for process k
UCL
k
upper control limit for process k
k
σ
Standard deviation for process k
M number of key attribute
N number of products
P number of locations
T time period duration
C
kl
t
(i) control chart vector [LCL
k
,CL
k
,UCL
k
] at
time t in shop l for process k on
attribute i
The quality information is captured individually for
each part and compiled collectively from the set of
assembled or sub-assembled products. As a result of
tracking the quality of each product, we obtain the
vector of comprehensive key terms or key words on
quality; QW =
[
]
12
,,,
m
ww w⋅⋅⋅
. The quality
information is collected through electronic customer
interaction on the web. We define QM (t) =
DESIGNING AN E-BASED REAL TIME QUALITY CONTROL INFORMATION SYSTEM FOR DISTRIBUTED
MANUFACTURING SHOPS
161

[
]
pnm
ijl
f
××
as a quality space at time t, where f
ijl
is the
frequency of quality keyword i related to product j
and location l. We also define FQM (t) =
[
]
pnm
ijl
××
α
as a fuzzy quality space at time t, where
ijl
α
is a corresponding keyword-product-location
fuzzy membership value as shown in formula (0).
3
111 111
()
ijl ijl ijl ijl
ijl
MN P MNP
ijl ijl ijl ijl ijl ijl
ijl ijl
fff f
f
ff fff
α
=== ===
=××=
∑∑∑ ∑∑∑
(0)
The ratio
1
ijl
M
ijl
i
f
f
=
∑
can be viewed as a reliability value
for quality keyword w
i
in the product-location
incidence matrix, and the ratio
1
ijl
N
ijl
j
f
f
=
∑
as a reliability
value for product j in the keyword-location
incidence matrix, and the ratio
1
ijl
P
ijl
l
f
f
=
∑
as a reliability
value for location
l
in the keyword-product
incidence matrix, and finally
ijl
α
will be the
reliability of quality information in the quality
keyword-product-location space. Tracking by time
could produce a set of fuzzy values:
ijl
α
(T)
=
[
]
ijl
T
ijlijl
ααα
,,,
21
⋅⋅⋅
. This vector shows the
profile of the quality space. For sub-assembled
products (SAP), the final fuzzy value is
{
}
{
}
)(,)(maxmin)( SAPpSAP
ijlijlijl
α
α
α
=
.
Where
)()( SAPp
ijlijl
α
α
∈
as a required
components to SAP. For assembled product (AP),
the final value is considered as:
{
}
{
}
{
}
)(,)(max,)(maxmin)( APSAPPAP
ijlijlijlijl
α
α
α
α
=
,
where
)(P
ijl
α
and
)(SAP
ijl
α
are immediate
predecessor to AP. As for quality key terms, the
formulation (1) is used for an individual location and
formulation (2) for a combination of locations.
T
CL
t
ijl
T
t
α
∑
=
=
1
(1)
for
nj ,,2,1 L=
11
.
TP
t
ijl
tl
CL
TP
α
==
=
∑
∑
(2)
for
nj ,,2,1 L
=
As for quality on total attributes, we consider
formulation (3) for an individual location and
formulation (4) for a combination of locations.
11
.
TM
t
ijl
ti
CL
TM
α
==
=
∑
∑
(3)
for
nj ,,2,1 L
=
111
..
TMP
t
ijl
til
CL
TMP
α
===
=
∑
∑∑
(4)
for
nj ,,2,1 L
=
As a result of tracking the quality profile, the
Equations (5) and (6) are used for obtaining process
control limit.
k
kk
CLUCL
σ
3+= (5)
k
kk
CLLCL
σ
3−= (6)
Where
k
σ
is the standard deviation of process k.
The controller applies the control chart vector as
given in Equation (7).
],,[)(
kkkkl
t
UCLCLLCLiC = (7)
The statistical reports are drawn graphically by e-
Server on internet browser of shop floor and quality
engineer could achieve the appropriate policy.
4 DISTRIBUTED QUALITY
MANAGEMENT
USING EVOLUTIONARY
ALGORITHM
Quality management for an enterprise wide e-based
QC system focuses on analyzing data to make
decisions that affect future production and revenue.
The analysis includes real-time enterprise wide view
that identifies the levels of operations, and batch
report according to predetermined time period. We
ICEIS 2007 - International Conference on Enterprise Information Systems
162

can apply the evolutionary rule to automatically
modify the structure of e-based quality information.
It updates the quality profile in a dynamic fashion.
The following steps are suggested as an evolutionary
algorithm.
Step 0. Set T=0.
Step 1. Obtain the quality information profile using
e-QC.
Step 2. Apply distributed quality management and
quality decision making policy to modify quality
structure.
Step 3. Implement feasibility analyzer for quality
decision-making.
Step 4. Set T=T+1.
Step 5. Update the e-based quality network profile
and go to step1.
As time passes, new attributes in the quality
information space profile can be generated. In the
newly generated profiles, some attributes may take a
value beyond the lower or upper bound of the range
of variables appropriate for quality decision-making.
Then the feasibility analyzer is used to check the
feasibility boundary of attributes. New attributes are
collected and stored to form a meta-decision
support.
5 CONCLUSIONS
In this paper, we introduced a framework of e-based
quality management and developed a new
formulation that would provide a web-based solution
for real time control of a process. The suggested
logic is useful when we want to use a wide variety of
quality characteristics as key attributes. As a result
of using statistical e-based quality profile, anyone in
an enterprise can contribute to quality improvement
efforts. Web-enabled quality control system will
present an extensive connectivity outside a plant. A
customer’s engineer could tour the plant site and
check the profile online. It is used mostly within a
factory today, but after some advancement, and with
the process in place, access to quality data will be
extended across the supply chain and to customers.
One should be able to obtain information about the
batch s/he ordered and see how it conforms to the
specifications. Based on the research and framework
done in the distributed manufacturing systems, we
developed an analytical approach on e-based quality
control. For a customer interface and reliable and
sustainable information provision, an evolutionary
algorithm is suggested using evolutionary rule. The
prototype of eRTQCIS-DMS has been demonstrated
that quality management data can be captured,
stored, retrieved and disseminated through a web-
based system.
The internet technologies also facilitate the
sharing of quality management information in a
seamless manner. Reports containing consolidated
quality management information can be generated
by eRTQCIS-DMS. With those information and
reports, manufacturer would have a better
understanding about the product quality and
performance evaluation. A mathematical model for
an e-based statistical control on the basis of e-based
quality profile can be elaborated in future
researches.
REFERENCES
Ka Chi Lam, S. Thomas Ng., (2006). A cooperative
Internet-facilitated quality management environment
for construction, Automation in Construction, 15(1),
1-11.
Molina, A., Al-Ashaab, A., Ellis, T., & Young, R. (1995).
A review of computer-aided simultaneous engineering
systems. Research in Engineering Design, 7, 38–63.
Rodriguez, K., & Al-Ashaab, A. (2002). A review of
internet based collaborative product development
systems. Proceedings of the International Conference
on Concurrent Engineering: Research and
Applications, Canfield, UK.
Rodriguez, K. & Al-Ashaab, A.(2005). Knowledge web-
based system architecture for collaborative product
development, Computers in Industry, 56, 125-140.
Sangyoon C., Kyungrai Kim, Yea-Sang Kim. (2004), A
process-based quality management information
system, Automation in Construction, Vol 13, 241– 259
Vijayaram, T.R. , Sulaiman, S. Hamouda A.M.S. , Ahmad,
M.H.M. (2006) , Foundry quality control aspects and
prospects to reduce scrap rework and rejection in
metal casting manufacturing industries , Journal of
Materials Processing Technology, 178(1-3), 39-43.
DESIGNING AN E-BASED REAL TIME QUALITY CONTROL INFORMATION SYSTEM FOR DISTRIBUTED
MANUFACTURING SHOPS
163
