
RELEVANCE FEEDBACK AS AN INDICATOR
TO SELECT THE BEST SEARCH ENGINE
Evaluation on TREC Data
Gilles Hubert and Josiane Mothe
Institut de Recherche en Informatique de Toulouse, 118 route de Narbonne, F-31062 Toulouse Cedex 9, France
and ERT34, IUFM, 79 av. de l'URSS, F-31079, Toulouse, France
Keywords: Information Retrieval, relevance feedback, system selection, system fusion.
Abstract: This paper explores information retrieval system variability and takes advantage of the fact two systems can
retrieve different documents for a given query. More precisely, our approach is based on data fusion (fusion
of system results) by taking into account local performances of each system. Our method considers the
relevance of the very first documents retrieved by different systems and from this information selects the
system that will perform the retrieval for the user. We found that this principle improves the performances
of about 9%. Evaluation is based on different years of TREC evaluation program (TREC 3, 5, 6 and 7),
TREC-adhoc tracks. It considers the two and five best systems that participate to TREC the corresponding
year.
1 INTRODUCTION
Evaluation programs have pointed out a high
variability on information retrieval system (IRS)
results. (Harman, 1994; Buckley & Harman, 2004)
shows for example that system performance is topic-
dependant and that two different systems can
perform differently for a same topic or information
need.
Table 1 illustrates this through local and global
performances of two different IRS that participated
to the 7
th
session of the. TREC (Text REtrieval
Conference) evaluation program. The results of both
systems (runs) respectively labelled
CLARIT98COMB and T7miti1 are displayed. The
performances are estimated according to usual
evaluation measures used in evaluation frameworks
such as TREC. These measures are the Mean
Average Precision (MAP) computed as the mean of
average precisions over a set of queries, and the
precision at n (P@n) computed as the precision after
n retrieved documents (n takes usually the values 5,
10, 15, 20, 30, 100, 200, 500, and 1000).
Local performance corresponds to the one
obtained for two given TREC 7 ad-hoc topics (Table
1a) whereas global performance corresponds to the
one when averaged over a set of 50 topics (Table
1b). Table 1a) shows that if it was possible to
automatically predict that the run CLARIT98COMB
is better than the run T7miti1 for topic 352 and
T7miti1 better than CLARIT98COMB for topic 354,
then MAP could be improved when averaged over
the topics. Furthermore, there are numerous topics
where CLARIT98COMB and T7miti1 have
alternately the best MAP. This adds interest to
automatically predict the system leading to the best
results for a given topic.
In this paper, the hypothesis we make is that
prediction can be based on the relevance of the very
first retrieved documents. As relevance feedback,
the principle is to evaluate the first retrieved
documents. However, in relevance feedback,
relevant documents are used to select new terms to
add to the initial query. In our approach, the relevant
documents are used to order systems. The best
system is then selected to treat the current query.
2 RELATED WORKS
(Fox & Shaw, 1994) consider different sub-
collections of TREC 2 and combine different search
strategies in different ways. They show that fusing
results of different searches improves performances
184
Hubert G. and Mothe J. (2007).
RELEVANCE FEEDBACK AS AN INDICATOR TO SELECT THE BEST SEARCH ENGINE - Evaluation on TREC Data.
In Proceedings of the Ninth International Conference on Enterprise Information Systems - ISAS, pages 184-189
DOI: 10.5220/0002361301840189
Copyright
c
SciTePress

compared to single searches. One of the best fusing
technique is CombSUM which consists in adding the
document-query similarity values.
Table 1: Local and global performances for two systems
from ad-hoc TREC 7.
a) Local performances for 2 topics and 2 systems
from TREC 7 ad-hoc.
Topic 352
Run
CLARIT98COMB T7miti1
Retrieved documents 1000 210
Relevant documents 246 246
Relevant documents
retrieved
216 117
Map 0.5068 0.3081
P@5 1.0000 0.6000
P@10 1.0000 0.7000
P@15 0.9333 0.6000
P@20 0.8000 0.6500
Topic 354
Run
CLARIT98COMB T7miti1
Retrieved documents 1000 486
Relevant documents 361 361
Relevant documents
retrieved
124 190
Map 0.1675 0.2767
P@5 1.0000 0.4000
P@10 1.0000 0.3000
P@15 1.0000 0.3333
P@20 0.8500 0.4500
b) Global performances for 2 systems from TREC
7 ad-hoc.
CLARIT98COMB T7miti1
Map 0.3702 0.3675
P@5 0.6920 0.6640
P@10 0.6940 0.6400
P@15 0.6613 0.6213
P@20 0.6180 0.5780
(Lee, 1997) shows that CombSUM is particularly
efficient when it is based on the level of overlapping
sets of relevant and non-relevant document
retrieved. He shows that fusing two systems that
have a high degree of overlapping of relevant
documents is more efficient than fusing two systems
that have a high degree of overlapping of non–
relevant documents.
The study presented in (Beitzel et al., 2003) leads
to different conclusions. It shows that improvement
is related to the number of relevant documents that
occur in a single retrieved set rather than on the
overlapping degree of the different sets.
Like in these approaches, the method we present
in this paper considers different systems, but as
opposed to the data fusion techniques that combine
different system results, our approach rather select
the system that will conduce the search. The selected
system can differ from one query to the other. The
best system is selected considering relevance-
feedback principle.
3 FUSING METHOD AND
EVALUATION FRAMEWORK
3.1 Fusing System Results Based on
Highly Relevant Documents
Our method is based on several systems that retrieve
in parallel documents. The top documents retrieved
by each system are analysed. Based on the relevance
of these top documents, one system is selected to
retrieve the documents for the user.
Algorithm 1: Selecting the best system.
For each topic T
j
For each system S
i
Search documents
Consider the n first retrieved documents to
the user for relevance evaluation
Compute precision at n documents (P@n)
End For
Order systems per decreasing P@n
Select the first system
Retrieve documents to the user using this
selected system
End For
3.2 TREC Evaluation Framework
Text REtrieval Conference provides benchmark
collections. Ad-hoc track in TREC corresponds to
the case when a user expresses his information need
and expects the relevant documents to be retrieved.
This track started at the first TREC session
(TREC 1). For that reason, there are several ad-hoc
collections available now.
A ad-hoc collection consists of a document set, a
query set (50 topics) and the set of relevant
documents for each of the queries (called qrels).
TREC participants send the documents their
system retrieves for each query of the current
RELEVANCE FEEDBACK AS AN INDICATOR TO SELECT THE BEST SEARCH ENGINE - Evaluation on TREC
Data
185

session (or year). This is called a “run”. Each run is
then evaluated according to the qrels.
Table 2 provides details on the collections and
systems that participate at the corresponding session.
Table 2: TREC collection features.
Session TREC3 TREC5 TREC6 TREC7
Topics 151-200 251-300 301-350 351-400
# runs 48 48 74 103
System performance is evaluated considering to
different criteria which are detailed in (Voorhees &
Harman, 2001) and computed thanks to the trec_eval
tool. Mean Average Precision (MAP) is one of the
most used criteria to compare systems among them.
P@5 is also a usual criterion. It is related to high
precision and corresponds to the system precision
when 5 documents are retrieved.
4 RESULTS
We applied the method we suggest first using the
two best systems (the ones that get the best MAP in
the corresponding TREC session) and then using the
five best systems. Results are presented in table 3
and 4 and in sections 4.1 and 4.2 respectively.
4.1 Fusing the Two Best Systems
In this section, we consider the two best systems (the
ones that get the best MAP in the corresponding
TREC session). For each topic, depending on the
P@5 value, one or the other system is selected to
retrieve documents to the user.
Table 3 presents the results, where « Optimal »
corresponds to the MAP if, for each query, we could
have chosen the best system. Thus it corresponds to
the maximum MAP any system could obtain when
selecting the best system for each query among the
systems. In this table, we detail the 5 first topics as
well as average over the topic set. On the different
rows, data in brackets corresponds to the variation in
percentage when compared with the best system of
the session. For example, regarding TREC 3 and the
first query, Inq102 gets the best MAP and is selected
for that query when computing the “optimal” value.
When averaged over the queries, this optimal
technique would obtain MAP of 0.4647, which
corresponds to an improvement of 9.96% compared
to the best system that year (Inq102 obtained
0.4226).
Table 3: Local and Global MAP when considering the two
best systems.
TREC3
Inq102 (1
st
) Citya1 Optimal Fusion
Local
(first five
queries)
0.6259
0.2699
0.1806
0.7372
0.2504
0.5783
0.5667
0.2681
0.7354
0.0035
0.6259
0.5667
0.2681
0.7372
0.2504
0.6259
0.5667
0.2681
0.7372
0.2504
Global 0.4226 0.4012 0.4647
(+9.96%)
0.4576
(+8.28%)
TREC5
ETHme1 (1
st
)
Uwgcx1 Optimal Fusion
Local
(first five
queries)
0.0673
0.0453
0.6813
0.3262
0.1660
0.2215
0.0932
0.8600
0.2909
0.0543
0.2215
0.0932
0.8600
0.3262
0.1660
0.2215
0.0453
0.6813
0.3262
0.1660
Global 0.3165 0.3098 0.3900
(+23.22%)
0.3684
(+16.40%)
TREC6
uwmt6a0 (1
st
)
CLAUG Optimal Fusion
Local
(first five
queries)
0.3185
0.7671
0.6556
0.5000
0.0302
0.4753
0.5819
0.6779
0.2599
0.0600
0.4753
0.7671
0.6779
0.5000
0.0600
0.4753
0.7671
0.6556
0.2599
0.0600
Global 0.4631 0.3742 0.5079
(+9.67%)
0.4773
(+3.04%)
TREC7
CLARIT98
COMB (1
st
)
T7miti Optimal Fusion
Local
(first five
queries)
0.7112
0.5068
0.4281
0.1675
0.4555
0.8366
0.3081
0.3388
0.2767
0.5429
0.8366
0.5068
0.4281
0.2767
0.5429
0.7112
0.5068
0.3388
0.1675
0.5429
Global 0.3702 0.3675 0.4341
(+17.26%)
0.4069
(+9.91%)
In table 3, « Fusion » indicates the MAP that is
obtained automatically by our method. The system
that is selected for a query is the one that obtained
the best P@5. For example, regarding TREC 3 and
the first query, Inq102 obtained a better P@5 than
Citya1; for that reason, it is selected to treat the first
query. When averaged over the 50 queries, this
fusion technique obtains MAP 0.4576, which
corresponds to an improvement of 8.28% compared
to Inq102, which was the best system that year in
terms of MAP.
Whatever the collection (TREC session), when
averaged over the 50 queries, MAP after fusion is
better than the MAP obtained by the two systems
separately. Regarding the automatic method, MAP is
improved of more than 8% in most cases (+8.28%
TREC 3; +16.40% TREC 5; +9.91% TREC 7).
ICEIS 2007 - International Conference on Enterprise Information Systems
186
However, we can quote a variability of the
improvement over the years. Indeed, improvement is
lower when considering TREC 6 (+3.04%). One
hypothesis for this lower improvement is related to
the high initial performances of the best system that
year (MAP of 0.4631). This hypothesis is supported
by the results obtained using the other TREC
collections. In TREC 5, the best system gets 0.3165
MAP and our fusion method leads to MAP 0.3684,
which corresponds to an improvement of 16.40%
compared to the best system that year. The best
system in TREC 7 gets 0.3702 and our method
obtained 0.4069 (+9.91%); in TREC 3 the best MAP
is 0.4226 and we obtain 0.4576 (+8.28%). Finally
the best MAP in TREC 6 is 0.4631 and our method
gets 0.4773 (+3.04%). The first hypothesis is that the
lower initial results, the higher improvements. An
additional hypothesis could be that variability in
results is lower when MAP is high. However, a
further analysis performed in this direction has not
fully supported this second hypothesis.
Table 3 shows that when considering the first 5
topics, generally, the automatic selection is relevant.
For example in TREC 3 our selection method selects
the right system for the 5 queries; in TREC 5 3
choices over 5 are correct.
Note that initial MAP the different systems get
does not give indication on how the fusion will
perform. For example, when considering TREC 5,
the difference between the two best systems
ETHme1 and Uwgcx1 is 0.0067. However, fusing
their results is very effective (potentially, fusing
these two systems can improve by more than 23%
MAP and our method leads to improve the results
more than 16%). On the opposite, regarding TREC 6
collection, the difference between the two best
systems, uwmt6a0 and CLAUG, is of 0.0889;
however, fusing these two systems could lead to a
10% improvement and our method improves of
about 3%. This could be explained by the
distribution of topics according to the system that
obtains the best result. Indeed, regarding TREC 5,
the topics are divided nearly equitably when
considering the two best systems ETHme1 and
Uwgcx1. ETHme1 is the best for 52% of the topics
and Uwgcx1 is the best for 48% of the topics. On the
opposite, regarding TREC 6 the topics are not
divided equitably between the two best systems
uwmt6a0 and CLAUG. The system uwmt6a0 is the
best for 60% of the topics.
0
0,1
0,2
0,3
0,4
0,5
0,6
0,7
0,8
0,9
1
151
154
157
160
163
166
169
172
175
178
181
184
187
190
193
196
199
optimal fusion
TRE C3
Ma p
Query
0
0,2
0,4
0,6
0,8
1
1,2
251
254
257
260
263
266
269
272
275
278
281
284
287
290
293
296
299
optimal fusion
TRE C5
Ma p
Query
0
0,2
0,4
0,6
0,8
1
1,2
301
304
307
310
313
316
319
322
325
328
331
334
337
340
343
346
349
optimal fusion
TRE C6
Ma p
Query
0
0,1
0,2
0,3
0,4
0,5
0,6
0,7
0,8
0,9
1
351
354
357
360
363
366
369
372
375
378
381
384
387
390
393
396
399
optimal fusion
TRE C7
Ma p
Query
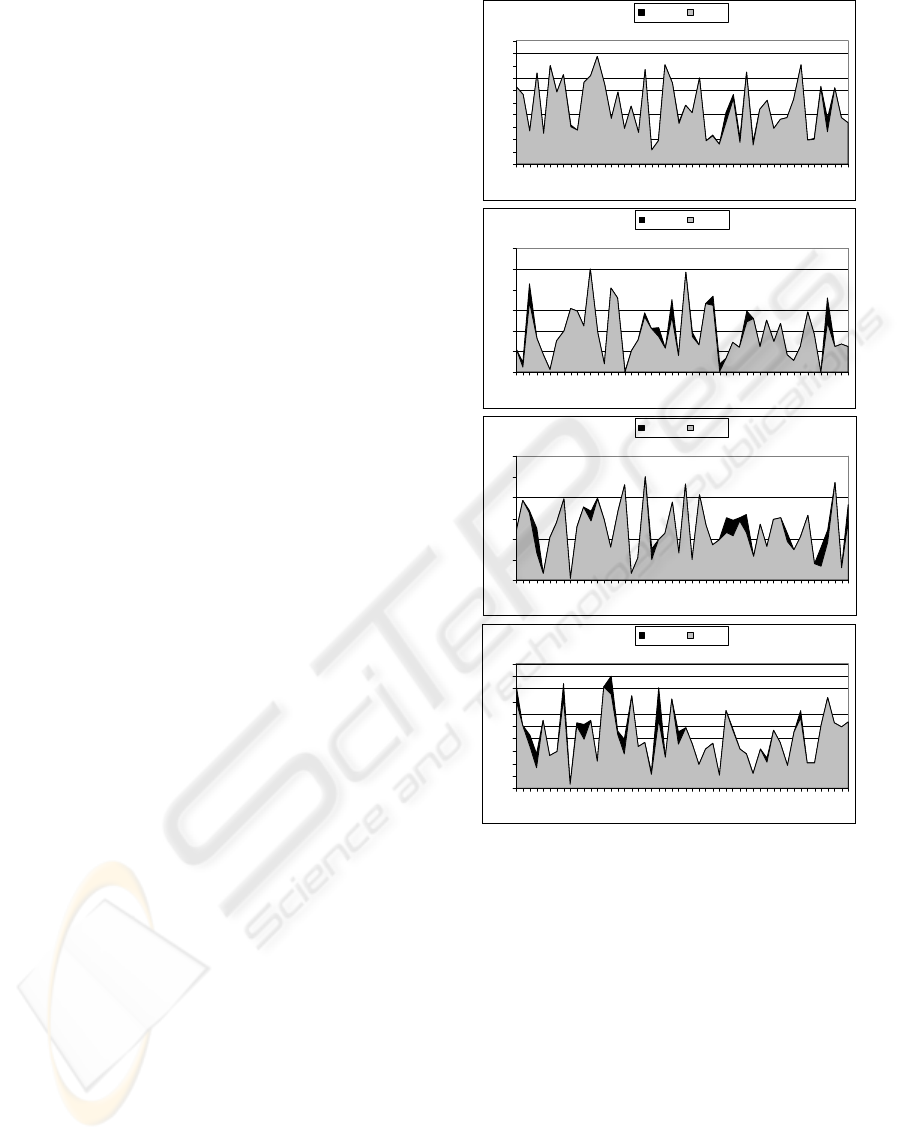
Figure 1: Local performances when fusing the 2 best
systems with regard to the optimal possibility.
Figure 1 illustrates the difference between the
optimal fusing possibility and our method that fuses
the two best systems. We show the results according
to the different TREC collections. We can see that
there are much more points for which the optimal
curve and fusion curve differ for TREC 6 and TREC
7 than for TREC 3 and TREC 5. Indeed, results
obtained with our fusing method are closer to the
optimal possibility for TREC 3 (about 17% under
the optimal value) and TREC 5 (about 30% under
the optimal value) collections.
RELEVANCE FEEDBACK AS AN INDICATOR TO SELECT THE BEST SEARCH ENGINE - Evaluation on TREC
Data
187
4.2 Fusing the Five Best Systems
In this section, we study the effect of using more
systems in our fusing method. We consider the five
best systems with regard to MAP for each TREC
session.
One first comment is that potentially,
improvements can be much higher. For example
regarding TREC 3, using two systems could lead at
a maximum of about 0.46 for MAP, which
corresponds to an improvement of about 10%
compared to the best system. When using five
systems, the maximum MAP could be of about 0.48,
which corresponds to about 14% of improvement
compared to the best system. The same type of
difference between using two and five systems
occurs in all the TREC sessions.
However, when applying our automatic method
to select the best system, then the difference using
two or five systems is smaller. For example,
regarding TREC 3, our method obtained the same
MAP when using two or five systems (0.4576 using
two systems and 0.4593 using five). However,
regarding TREC 5, MAP is of 0.3684 (+16.40%
compared to the best system) using two systems but
reaches 0.3786 (+19.62%) using five systems. It is
important to notice that using more systems is more
efficient when initial MAP are low (e.g. TREC 5).
Table 4: Global MAP considering the five best systems.
Global MAP
Best run Optimal Fusion
TREC3 0.4226 0.4837
(+14.46%)
0.4593
(+8.68%)
TREC5 0.3165 0.4128
(+30.43%)
0.3786
(+19.62%)
TREC6 0.4631 0.5217
(+12.65%)
0.4703
(+1.55%)
TREC7 0.3702 0.4820
(+30.20%)
0.4067
(+9.86%)
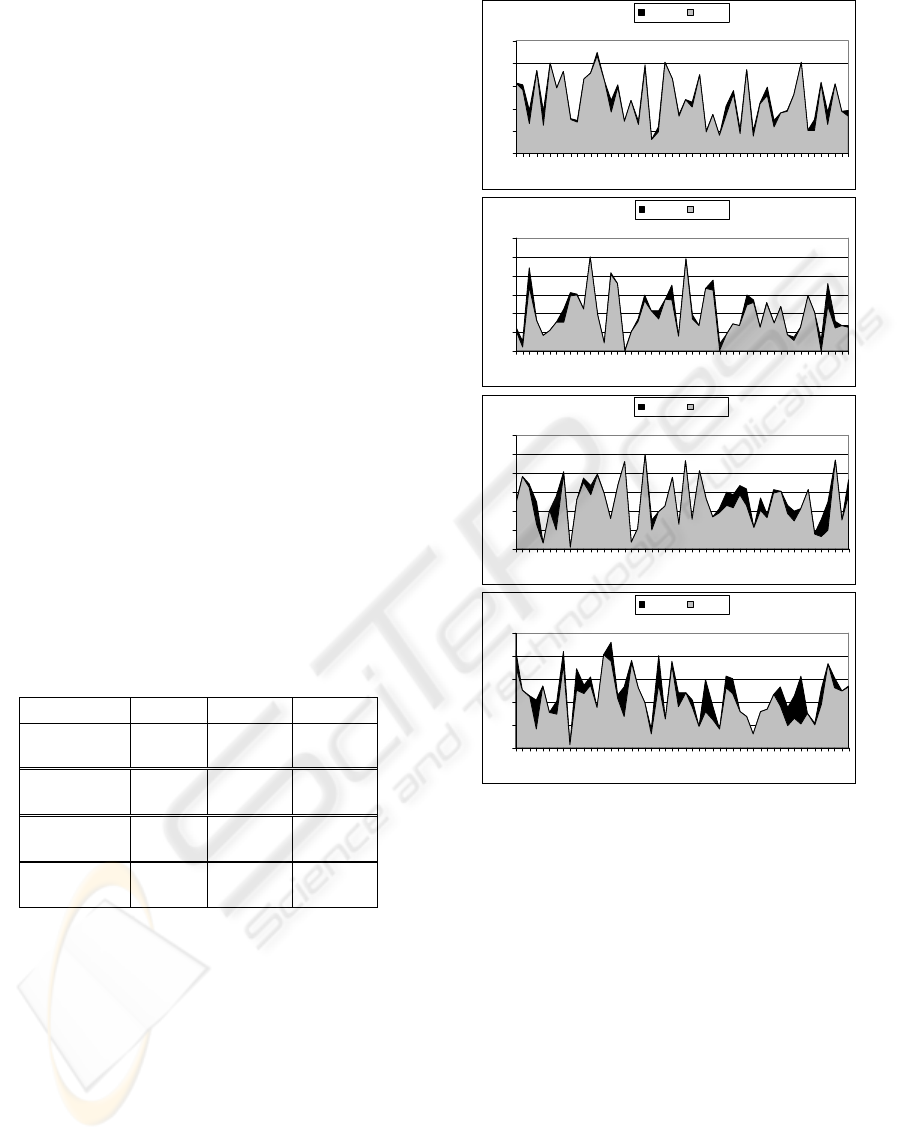
Figure 2 illustrates the difference between the
optimal fusing possibility and our method fusing the
five best systems according to the different TREC
collections. As for fusion of two systems (cf Figure
1), more differences can be observed between
optimal curve and fusion curve for TREC 6 and
TREC 7 than for TREC 3 and TREC 5. Indeed,
results obtained with our fusing method are closer to
the optimal possibility for TREC 3 (about 40%
under the optimal value) and TREC 5 (about 35%
under the optimal value) collections. Differences
between fusing method and optimal possibility are
stronger when fusing the five best systems than
when fusing only the two best systems.
0
0,2
0,4
0,6
0,8
1
151
154
157
160
163
166
169
172
175
178
181
184
187
190
193
196
199
optimal fusion
Ma p
Quer y
TRE C 3
0
0,2
0,4
0,6
0,8
1
1,2
251
254
257
260
263
266
269
272
275
278
281
284
287
290
293
296
299
optimal fusion
Ma p
Quer y
TRE C 5
0
0,2
0,4
0,6
0,8
1
1,2
301
304
307
310
313
316
319
322
325
328
331
334
337
340
343
346
349
optimal fusion
Ma p
Query
TRE C 6
0
0,2
0,4
0,6
0,8
1
351
354
357
360
363
366
369
372
375
378
381
384
387
390
393
396
399
optimal fusion
Ma p
Query
TRE C 7
Figure 2: Local performances when fusing the 2 best
systems with regard to the optimal possibility.
5 CONCLUSIONS
In this paper, we consider a new IR system fusing
method. This method is based on system selection
rather than on fusing system results. We first
consider the perfect fusion in which the correct
system is manually chosen in order to know what is
the potential of the method. Even if we use the best
systems in our method (ie. the systems that get the
best MAP), we show that potentially MAP could be
improved of about 15% (average results over the
TREC sessions) when using two systems and about
22% when using five systems. This corresponds to
the maximum of improvement we could get when
selecting correctly the systems. Using our method
ICEIS 2007 - International Conference on Enterprise Information Systems
188

based on P@5 we obtained on average 9.4% of
improvement when using two systems and 9.9%
when using five systems. These results lead to two
main conclusions: the method we present is efficient
however, there is room for more improvements,
specifically using more systems.
In a further analysis, we have explored the
hypothesis according to which variability in results
is lower when MAP is higher. This hypothesis
would support the fact that there is more potentiality
to fuse the best systems using our method when the
task is difficult. However this analysis has led to the
conclusion that there is no direct correlation between
the variability in each query considered individually
and the possibility for our method to improve the
results.
Future works will investigate different directions.
First, our approach is based on precision at 5 (P@5);
we would like to analyse the effect of the number of
documents chosen in order to see if fewer
documents would be enough. A second direction
concerns evaluation. We would like to consider
residual collection evaluation, that means that we
would delete judged documents when evaluate the
results. This will be crucial if we want to consider
other performance measures such as high precision.
Longer term studies concern first a way to predict
the effectiveness of the method. We show that
variability is not a good predictor of that but other
direction have to be explored and probably
combined such as the number of retrieved
documents, the type of query, the models used in the
search engines considered, etc.. Finally another
future work is related to different fusion techniques.
We would like to consider different query features in
order to predict which system would be the best to
select to treat the query. This could be combined
with relevance information as studied in this paper.
(He & Ounis, 2003) and (Mothe & Tanguy, 2005)
open tracks in this direction considering query
difficulty prediction as a clue to perform better
information retrieval.
ACKNOWLEDGEMENTS
This work was carried out in the context of the
European Union Sixth Framework project “Ws-
Talk”.
We also want to thanks Yannick Loiseau for his
participation in programming.
REFERENCES
Harman, D., 1994. Overview of the Third Text REtrieval
Conference (TREC-3), 3
rd
Text Retrieval Conference,
NIST Special Publication 500-226, pp 1-19.
Beitzel, S. M., Frieder, O., Jensen, E. C., Grossman, D.
Chowdhury A., Goharian, N., 2003. Disproving the
fusion hypothesis: an analysis of data fusion via
effective information retrieval strategies. SAC'03,
ACM symposium on Applied computing, pp. 823-827.
Buckley, C., Harman, D., 2004. The NRRC reliable
information access (RIA) workshop. 27
th
International
ACM SIGIR Conference on Research and
Development in Information Retrieval, pp. 528-529.
Fox E. A., Shaw, J. A., 1994. Combination of Multiple
Searches. 2
nd
Text Retrieval Conference (TREC-2),
NIST Special Publication 500-215, pp. 243-252.
He, B., Ounis, I., 2003. University of Glasgow at the
Robust Track – A query-based Model Selection
Approach for Poorly-performing Queries. 12
th
Text
Retrieval Conference (TREC-12), NIST Special
Publication 500-255, pp. 636-645.
Lee, J., 1997. Analysis of multiple evidence combination.
22
th
International ACM SIGIR Conference on
Research and Development in Information Retrieval,
pp. 267-276.
Mothe, J., Tanguy, L., 2005. Linguistic features to predict
query difficulty - A case study on previous TREC
campaign. SIGIR workshop on Predicting Query
Difficulty - Methods and Applications, pp. 7-10.
Voohrees E., Harman, D., 2001. Overview of TREC 2001.
10
th
Text Retrieval Conference, NIST Special
Publication 500-255, pp. 1-15.
RELEVANCE FEEDBACK AS AN INDICATOR TO SELECT THE BEST SEARCH ENGINE - Evaluation on TREC
Data
189
