
AN INSTRUMENT FOR THE DEVELOPMENT OF THE
ENTERPRISE ARCHITECTURE PRACTICE
Marlies van Steenbergen, Martin van den Berg
Architecture & Business Solutions, Sogeti Netherlands B.V., The Netherlands
Sjaak Brinkkemper
Department of Information and Computing Sciences, Utrecht University, The Netherlands
Keywords: Enterprise Architecture, Maturity models, Architecture Maturity Matrix, Software Process improvement.
Abstract: In this paper we introduce an architecture maturity model for the domain of enterprise architecture. The
model differs from other existing models in that it departs from the standard 5-level approach. It
distinguishes 18 factors, called key areas, which are relevant to developing an architectural practice. Each
key area has its own maturity development path that is balanced against the maturity development paths of
the other key areas. Two real-life case studies are presented to illustrate the use of the model. Usage of the
model in these cases shows that the model delivers recognizable results, that the results can be traced back
to the basic approach to architecture taken by the organizations investigated and that the key areas chosen
bear relevance to the architectural practice of the organizations.
1 MATURITY IN ENTERPRISE
ARCHITECTURE
Increasing complexity in the overall information
systems portfolio of an organization, and especially
in the integration of information systems, requires
enterprise architecture as a guiding principle. For
this to work, sound architectural practices have to be
implemented.
Enterprise architecture, however, is a relatively
young field (Bucher et al, 2006), (Lankhorst et al,
2005). Architectural practices still have to be
established. There appears to be a need for an
instrument to support and accelerate this.
In this paper we will introduce such an
instrument. We will start with distinguishing three
basic types of architecture maturity models: the
staged 5-level models, the continous 5-level models
and the focus area oriented models. Enterprise
architecture being a relatively young discipline, we
feel that at the moment most organizations benefit
best from the focus area oriented model. We will
therefore introduce an architecture maturity matrix
that falls into this category.
1.1 Architecture Maturity Models
Most maturity models are concerned with software
development and maintenance. The most widely
used is CMM and all its variants (CMMI, 2002).
Recently some architecture maturity models have
been developed. These models are all based on the
generic 5-level maturity model used by CMM. Two
variants can be distinguished.
1. Staged 5-level models. These models distinguish
five levels of maturity. For each level a number
of focus areas are defined specific to that level.
These focus areas have to be implemented
satisfactorily for the organization to achieve that
particular level.
2. Continuous 5-level models. These models also
distinguish five general maturity levels and a
number of focus areas. The difference with the
first kind of models is that the focus areas are
not attributed to a level, but within each focus
area the 5 levels are distinguished.
Searching for models that were not build around
the standard five maturity levels, we also looked at
other process maturity models and found a third type
14
van Steenbergen M., van den Berg M. and Brinkkemper S. (2007).
AN INSTRUMENT FOR THE DEVELOPMENT OF THE ENTERPRISE ARCHITECTURE PRACTICE.
In Proceedings of the Ninth International Conference on Enterprise Information Systems - ISAS, pages 14-22
DOI: 10.5220/0002362300140022
Copyright
c
SciTePress
of model from test process improvement (Koomen
and Pol, 1999):
3. Focus area oriented models. These models
depart from the idea that there are five generic
maturity levels. Instead each focus area has its
own number of specific maturity levels. The
overall maturity of an organization is expressed
as a combination of the maturity levels of these
focus areas.
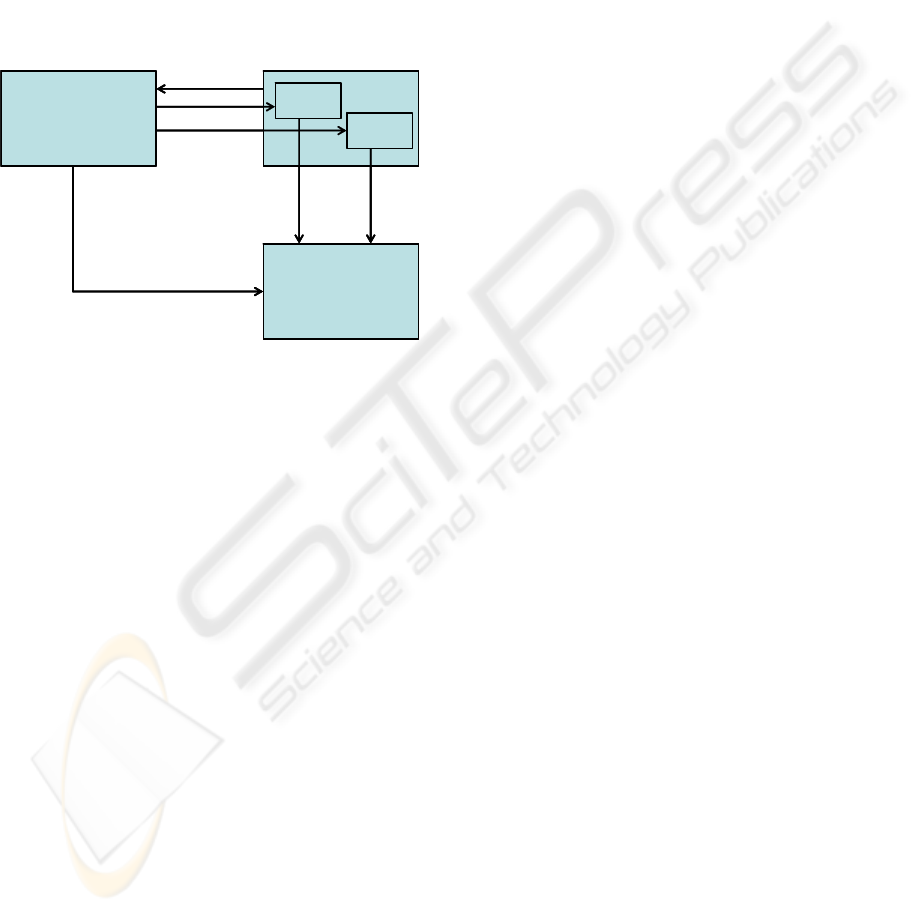
The differences between the types of models is
illustrated in figure 1.
Figure 1: Three kinds of architecture maturity models.
Looking at the three types of model, we prefer
the focus area oriented model because it allows a
more fine-grained approach, making it more suitable
to our purpose of developing and improving the
architectural practice, rather than merely assessing
its current maturity:
The focus area oriented model makes it
possible to distinguish more than five overall
stages of maturity. This results in smaller
steps between the stages, providing more
detailed guidance to setting priorities in
developing the architectural practice.
Departing from the five fixed maturity levels
makes the focus area oriented model more
flexible in defining both focus areas and
interdependencies between focus areas. In our
opinion this better fits the current state of
maturity of the architectural practice, where
complex combinations of many different
factors determine its success.
The application of the first two kinds of models
to architectural processes can be found in the
literature in various forms. The US Government
Accountability Office uses a staged model (GAO,
2003). Examples of the continuous model can be
found in (Appel, 2000), (METAgroup, 2001),
(NASCIO, 2003) and (Westbrock, 2004). The
continuous model may also be found as foundation
for various kinds of organization readiness
assessments like for instance the Net Readiness
Scorecard that measures the preparedness of an
organization to make use of the internet-based
economy (Hartman et al, 2000).
Application of the third kind of model to
architectural practice we have not encountered yet.
This is why we decided to develop a model based on
the third type ourselves, the architecture maturity
matrix.
Another approach to organizational
improvement is the balanced scorecard approach
(Kaplan and Norton, 1992). The balanced scorecard
is used to evaluate corporate performance, not only
on financial aspects but also on customer
perspective, internal processes and learning
capability. The balanced scorecard concept has also
been applied to the IS function (Martinsons et al,
1999). The main difference between the balanced
scorecard approach and the model presented in this
paper is that the balanced scorecard is concerned
with setting specific perfomance goals, while our
approach is concerned with how to reach such goals.
1.2 DYA
The development of the architecture maturity matrix
is part of a wider programme, called Dynamic
Architecture (DYA), of building a vision on how to
develop and improve an effective architectural
practice (Wagter et al, 2005), (Van den Berg and
Van Steenbergen, 2006). DYA is founded on the
following basic principles:
The architecture process is as important as the
architecture products. It is no use developing
perfect architectural products if no attention is
being paid to the embedding of these products
in the organization.
Architecture facilitates change. Architecture is
a management instrument intended to give
direction to the changes that are continuously
taking place in an organization.
Just enough, just in time architecture. The
development of architecture must be driven by
business needs.
Deviations from the architecture are allowed,
but in a controlled way. A process must be
implemented of managing justified deviations
from the architecture.
One of the important lessons we learned in the
DYA programme is that an architectural practice
Checkpoint
Focus area
Specific
1
23
1
2
3
Level
Generic
Checkpoint
Focus area
Specific
1
23
1
2
3
Level
Generic
AN INSTRUMENT FOR THE DEVELOPMENT OF THE ENTERPRISE ARCHITECTURE PRACTICE
15

within an organization, once it gets its first results, is
often swamped by requests, demands and high
expectations from both business management and IT
personnel. So much so, that they threaten to be
defeated by their own success, trying to take up
everything at once, thus being bogged down in
activities that over time do not appear to result in
true value for the company. It is this realization that
drove us to developing the maturity matrix to assist
in the development process of an architectural
practice, and especially, to assist in setting the right
priorities.
We have been using the maturity matrix over the
last five years in about 20 large organizations in
different sectors. In the remainder of this paper we
will discuss two of these cases, a manufacturing
company and a semi-governmental organization. We
will discuss major findings and lessons learned of
the cases studied. But first we will explain the
architecture maturity matrix in more detail in the
next section.
2 ARCHITECTURE MATURITY
MATRIX
In this section we explain the structure and use of
the enterprise architecture maturity matrix.
2.1 Structure of the Architecture
Maturity Matrix
Key element of our approach is the realization that
many factors determine the success of enterprise
architecture, but that at different points in time,
different aspects need attention. So we searched for
a model that would support this differentiation in
factors. We adopted the model from the Test Process
Improvement (TPI) model (Koomen and Pol, 1999).
We adopted the structure of the TPI model, but
translated it from test processes to architectural
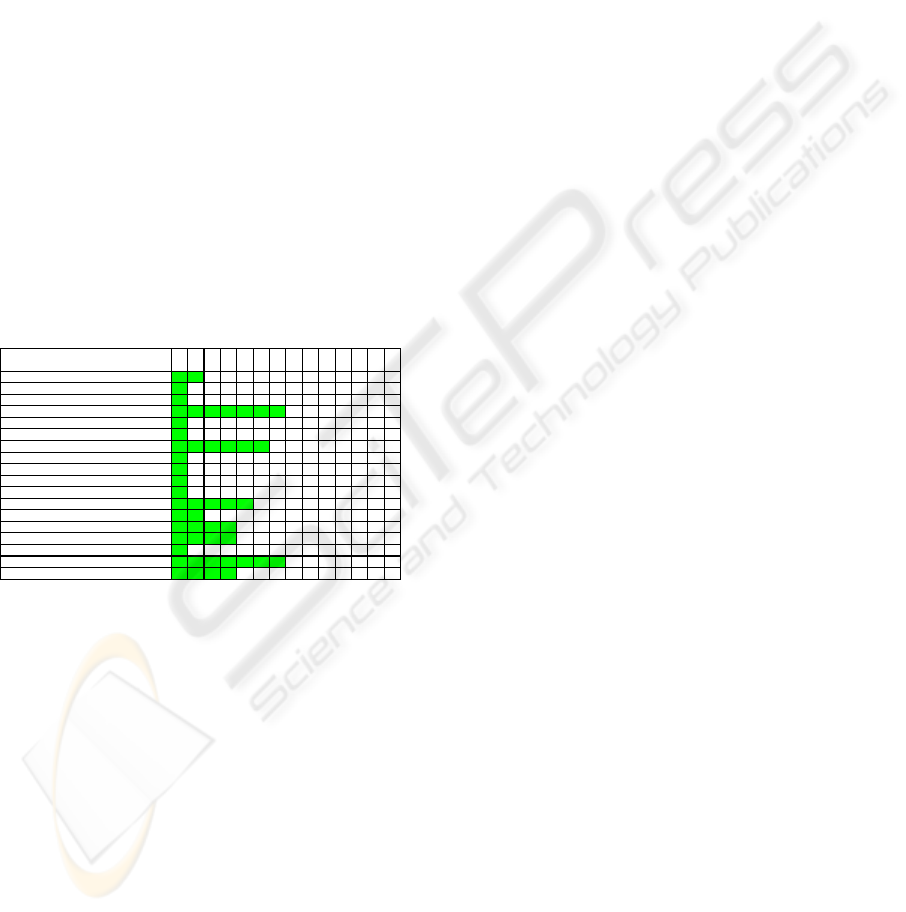
processes. Figure 2 shows the resulting matrix. For
an extensive explanation of the matrix we refer to
(Van den Berg and Van Steenbergen, 2006).
The matrix distinguishes 18 key areas that are
important to the architectural practice. Each of these
key areas has its own maturity growth path
consisting of two to four maturity levels, depending
on the actual key area. These maturity levels per key
Figure 2: Architecture maturity matrix.
area are depicted by the letters A to D in the matrix.
For example the key area use of architecture has
three maturity levels architecture used informatively
(A), architecture used to steer content (B) and
architecture integrated into the organization (C).
The position in the matrix of the letters
indicating the maturity levels for each key area is
fixed. It indicates the relative priorities of the 18 key
areas. The matrix should be read from left to right.
The first A’s to be encountered are the first key
areas to pay attention to if one wants to develop an
architectural practice. Figure 2 shows that these are
the key areas development of architecture, alignment
with business and commitment and motivation (the
A’s in column 1). These key areas should be
developed to their first maturity level (A), before
work is done on the key areas use of architecture,
alignment with the development process and
consultation (the A’s in column 2). And so on. Only
if all A’s in columns 1 to 3 have been achieved, is it
advisable, according to the matrix, to develop the
key area development of architecture to the next
level (the B in column 4). In this way the matrix can
be used to set priorities in developing the
architectural practice.
Each level of each key area is associated with
one to four checkpoints. For instance level A of key
area use of architecture has as one of its checkpoints
whether the architecture is accessible to all
employees. The matrix is used as an assessment
instrument by scoring the checkpoints. All
checkpoints belonging to a level have to be scored
positively to achieve that level. In total there are 137
checkpoints.
Each level of each key area is also associated
with one to three suggestions for improvement. They
represent best practices that may help an
organization to satisfy the checkpoints.
Scale
Area
0 1 2 3 4 5 6 7 8 9 10 11
12
13
Development of architecture A B C
Use of architecture A B C
Alignment with business A B C
Alignment with the development process A B C
Alignment with operations A B C
Relation to the as-is state A B
Roles and responsibilities A B C
Coordination of developments A B
Monitoring A B C D
Quality management A B C
Maintenance of the architectural process A B C
Maintenance architectural deliverables A B C
Commitment and motivation A B C
Architecture roles and training A B C D
Use of an architectural method A B C
Consultation A B C
Architectural tools A B C
Budgeting and planning A B C
ICEIS 2007 - International Conference on Enterprise Information Systems
16

2.2 Use of the Architecture Maturity
Matrix
The architecture maturity matrix is an assessment
instrument to be used by an outside party to evaluate
the current state of the architectural practice of an
organization.
Usually, an assessment is commissioned by the
person responsible for the architectural function.
This may be the head of the architects, the head of
the IT function or the CIO. The assessment is often
the first step in a structured improvement process.
The assessors, usually as a team of two,
complete the matrix by scoring all 137 checkpoints.
They do this on the basis of interviews, studying
architectural documents, and making use of a
questionnaire.
The interviews are with all relevant
stakeholders, being senior management, business
managers, project managers, system developers,
operations and architects. This is required because a
successful architectural practice depends on the
measure in which the various disciplines in the
organization understand and accept the purpose and
content of the architecture. This relation of
architecture to other disciplines is therefore reflected
in the key areas the matrix contains.
Study of the documentation is primarily meant
to gauge the width and depth of the architectural
artefacts.
To support the picture the assessors build for
themselves, a questionnaire can be issued to
architects, project managers and line management.
However, this has to be regarded with care, as the
questions are open to interpretation. The authors use
the questionnaire for two purposes:
to validate the picture they receive from the
interviews; if the questionnaire outcome
differs greatly from the findings from the
interviews, the assessors have to dig deeper.
To gain insight in possible differences in
perception from the different stakeholders. By
distinguishing the overall scoring of different
disciplines differences in perception may
occur. This provides clues to the measure of
general acceptance and the extent to which
views on architecture are shared throughout
the organization.
Differences in perception between stakeholders
are thus one of the indications of the level of
architecture maturity and are as such reflected in the
outcome of the matrix.
The completed matrix is included in an
assessment report, together with a discussion of the
key findings as well as recommendations for
improvement.
Some organizations choose to perform an
assessment each year, using the results to feed a
continuous improvement process. Reported results
from such an improvement process include lower IT
costs, better cooperation between business and IT
and shorter response times of IT.
3 CASE STUDIES
In the period of 2002 to 2006 the maturity matrix
has been used in different organizations. The matrix
has been applied to about 20 organizations in the
private and public sector: finance, government,
healthcare, industry, utility, telecommunications and
retail. The size of the organizations ranges from a
couple of hundred to tens of thousands of
employees. Both national, international and
multinational companies have been assessed.
In this section we present two case studies: first
we give a brief description of the kind of
organization we are looking at, followed by the basic
approach to architecture we encountered. Then we
present the matrix we completed for the organization
and discuss how the scores on the key areas can be
related to its basic approach to architecture. For
completion’s sake we will also say a few words on
the kind of advice that we gave based on the
outcomes of the assessments.
3.1 A Manufacturing Company
The first case is of a multinational manufacturing
company. The company has plants in various parts
of the world and has about 23,000 employees
worldwide. The IT department consists of about 600
employees. The architectural team is positioned
within the IT department which consists of an
American branch and a European branch. Architects
are positioned both at headquarters in the US and in
Europe. In total the architectural team consists of
about six enterprise architects. Architecture has been
worked on for about three years.
The basic approach taken to architecture is a
technology-oriented approach. Architecture
development is being done primarily from an IT
perspective and concentrates on technical
infrastructure. Standardization in the technological
field is an important aim. About 30 practitioners are
each laying down the standards and roadmaps for
AN INSTRUMENT FOR THE DEVELOPMENT OF THE ENTERPRISE ARCHITECTURE PRACTICE
17
their specific technological areas. These standards
are made available to all by means of the company
intranet.
As a consequence of this approach architecture
is very much a collection of technological standards.
There is no overall, comprehensive vision of
business choices, processes and information
systems. Also, among the persons writing the
standards, there is no common understanding of
what architecture entails and what goals it has to
achieve.
The director of architecture in the US asked for
an assessment of the architectural processes to
provide input for next year’s architecture
development plan and strategy. The assessment was
performed within four intense days. One day was
reserved for interviews and studying documentation,
one day and a half for analysing the data and one
day and a half for presenting and discussing the
results. Beforehand the enterprise architects had
completed the questionnaire, which was used as
background information to the assessment.
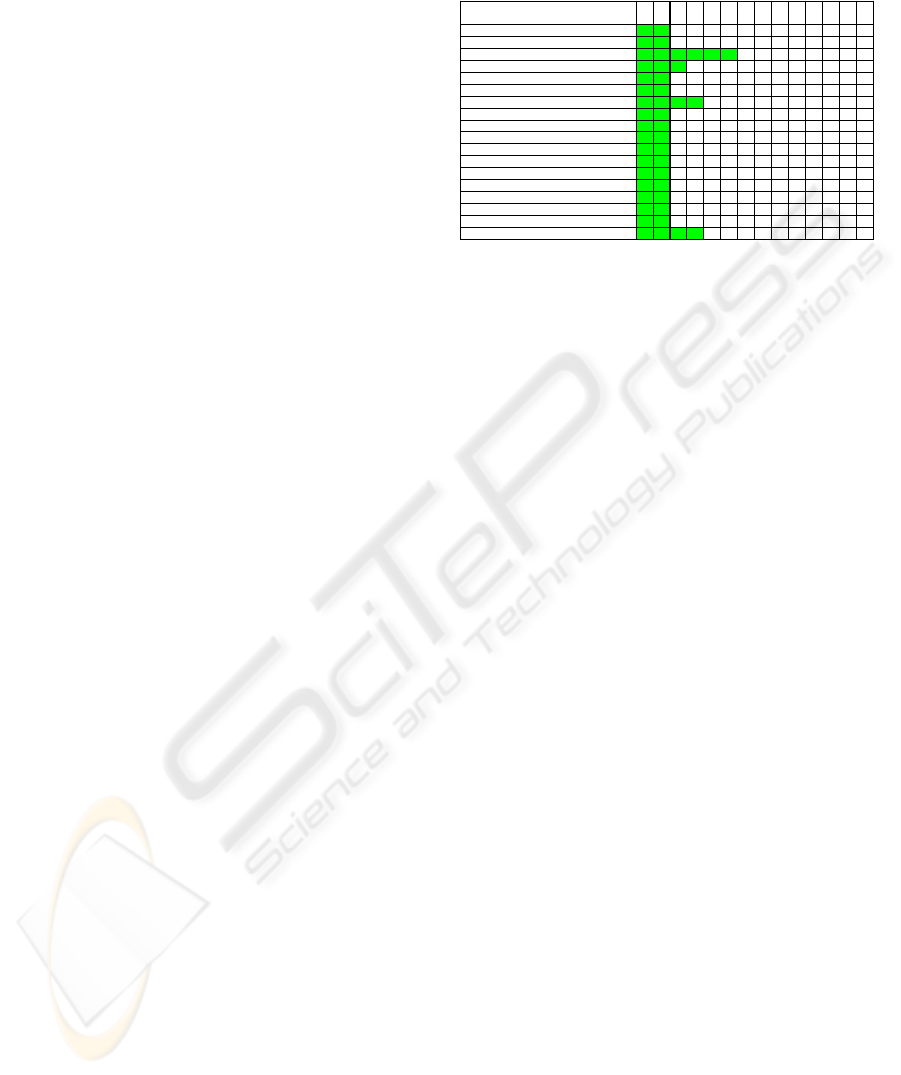
The matrix that resulted from completing the
checkpoints is given in figure 3.
Figure 3: Maturity matrix for the manufacturing company.
The matrix shows that the key areas to focus on
for this organization are alignment with business,
use of architecture and consultation.
The low score on alignment with business is
caused by the fact that no clear link can be
established between the architectural products and
the business strategy and goals, as well as by the fact
that the architecture is not evaluated in terms of the
business goals. The checkpoints ‘Is there a clear
relationship between the architecture and the
organization’s business goals?’ and ‘Is the
architecture evaluated in terms of the business
goals?’ are answered negatively. This reflects the
fact that architecture has emerged from individual
expertise, not from a company-wide vision.
The key area use of architecture failed on the
checkpoint whether the architecture provides a clear
picture of the organization’s goals and demands.
The low score for consultation is caused by the
fact that though meetings of the architects were
being held, no outcomes or decisions were being
recorded.
Striking in the matrix is the relatively high
score for alignment with the development process.
The fact that the standards were being developed by
the practitioners themselves resulted in a strong buy-
in from the technical community. This made for a
strong embedding of the architecture principles in
the development process. Which helped a lot in
getting projects to adhere to the architecture. Hence
the high score for this key area.
The scores of the key areas can be
straightforwardly explained from the basic approach
to architecture. The specialist technology-oriented
approach is directly reflected in the low scores for
alignment with business, use of architecture and
consultation, but also leads to the relatively high
score for alignment with the development process.
The advice given to the company on the basis
of the assessment (with the related key areas
between brackets) was to:
Strengthen the business - IT alignment by
explicitly linking the architectural choices to
the business goals (alignment with business;
use of architecture).
Create an architecture community of enterprise
and domain architects that work together,
exchange ideas and share a common
framework (consultation).
Strengthen the efforts in information
architecture to start closing the gap between
technology and business goals (alignment with
business).
The matrix proved a useful instrument in
providing input to the architecture development plan
and strategy. It helped the organization to focus on
the right measures to improve their overall maturity.
Its major contribution lay in the integral approach to
architecture reflected in the balance between the
levels of the 18 key areas. The matrix helped to
show the overall picture and gave clear insight in the
strengths and weaknesses of the architectural
practice so far. These strengths and weaknesses
were, once they were exposed, clearly recognizable
to the organization: the lack of a shared vision,
partly because of the missing link to the business
strategy, which prevented the move from individual
Scale
Area
0 1 2 3 4 5 6 7 8 9 10
11
12
13
Development of architecture A B C
Use of architecture A B C
Alignment with business A B C
Alignment with the development process A B C
Alignment with operations A B C
Relation to the as-is state A B
Roles and responsibilities A B C
Coordination of developments A B
Monitoring A B C D
Quality management A B C
Maintenance of the architectural process A B C
Maintenance of architectural deliverables A B C
Commitment and motivation A B C
Architecture roles and training A B C D
Use of an architectural method A B C
Consultation A B C
Architectural tools A B C
Budgeting and planning A B C
ICEIS 2007 - International Conference on Enterprise Information Systems
18
technology standards to a comprehensive view on
the right information structure for the company.
3.2 A Semi-governmental Organization
The second case concerns a Netherlands semi-
governmental organization. The organization has
about 500 employees. At the moment of assessment,
the organization underwent a transition from a
purely government funded organization to an
organization that was commercially active on the
free market.
This transition had a huge impact on the culture
and processes of the organization. Internal processes
and products became commercially exploitable
services. This asked for greater standardization and
flexibility. The organizational thinking had to be
turned from internal product oriented to external
process oriented.
The organization had been working on
architecture for a year before they approached one of
the authors. They had appointed three consultants
from the IT staff department to act as architects. One
of these three clearly functioned as the frontman.
Architecture was mainly associated with his name.
The rest of the IT department was not actively
involved in the architectural efforts.
The basic approach chosen by the organization
was a project-driven one. As they put much value on
commitment from the organization the architects had
focused primarily on providing support to business
projects. In this way they had built, over the year, a
number of process and application models. These
were delivered to the projects. The need-based, just
enough, just in time approach ensured a clear link
between the architectural models and the business
goals. They also engendered awareness of
architecture, especially with management. However,
the architecture products were not consolidated into
an enterprise architecture, nor were they made easily
accessible to the rest of the company. Because of the
lack of an overall enterprise architecture to relate the
various models to, the architecture as a whole was
rather fragmented. There were architectural
products, there was no overall, comprehensive
enterprise architecture.
As the architects were uncertain how to proceed
they asked one of the authors to perform an
assessment and provide recommendations for
improvement. We performed eight interviews with
project managers, team managers, directors and
architects and fifteen employees completed the
questionnaire. The assessment took six days over a
period of four weeks. On the basis of this, the
following picture emerged.
Figure 4: Maturity matrix for the semi-governmental
organization.
The matrix in figure 4 shows the organization is
at scale 1. The key areas to work on in order to reach
the next maturity level are use of architecture and
consultation.
Alignment with business scores relatively high.
This can be explained from the fact that architecture
development was project, and hence business goal,
driven.
However, the results of these project-driven
development activities were not consolidated into a
readily accessible enterprise architecture. Hence the
low score on use of architecture. This key area
failed on the checkpoints whether there is an
architecture that is recognized by management as
such, whether the architecture gives a clear
indication of what the organization wants and
whether the architecture is accessible to all
employees.
The fragmentation of the architecture was also
shown in the lack of teamwork indicated by the low
score for the consultation key area: there are no
regular meetings of the architects, nor are any
decisions made properly documented.
In this case too, the scores on the various key
areas can be traced back to the basic approach taken
to architecture.
The advice given to the organization on the
basis of the assessment was to:
Develop an overall enterprise architecture (use
of architecture).
Spread architectural awareness and
involvement throughout the organization
(consultation).
Publish the architecture (use of architecture).
Bring all projects under architecture
(monitoring).
Scale
Area
0 1 2 3 4 5 6 7 8 9 10 11
12
13
Development of architecture A B C
Use of architecture A B C
Alignment with business A B C
Alignment with the development process A B C
Alignment with operations A B C
Relation to the as-is state A B
Roles and responsibilities A B C
Coordination of developments A B
Monitoring A B C D
Quality management A B C
Maintenance of the architectural process A B C
Maintenance of architectural deliverables A B C
Commitment and motivation A B C
Architecture roles and training A B C D
Use of an architectural method A B C
Consultation A B C
Architectural tools A B C
Budgeting and planning A B C
AN INSTRUMENT FOR THE DEVELOPMENT OF THE ENTERPRISE ARCHITECTURE PRACTICE
19

Again, the matrix proves useful in bringing the
message home, especially because it shows the
relations between the various aspects relevant to the
architectural practice. The scores were recognizable
and the matrix helped in the communication about
the strengths and weaknesses and their
consequences. The assessment stimulated the
organization to start work on the overall framework
to position their individual architectural artefacts and
to broaden the base for architectural thinking and
acting from essentially one person to employees
from all parts of the organization.
3.3 Results and Matrix Adjustments
The identification of the key areas, their levels and
their positioning in the matrix was initially based on
practical experience. From our work in various
organizations establishing architecture practices we
distilled the key areas and their relative priorities.
The first version of the matrix stems from 2001 and
was published in 2003 (Van den Berg and Van
Steenbergen, 2003).
Validation of the matrix took place primarily by
applying the instrument to about 20 real-life cases.
In all cases the results of the completed matrix met
with much recognition from both management and
architects. The strengths and weaknesses that
emerged were recognized, as well as the priorities
that were suggested by the matrix.
Secondly, as illustrated in the case studies, the
scores on the key areas in the matrix could typically
be traced back to the basic architectural approach of
the organizations investigated. In the manufacturing
company the low and high scores of the key areas
could be recognizably linked to the individualistic
technology-oriented approach. The same is the case
for the relation between the scores of the semi-
governmental matrix and its project-driven
approach.
Finally, application of the first version of the
matrix for two years led to a number of adjustments.
The fact that these adjustments presented themselves
and could be motivated can be seen as an indication
of the relevance of the key areas chosen. The
following changes were made:
We changed the focus of the key area
maintenance of architectural process from
quality improvement to more general
management of the process. This was motivated
by the realization that we had focused too
strongly on quality management, which is a
separate key area, while neglecting more basic
process management aspects like describing and
communicating your processes.
We moved level B for the key area maintenance
of architectural deliverables from column 6 to
column 7. This is a minor change, prompted by
the wish to bring a bit more balance in the matrix
as a whole. The other letters in column 6 had
higher priority in our eyes than level B of this
key area.
We moved level B for the key area use of an
architectural method from column 11 to column
9. This move is motivated by the increasing need
felt for having architects throughout the
organization working together. This is made
easier when they share a common approach to
architecture.
We moved level A for the key area architectural
tools from column 8 to column 6, and level B
from column 11 to column 10. While we remain
wary of introducing tools into an organization at
too early a stage, causing the organization to
focus on the tool instead of on the content
required, this move is motivated by the fact that
tools are beginning to appear that are less
daunting and more flexible in use. This reduces
the risk of the tool dictating the architecture.
We moved level A for the key area budgeting
and planning from column 6 to column 3, and
level C from column 13 to column 12. This
move sprang from our experience that architects
may tend to keep working on their architecture
until perfection, without a sense of having to
deliver in time. Therefore we stress the
importance of drawing up a plan of approach
before embarking on an architecture
development project. We found it such an
important aspect in making architects more
effective that we moved the levels for this key
area forward.
For the last three years the matrix has been stable
and we do not anticipate any major changes.
However, as the enterprise architecture field
matures, minor adjustments may be called for
sometime in the future.
3.4 Lessons Learned
From applying the maturity matrix in about 20
organizations in the course of five years, we learned
the following lessons:
When assessing an organization more than one
matrix may be required. In an early case of
applying the matrix, we had a hard time scoring
ICEIS 2007 - International Conference on Enterprise Information Systems
20

the checkpoints. We seemed to encounter
contradictory signals which made it extremely
hard to decide on a yes or no. Until we realized
that the organization really consisted of two
worlds: a new world introducing new software
techniques in one of the business units of the
organization and the rest of the organization
which continued on the existing road of years
before. Once we tried to score the two worlds
separately, everything fell into place. The new
world scored a clear level 2, while the old world
was stuck on level 0. This reflected a risk of the
new world loosing the connection with the old
world. We therefore advised for the new world
to strive for improvement to level 3, while the
old world was to go for level 2, in this way
closing the gap, while the new world was
allowed to retain its innovative lead.
Using the checkpoints as a questionnaire may
provide additional insight. The checkpoints are
meant as a formal instrument to complete the
matrix. However, in the course of time we found
that when they are converted to a questionnaire
they may fulfil additional purposes. For one
thing we have encountered a number of times the
fact that the various stakeholders in an
organization differ in their view of the
architectural practice. These are valuable clues to
interpreting the actual situation. Another use of
the checkpoints as questionnaire is to have a
delegation of the organization complete the
questionnaire together. This kind of self
assessment appears to provoke very useful
discussions and sharing of experiences and best
practices. Completion of the questionnaire by a
group of about six persons takes about an hour
and a half. We frequently use it as an instrument
in awareness and improvement workshops for
architectural teams.
Using the checkpoints as a questionnaire is not
reliable as single input for an assessment. This
lies mainly in the fact that situations and
perceptions differ throughout the organization.
For instance, some projects may be monitored by
architects while others are not. As the
checkpoints ask for a clear yes or no, different
people may provide different answers. It is
therefore to be left to the assessors to do the final
scoring of the checkpoints if a formal assessment
is asked for.
The assessment is organization independent, but
the improvement suggestions are not. The
completion of the checkpoints is done in a
standard way for each organization. Thus the
identification of strengths and weaknesses does
not differ from organization to organization. The
actual advice for improvement, however, is very
organization specific. The scoring of the matrix
provides insight into the aspects that have to be
addressed and improved. The best way to go
about improving these aspects is very much
driven by factors like culture, size, business and
overall process maturity of the organization.
4 DISCUSSION AND
CONCLUDING REMARKS
The matrix has held, apart from a few adjustments
motivated by changes in the field, for five years
now, being applied to organizations of different
branches and different sizes. Most organizations,
however, have scored in the lower regions of the
matrix (levels 0 to 3). It is imaginable that, when
maturity grows and organizations get higher scores,
the matrix will receive another update. The authors
see this as a strength of the matrix, rather than a
weakness.
Until now, the positioning of the key area levels
in the matrix has held for all organizations
investigated. An interesting question that comes up
is if this will remain the case when organizations
move to the right in the matrix. In future it might
appear that a distinction in types of organizations
may be required. I.e. different matrices for different
organizations. Our expectation is that a
differentiation in the choice of key areas is not
required, but that the relative positioning to each
other of the key area levels, i.e. the setting of
priorities, may vary. This is an issue for further
research.
The matrix provides insight and support to
improve the architectural practice of an organization.
It is aimed at making architectural practices run
more smoothly and making them better accepted by
the rest of the organization. What remains to be done
is to measure whether these better running practices
do indeed lead to better performance of the
organization as a whole, or in other words, whether
the contribution of architecture to the business goals
improves as well.
The focus of the matrix has grown to be more
on guiding improvement than on measuring
maturity. In a field as young as enterprise
architecture we think this is a justified choice.
So far the matrix seems to be a very useful
instrument in assessing the strengths and weaknesses
AN INSTRUMENT FOR THE DEVELOPMENT OF THE ENTERPRISE ARCHITECTURE PRACTICE
21

of the architectural practice of organizations and in
providing direction and priorities for improvement.
Use in practice shows that the results are
recognizable and the improvement suggestions
feasible. A number of organizations have even used
the matrix to give direction to an improvement
trajectory of years, performing a yearly assessment
to monitor progress.
ACKNOWLEDGEMENTS
We would like to thank Rogier Dijk and Joost
Luijpers for their contributions to the development
of the first version of the architecture maturity
matrix. Rik Bos, Wiel Bruls and Ralph Foorthuis we
thank for their comments on an earlier version of
this paper. Last but not least we want to thank the
anonymous reviewers for their suggestions for
improvement.
REFERENCES
Appel, W., 2000. Architecture Capability Assessment. In
Enterprise Planning & Architecture Strategies, vol.4,
nr.7, METAGroup.
Berg, M. van den, Steenbergen, M. van, 2003. Niveaus
van werken onder architectuur (Levels of architectural
maturity). In Informatie, vol. 45, nr. 2, pp. 52-56.
Berg, M. van den, Steenbergen, M. van, 2006. Building an
enterprise architecture practice. Springer, Dordrecht.
Bucher, T., Fischer, R., Kurpjuweit, S., Winter, R., 2006.
Enterprise Architecture Analysis and Application - An
Exploratory Study. In EDOC workshop TEAR 2006.
Hong Kong. Retrieved November 22, 2006, from
tear2006.telin.nl.
CMMI, 2002. CMMI
SM
for Systems Engineering, Software
Engineering, Integrated Product and Process
Development, and Supplier Sourcing; (CMMI-
SE/SW/IPPD/SS, V1.1) Staged Representation;
CMU/SEI-2002-TR-012 ; ESC-TR-2002-012 .
Gao, 2003. A framework for assessing and improving
enterprise architecture management.
Hartman, A, Sifonis, J., Kador, J., 2000. Net Ready:
Strategies for Success in the E-conomy. McGraw-Hill,
New York.
Kaplan, R., Norton, D., 1992. The balanced scorecard:
measures that drive performance. In Harvard Business
Review, vol. 70, nr. 1, pp. 71-79.
Koomen, T., Pol, M., 1999. Test Process Improvement, a
practical step-by-step guide to structured testing.
Addison-Wesley, Boston.
Lankhorst et al, 2005. Enterprise Architecture at Work.
Springer, Heidelberg.
Martinsons, M., Davison, R., Tse, D., 1999. The balanced
scorecard : a foundation for the strategic management
of information systems. In Decision Support Systems
vol. 25, pp. 71-88.
METAgroup, 2001. Diagnostic for Enterprise
Architecture, META Practice.
NASCIO, 2003. NASCIO enterprise architecture maturity
model.
Wagter, R., Berg, M. van den, Luijpers, L., Steenbergen,
M. van, 2001. Dynamic Enterprise Architecture: how
to make it work. Wiley, Hoboken.
Westbrock, T., 2004. Architecture Process Maturity
Revisited and Revised. METAgroup Delta 2902.
ICEIS 2007 - International Conference on Enterprise Information Systems
22
