
REVISITING THE OLAP INTERACTION TO COPE WITH
SPATIAL DATA AND SPATIAL DATA ANALYSIS
Rosa Matias
Polytechnic Institute Of Leiria, Morro do Lena - Alto Vieiro, Leiria, Portugal
João Moura-Pires
CENTRIA/FCT, New University of Lisbon, Caparica, Portugal
Keywords: OLAP, SOLAP, GIS, DW.
Abstract: In this paper we propose a new interface for spatial OLAP systems. Spatial data deals with data related to
space and have a complex and specific nature bringing challenges to OLAP environments. Humans only
understand spatial data through maps. We propose a new spatial OLAP environment compounded with the
following elements: a map, a support table and a detail table. Those areas have synchronized granularity.
We also extend OLAP operation to performed spatial analysis, for instance, spatial drill-down, spatial drill-
up and spatial slice. We take special care in the spatial slice where we identify two main groups of
operations: spatial-semantic slice and spatial-geometric slice.
1 INTRODUCTION
Nowadays OLAP (On-Line Analytical Processing)
is a very important component of Decision Support
Systems in any medium or large organization since
they provide rapid and interactive ways of exploring
large amounts of information stored, in most of the
cases, according to the multidimensional data model
(Kimball and Ross, 2002). However OLAP systems
are optimized to handle alphanumeric data and are
not well prepared to handle spatial data represented
by data types like vectors or images. Spatial data can
be digitally represented through image, vector or
alphanumeric data types. Vectors are represented by
points, lines and polygons and are in agreement to
some coordinate system (latitude, longitude). They
also have a different and complex nature compared
with alphanumeric data types. In deed, to store the
geometry of a lake is necessary to collect hundreds
of points (depending of the precision). Visualization
is another concern that is only possible through
maps.
A Geographic Information System (GIS) is a
computer system capable of assembling, storing,
manipulating and displaying geographically
referenced information i.e. data identified according
to their location (Workboys and Duckham, 2004). A
GIS is a system dedicated to the manipulation of
spatial data providing powerful cartographic
functionalities. It is possible to couple OLAP
operations in a GIS environment. GIS systems are
manipulated by experts and have a poor interaction
for on-the-fly OLAP operations. To build a spatial
query, in a GIS, is necessary some SQL background
and perform fewer configurations. GIS software
manufactures provide components for map display
used in the development of desktop and web
applications. Those components have capabilities to
establish connections with spatial databases and to
render geometric columns. Some commercial OLAP
systems start to include spatial data but only with
display concerns. In those systems spatial data is
stored outside the database and later linked to spatial
data stored in dedicated files. The evolution of
database management systems turns feasible to
store, manipulate and retrieve spatial data from
databases, meaning that is also possible to integrate
spatial data in ROLAP (Relational OLAP) systems.
In this paper we propose a new approach for the
OLAP interaction, by redefining and extending the
typical OLAP operations and visualization methods
to cope with spatial data. A prototype was developed
157
Matias R. and Moura-Pires J. (2007).
REVISITING THE OLAP INTERACTION TO COPE WITH SPATIAL DATA AND SPATIAL DATA ANALYSIS.
In Proceedings of the Ninth International Conference on Enterprise Information Systems - DISI, pages 157-163
DOI: 10.5220/0002369701570163
Copyright
c
SciTePress
whose demonstration can be visualize in
http://www.estg.ipleiria.pt/~rmatias/iceis07/.
In the next section, OLAP concepts are
introduced namely: (i) the multidimensional model;
(ii) OLAP operations; and (iii) typical OLAP
interaction. Section 3 presents and analyzes related
work. Our proposals are introduced and discussed in
section 4. In the last section, some conclusions are
presented as well as future research directions are
pointed out.
2 OLAP CONCEPTS
In 1993 E. F. Codd proposed, the term OLAP (On
line Analytical Processing), to define a category of
database processing, addressing the emerging need
of data analytical activities over large amount of
data collected by OLTP (On-Line Transaction
Processing) systems (Codd et al., 1993).
The entity-relationship model is a success as a
conceptual model for databases supporting OLTP
systems, but is not appropriate for designing
decision support applications like OLAP. The strong
normalization applied to information spread data
over a large number of tables. Therefore to answer
analytical queries, database engines have to execute
join operations with too many tables. To overcome
this problem it has been proposed the
multidimensional data model (Kimball and Ross,
2002).
In the development of a multidimensional data
model there are the following elements: (i) a central
table (fact table) that contains the bulk of the data
and whose main objective is measure the business
performance (price of a sold product, quantity sold,
etc.); and (ii) a set of smaller tables (dimension
tables) that represent the aspect in business
organization (time, stores, products, clients, etc).
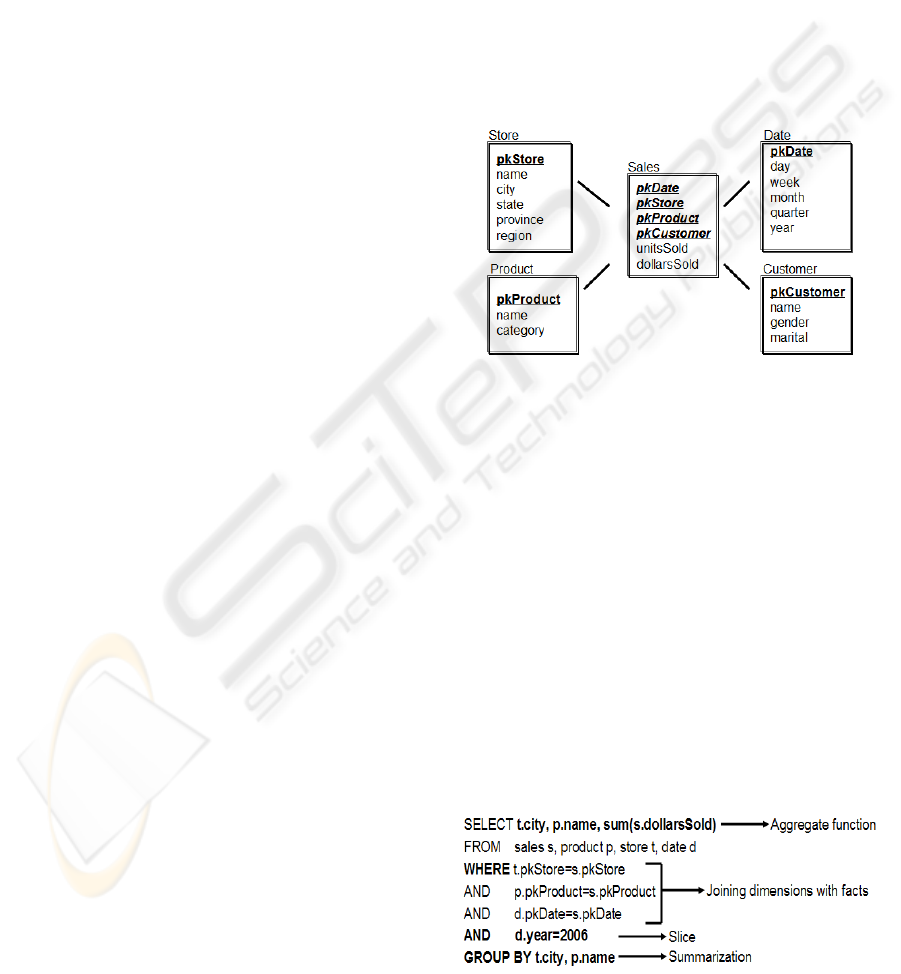
Figure 1 presents a multidimensional model for sales
in a chain of stores for traditional commerce,
measuring the number of units and the sales amount
(in dollars) of a product sold to a customer in one
store at a given time.
In a conceptual view, this structure can be seen
as a cube where, each edge is a dimension and each
cell express values of measures for values of
dimensions. This model, that crosses the fact table
with the dimensions tables, is considered to be near
user’s intuition and enables the development of
software that supply easy navigation through data
(Kimball and Ross, 2002). Dimensions are
organized in conceptual hierarchies that specify how
attributes are organized and relate each other. A
hierarchy defines a sequence of mappings from a set
of low-level concepts to a set of more general and
higher-level ones (Kimball and Ross, 2002). For
example, in Date dimension, a Day can be mapped
in Month, which can be mapped in a Quarter and a
Quarter can be mapped in a Year. This mappings
form a conceptual hierarchy in the Date dimension
that enables the navigation from Day level to Year
level. It can happen that more that one hierarchy is
defined on a dimension. For instance, from Day to
Week and from Week to Year.
Hierarchies play an important role in OLAP
operations because they enable the navigation by
levels of abstraction, bringing flexibility to observe
data from different perspectives.
Figure 1: Multidimensional model.
The asymmetry present in a multidimensional
model (one fact table connected to many
dimensional tables) is exploited by OLAP engines
by specific query patterns. Figure 2 presents a
typical OLAP query and the following elements can
be pointed out: (i) the where clause specifies the join
between the dimensions and the fact table; (ii) the
where clause specifies constraints over some
dimensions attributes, which correspond to a user
selection of parts of the data cube (slide operation);
(iii) the group by clause, in conjunction with
selected columns and aggregation functions (sum)
(to be applied on selected measures), corresponds to
user’s specifications in intended summarization, i.e.,
the level of detail of the result.
Figure 2: Typical query in OLAP.
ICEIS 2007 - International Conference on Enterprise Information Systems
158
The Drill-up (roll-up) operation reduces the level
of detail. The drill-down operation increases the
level of detail.
Drill-up operations performs aggregation on a
data cube either by using a hierarchy (going from a
lower level concept to a higher one) or by dimension
reduction (removing a dimension’s attribute).
Drill-down operations can be done using a
hierarchy (going form a higher level concept to a
lower one) or by dimension addition (adding a
dimension’s attribute).
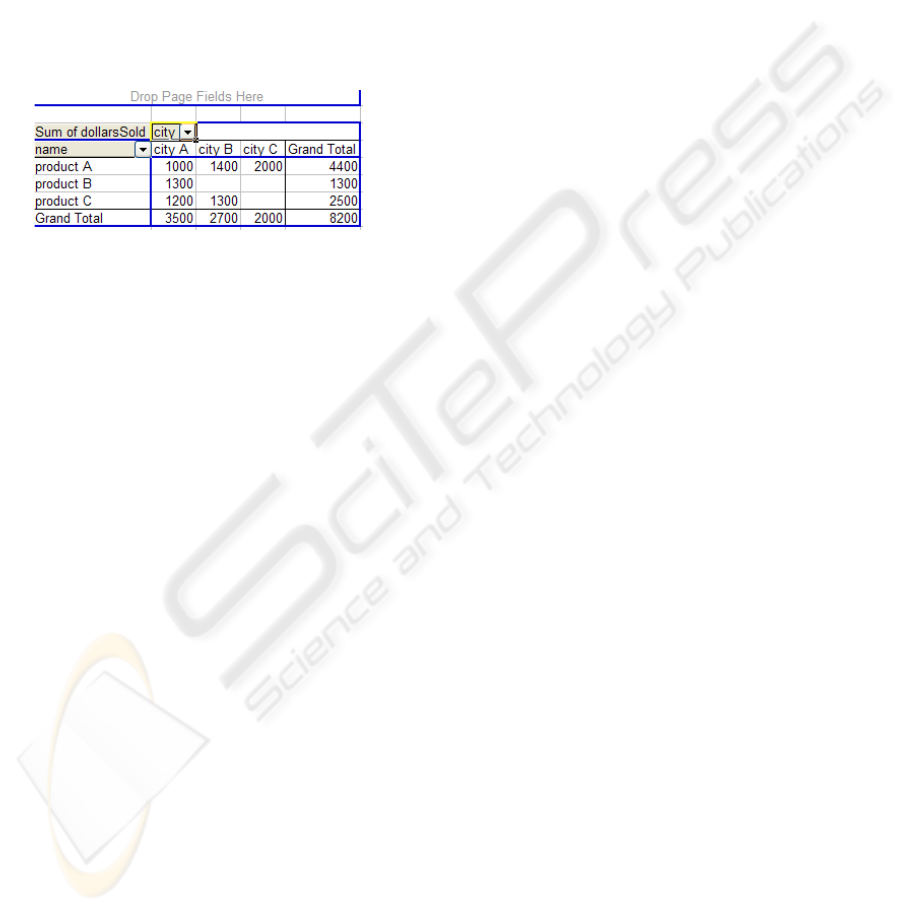
Figure 3 shows a two-way table for presenting
answers of OLAP queries.
Figure 3: Pivot table layout.
Users, in most of OLAP systems specify OLAP
queries in interactive ways from a GUI. Pivot tables
that are frequently used to perform OLAP
operations. They supply a flexible way to dispose
attributes and measures by means of drag-and-drop
operations in four main areas: page, row, column
and data. In row’s and column’s areas users put
attributes that they want to cross. In the data area
users put measures whose values they want to obtain
and that result from the cross of attributes. In the
page area users put attributes they want to use for
controlling the data used on the query.
Roll-up and drill-down operations are performed
by dragging-and-dropping attributes into (or
removing from) row and column areas.
3 RELATED WORK
Bédard introduced in 1997 the term SOLAP (Spatial
On-Line Analytical Processing) as a type of software
that allows rapid and easy navigation within spatial
databases, offers many levels of information
granularity, many themes, many epochs and many
display modes (maps, tables, graphics) synchronized
or not. (Bédard, 1997). Since then many works have
been done, especially in the Centre of Research in
Geometric at the University of Laval in Quebec,
Canada.
OLAP systems are divided in three main layers:
(i) data layer; (ii) server layer; (iii) client layer.
That’s why the integration of spatial data in OLAP
systems brings questions in all those layers.
Han et al. (Han et al., 1998) addresses problems
related to the integration of spatial data in the data
layer. Namely, identifies new types of dimensions,
attributes, hierarchies and measures. Later
Malinowski and Zimányi (Malinowski and Zimányi,
2004) addresses the representation of those new
types of dimensions, attributes, hierarchies and
measures in the multidimensional data models.
A spatial dimension can have (Han et al., 1998):
(i) semantic attributes, i.e., alphanumeric data; (ii)
spatial-semantic attributes, i.e., alphanumeric data
related to space, for instance, the name of cities; (iii)
spatial-geometric attributes, i.e., geometry data
(point, line, polygon), for instance, the political
boundary of cities.
Because, there are three types of attributes there
are different types spatial hierarchies, classified
according to the generalization been made (Han et
al., 1998): (i) semantic-to-semantic hierarchy (total
semantic) is a hierarchy where in all concept levels
there are semantic attributes; (ii) geometric-to-
semantic hierarchy (hybrid) is a hierarchy where the
lower level concept is a spatial-geometric attribute
but after some level of degree there are only spatial-
semantic attributes; (iii) geometric-to-geometric
(total geometric) is a hierarchy where in all concept
levels there are spatial-geometric attributes.
The spatial hierarchies’ attributes have a total or
a partial order. Attributes of hybrid and total
hierarchies have including relationships.
A fact table has two types of spatial measures: (i)
spatial-semantic measure, for instance, the area of a
polygon; (ii) spatial-geometric measure, for instance,
a point specifying where an accident has happened.
Compared with alphanumeric data, spatial data
(vector data) tends to occupy more disk space and
performing geometric operations takes more CPU.
So a balance between space storage and CPU
response time has to be carried. Han et al. (Han et
al., 1998) presents the following approaches to deal
with materialized and spatial views (Han et al.,
1998): (i) without spatial materialized views (spatial
data is used only for visualization proposes); (ii)
spatial materialized views with approximations. For
instance, store geometry approximations like the
Minimum Bounding Rectangle (MBR); and (iii)
selective pre-aggregation (identify the most required
spatial aggregations and materialize them). This will
have a performance enhancement for the most
common usage of the system.
Rivets et al. (Rivest et al., 2005) proposes
interfaces for SOLAP interaction. Their work
REVISITING THE OLAP INTERACTION TO COPE WITH SPATIAL DATA AND SPATIAL DATA ANALYSIS
159
compares OLAP and GIS systems, and presents the
advantages of integrating concepts from those two
different worlds. They develop a new solution where
GIS components are integrated OLAP environments.
The results of common OLAP operations, namely
aggregated data, are displayed in maps. Other ways
of display are tabular and graphic formats. The map
enables users to configure the layout (as in GIS
software).
4 SOLAP INTERACTION
As we have already mentioned, in previous sections,
OLAP systems should provide an easy and flexible
way to explore datasets and so the introduction of
this new component – the map, can’t obstruct those
capacities. In this section we first present the
proposed graphical user interface (GUI), namely the
layout of visual elements. Then we present new
OLAP operations – spatial OLAP operations. For
simplicity concerns, we concentrate our efforts in a
scenario with only one spatial dimension.
4.1 OLAP Interaction Coped with
Maps
Let us consider the scenario related to a chain of
commerce stores geographically disperse in a
country as described in section 2.1 and represented
in Figure 1. The store dimension has the following
spatial-geometric attributes: Point-of-Store that
represents the location of stores and four other
spatial-geometric attributes (polygons representing
administrative divisions (Table 1)).
A spatial-geometric attribute has a spatial-
semantic attribute that describes it. We call that
spatial-semantic attribute the spatial-semantic
attribute of reference. See in Table 1 the list of
spatial-geometric attributes and the related spatial-
semantic attributes.
Table 1: Spatial-semantic attributes of reference and
spatial-geometric attributes.
Spatial-Geometric Spatial-Semantic
Point-of-Store Name
Polygon-of-City City
Polygon-of-State State
Polygon-of-Province Province
Polygon-of-Region Region
The GUI of a SOLAP client should provide map
visualization features including the ability of
controlling the way the spatial-geometric attributes
are represented on the map, based on the values of
some of the observed metrics. For instance, the size
the points are represented on a map could be
controlled by the values of a metric (for example the
total amount of sales associated to a store). The way
the metrics affect the display of spatial-geometric
attributes can be user-defined and is called the
visualization-theme. We consider fundamental that a
SOLAP client provides the user with both table and
map visualisations, and that they are kept
synchronized.
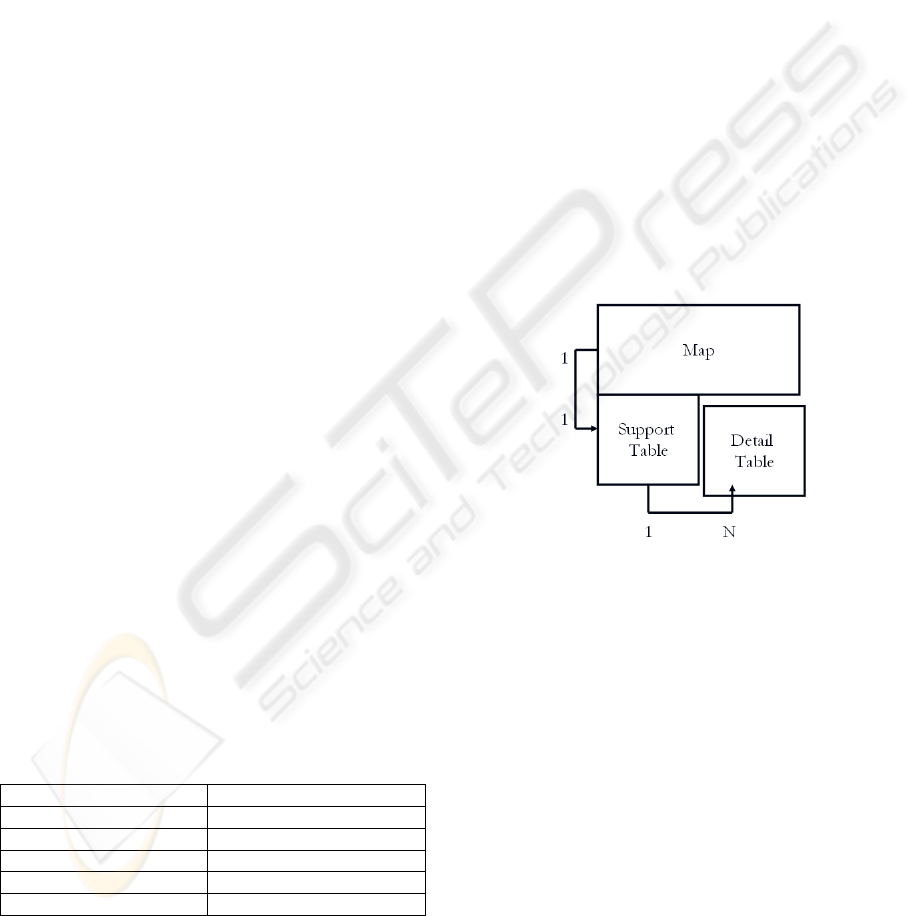
The proposed SOLAP GUI has the following
three areas (see figure 4): (i) a map where he spatial-
geometric attributes are displayed according to the
values of some metric and using a visualisation-
theme (ii) a support table, kept synchronised with
the map, that contains the spatial-semantic attribute
of reference related to the spatial-geometric
attributes used on the map and some metrics
(including that ones used on the visualisation-
theme); (iii) a detail table, related to the support
table, that could present some additional detail data
and metrics.
Figure 4: The three main areas.
Those three areas are filled with data from three
different, but related, queries. The map has a one-to-
one relation with the support table, in order to
guarantee the required synchronisation between the
data displayed on the map with the data displayed in
the support table. Each value of spatial-geometric
attribute is represented by a point or by a polygon
which visualisation is controlled by some metric
values present in the corresponding row on the
support table. The support table has a one-to-many
relation with the detail table and the required
synchronization is guarantee by applying
restrictions, to the detail table, using attributes and
values currently selected in the support table.
Figure 5 shows a typical OLAP analysis
displaying the sum of sales amount per store (for a
given period and for all products). Each row of
support table contains data for one store. The data
ICEIS 2007 - International Conference on Enterprise Information Systems
160
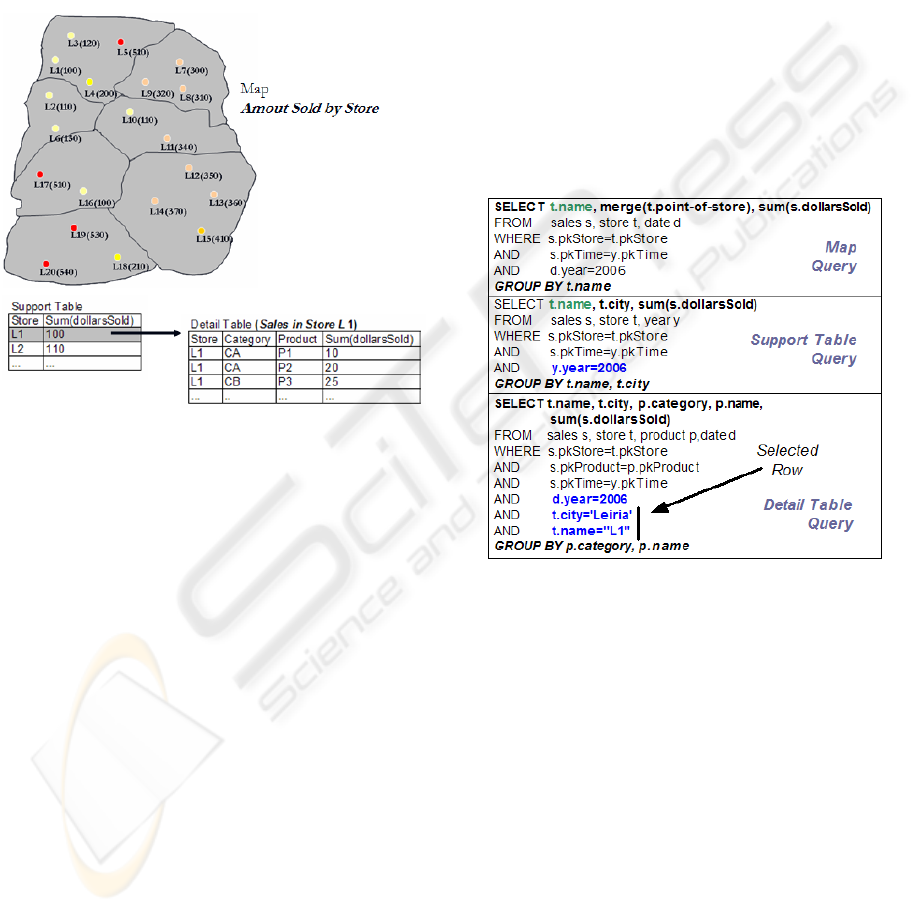
corresponding to one row is represented in the map
area, according to a visualization theme: each point
(the store location) is labelled with the store name
and its sum of sales amount; the point colour
depends on the sum of sales amount of the store. The
map also shows administrative divisions of the
country helping users contextualize the stores. The
detail table shows (for the user selected row in the
support table) the sum of sales amount distributed by
products.
Figure 5: Map, support table and detail table.
To guarantee the relation between the map and
the support table: (i) they are related by the spatial-
semantic attribute of reference. For instance,
points in the map have a corresponding attribute in
the table (name of the store); and (ii) granularity
must not be modified. Therefore is possible to add
(to the map or support table): (a) attributes of a
higher level then the spatial-semantic attribute of
reference; (b) attributes of others dimensions; and
(c) spatial-geometric attributes (intersections are
performed).
To guarantee the relation between the support
table and the detail table: (i) selected rows, in the
support table, controls data been display in the
detail table. Attributes present in the support table
are also present in the detail table which also shows
additional attributes. It is possible to add any
attribute (in contrast with what it happens in the
support table).
Figure 6 shows three related queries – one for
each main area. The first query has the spatial
attribute of reference ’name of store’ (t.name) and
loads the location of stores (points); the second
query also has the attribute ‘name of store’ (t.name)
and the attribute ‘city’ (t.city) (both belong to the
same hierarchy); finally, the third query has
restrictions that reflects selected values in the
support table (t.name=’L1’, t.city=’Leira’) – observe
that year=2006 is inherited by omission from the
second query.
4.2 Spatial Drill
Spatial Drills are executed in the following ways: (i)
using a total spatial-hierarchy (a spatial-geometric
attribute is replaced by another); (ii) adding or
removing some spatial-geometric attribute
(interception of spatial-geometric attributes). In a
spatial roll-up, through hierarchies, users navigate
from lower level spatial-geometric attributes to
higher level ones. The opposite happens in drill-
down (navigate to more detail areas of space).
Figure 6: Three queries for three areas.
In a spatial drill-down through the addition of
some spatial-geometric attribute interceptions are
made. The support table will have a spatial-semantic
attribute of reference by each spatial-geometric
attribute in the map. For instance, having the
attribute Polygon-of-City and adding the attribute
Polygon-of-Metropolitan-Area. Cities will be
divided in areas, corresponding to overlap relations
between cities and metropolitan areas. Each area
will have a different measure. It is not always
possible to perform this operation. For instance,
when dealing with geometric objects not spatially
comparable (points and polygons), or polygons that
does not overlap. In those cases, we propose that a
spatial-semantic attribute of reference goes to slice.
REVISITING THE OLAP INTERACTION TO COPE WITH SPATIAL DATA AND SPATIAL DATA ANALYSIS
161
4.3 Spatial Slice
As explained in the section 2.1 on spatial slice
operations restrictions are applied to dimensions’
attributes. We identify two mode of operand for
spatial slice: (i) using semantic attributes; (ii) using
geometric-attributes.
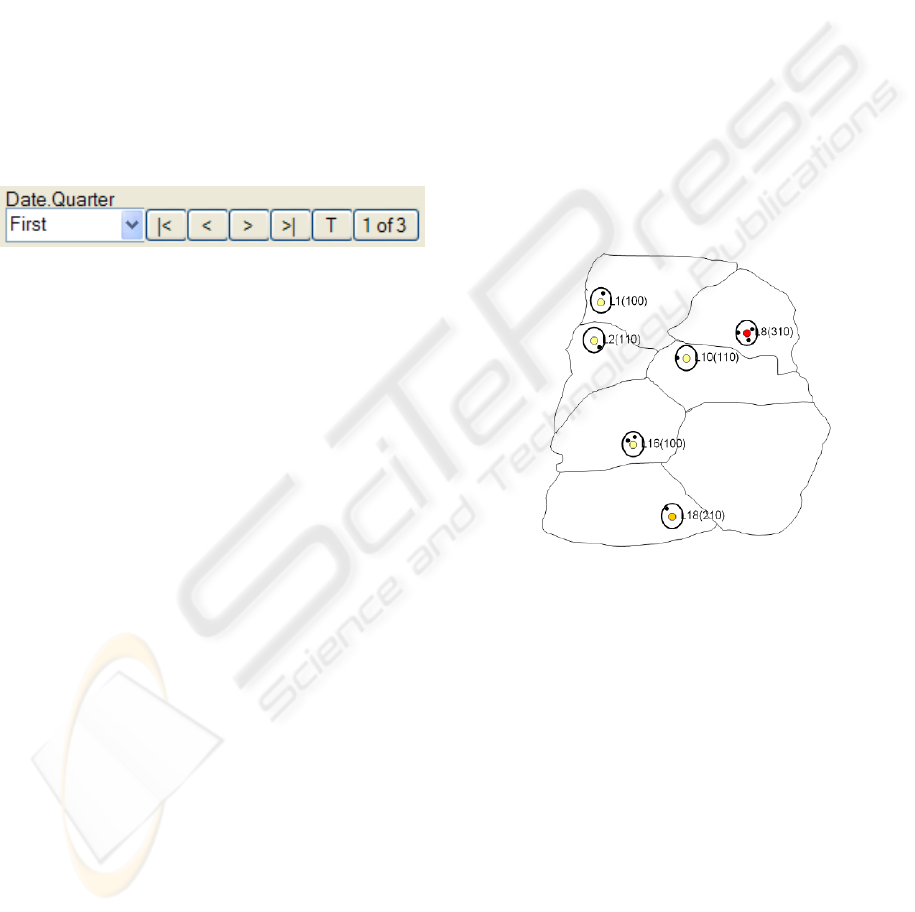
4.3.1 Spatial Slice with Semantic Attributes
In a spatial slice through a semantic-attribute the
spatial cube is restricted by values of that semantic
attribute.. To perform this operation we propose a
graphic control, called navigation bar (slider). Once
in a slice bar the attribute influence a subject in the
spatial cube. With a slider we can navigate through
values of attributes (go to: first, next, prior, last;
move to) (figure 7).
Figure 7: The slider, a map navigation bar.
This enables easy generation of maps, by simply
clicking in the buttons of the slider. For example,
users can look at the total sales of a product by
location of stores in the first quarter of a year and
then change to the next quarter enabling the graphic
identification of differences. On the fly, maps are
automatically generated. Usually, maps are created
by specialized human recourses, needs specific
software and take some time.
Another feature of the navigation bar is the
movie; using a time interval the current value of an
attribute changes automatically. That utility enables
the analysis in time and space. For example, using
the spatial-geometric attribute location of store,
fixing the year, and using a slider for month users
can look at the evolution of the total sales in the
months of the year. We consider this feature
interesting for others situations. For a data
warehouse that stores the thawing of glaciers it will
possible to see that evolution in space and time, and
detect what was the interval of time where there was
a bigger thawing.
4.3.2 Spatial Slice with Spatial-geometric
Attributes
A spatial slice with spatial-geometric attribute is
performed using a spatial-geometric attribute. It
consists in inquire a relation between a geometric
attribute and others geometric objects. For instance,
restrict data to sales persecuted in stores located at 1
km of main roads in some year. In this context we
identify three types of operations: (i) spatial-
topology slice; (ii) spatial-distance slice; (iii) spatial-
direction slice.
As the name states in a spatial-topology slice a
topology relation is inquired. There are nine possible
topology relations between two objects as identified
by Egenhofer (Egenhofer and Herring, 1994):
disjoint, meet, overlap, touch, inside, contains,
covered-by, equal, covers). For instance, display a
map with the total sales, in some year, for stores in
the border of metropolitan areas.
Spatial-distance slice uses distance operators to
detect if two objects are at some distance from each
other. For example, obtain the total sales of stores
located 5 km of concurrent shopping centers in
February of 2007 (figure 8).
Spatial-direction slice uses direction operators to
establish some direction relationship. For instance,
obtain the total sales, in some year, only in stores
located at north of some road.
Figure 8: Sales in stores located 5km of shopping centers
in 2006. A buffer of 5km is drawn around stores.
This kind of spatial slice is not available in
common OLAP system neither in OLAP system that
only uses spatial data for display concerns and it
requires a spatial database system (spatial data
types, spatial operators, spatial indexes).
4.4 Overlapping Spatial Cubes
When dealing with spatial cubes it becomes possible
to overlap spatial cubes. For example, overlap the
map with the amount of sales by district, in some
year, with the map with the amount of sales by store
in the same year. That enables to discover, in a
single view, the contribution of each store to the
overall value of sales (in a district). This feature is
not available in common OLAP systems - tables in
contracts with maps can not be overlapped.
ICEIS 2007 - International Conference on Enterprise Information Systems
162
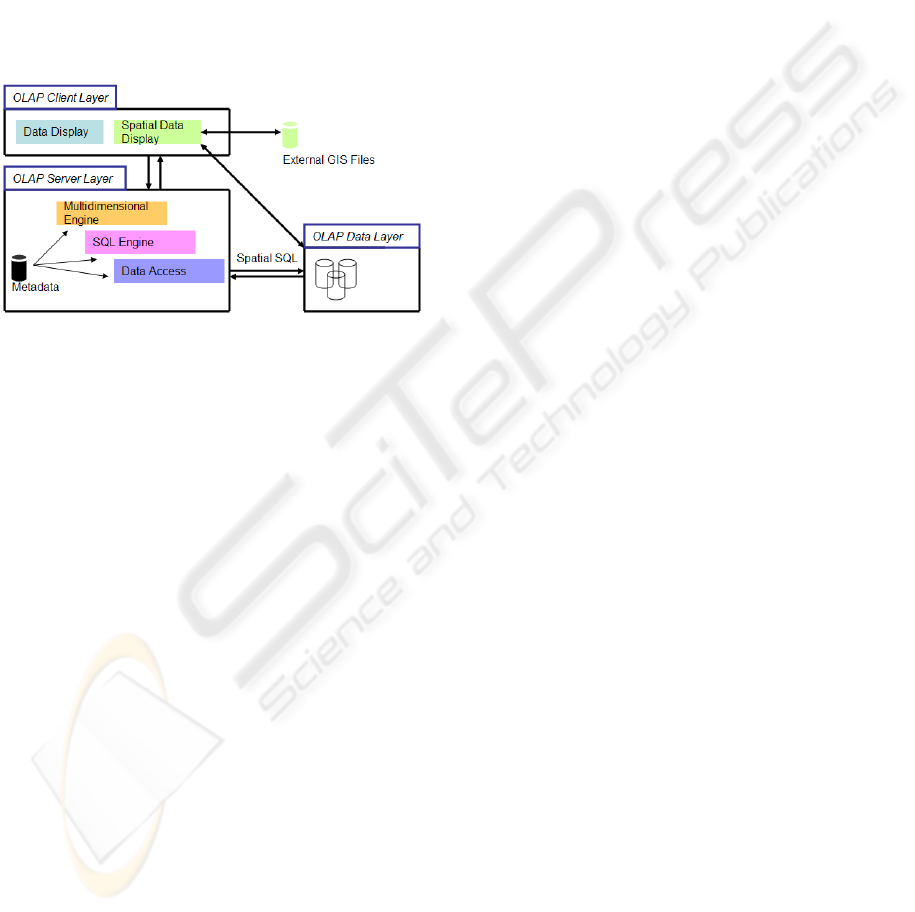
4.5 System Elements
In figure 9 one system architecture is proposed. It
has three layers as is usual in OLAP systems. The
elements are the following: (i) data layer - is a
spatial data warehouse; (ii) server layer - has a
framework of objects that represent the
multidimensional structure (this structure is
generated from metadata), a SQL engine that
generates on-the-fly spatial SQL statements and a
data access component for data retrieval; (iii) client
layer supplies a GUI for performing spatial OLAP
operations.
Figure 9: A system architecture.
From the GUI spatial operations are translated in
spatial SQL statements submitted to the spatial data
warehouse.
5 CONCLUSIONS
In this paper we propose an interface for easy and
rapid exploration of spatial data in OLAP systems.
The interface has three main areas (map, support
table and detail table) relate to each other through
one-to-one-to-many relation. Our spatial data model
consider the existence of one spatial dimension
compounded with spatial attributes, spatial
hierarchies and spatial measures (spatial-numeric
and spatial-geometric). The storage of geometric
data in the data warehouse brings some performance
issues, since geometric data needs more space and
more CPU than non-spatial data. Materialization and
algorithms for forwarding requests are important
steps for the viability of such a solution. Spatial
OLAP operations incorporate geometric operations
for answering questions not possible to answer in
common OLAP systems and can be applied in a
wide range of case of studies.
REFERENCES
Bédard, Y. (1997) Spatial OLAP. Vidéoconférence, 2éme
Forum annuel sur la R-D. Montreal, Canada, Geometic
VI: Un monde accessible.
Codd, E. F., Codd, S. B. & SALLEY, C. T. (1993)
Providing OLAP to User-Analyst: An IT Mandate.
Egenhofer, M. J. & Herring, J. R. (1994) Categorizing
Binary Topological Relations Between Regions,
Lines, and Points in Geographic Databases. IN
Egenhofer, M. J., Mark, D. M. & Herring, J. R. (Eds.)
The nine intersection: formalism and its use for
natural-language spatial predicates.
Han, J., Stefanovic, N. & Koperski, K. (1998) Selective
Materialization: An Efficient Method for Spatial Data
Cube Construction. IN WU, X., Ramamohanarao, K.
& Korb, K. B. (Eds.) Second Pacific-Asia Conference
on Research and Development in Knowledge
Discovery and Data Mining Melbourne, Australia,
Springer-Verlag.
Kimball, R. & Ross, M. (2002) The Data Warehouse
Toolkit, New Work, Wiley.
Malinowski, E. & Zimányi, E. (2004) Representing
spatiality in a conceptual multidimensional model.
Proceedings of the 12th annual ACM international
workshop on Geographic information systems
Washington DC, USA ACM Press
Matias, R. & Moura-Pires, J. (2005) Spatial On-Line
Analytical Processing: A Tool to Analyze the
Emission of Pollutants in Industrial Installations. In
Bento, C., Cardoso, A. & Dias, G. (Eds.) Portuguese
Conference On Artificial Intelligence Covilhã,
Portugal, Institute of Electronic and Electronics
Engineers, Inc.
Rivest, S., Bédard, Y., Proulx, M.-J., Nadeau, M., Hubert,
F. & Pastor, J. (2005) SOLAP technology: Merging
business intelligence with geospatial technology for
interactive spatio-temporal exploration and analysis of
data. ISPRS Journal of Photogrammetry & Remote
Sensing, 60, 17-33.
Winslow, J. (2005) Using the Power of Location
Intelligence to Enhance Business Intelligence.
MapInfo Corporation.
Workboys, m. & Duckham, M. (2004) GIS: A Computer
Perpective (Second Edition), London, CRC Press.
REVISITING THE OLAP INTERACTION TO COPE WITH SPATIAL DATA AND SPATIAL DATA ANALYSIS
163
