
DATA MINING CLUSTERING TECHNIQUES IN ACADEMIA
Vasile Paul Breşfelean, Mihaela Breşfelean, Nicolae Ghişoiu
Babeş-Bolyai University, Faculty of Economics and Business Administration, Teodor Mihali 58-60
400591,Cluj-Napoca, România
Călin-Adrian Comes
Petru Maior University, Nicolae Iorga 1,540088, Târgu-Mureş, România
Keywords: Cluster, data clustering, K-means algorithm, students, analysis, percentage relation.
Abstract: In the present paper the authors exemplify the connections among the undergraduate studies, continuing
education and professional enhancement on the foundations required by Romania’s integration in EU’s
structures. The study was directed to the senior undergraduate students and master degree students from the
Faculty of Economics and Business Administration, Babeş-Bolyai University of Cluj-Napoca, using
questionnaires in a collaborative approach, and processing the collected data by data mining clustering
techniques, graphical and percentage representations, through Weka’s implemented algorithms.
1 INTRODUCTION
Clustering is one of the fundamental operations in
data mining and can be defined as the process of
organizing objects in a database into clusters/groups
such that objects within the same cluster have a high
degree of similarity, while objects belonging to
different clusters have a high degree of dissimilarity
(San et al, 2004).
The notion of similarity can be expressed in very
different ways, according to the purpose of the
study, to domain-specific assumptions and to prior
knowledge of the problem (Grira et al, 2005).
Clustering divides, or partitions, a data set into
regions of high similarity, as defined by some
distance metric, called clusters. In most instances, a
cluster is identified by a prototypical vector called
the cluster center. Therefore, the problem of cluster
optimization is twofold: optimization of cluster
centers and number of clusters (Lee and Antonsson).
This process has developed into a widely studied
problem in a diversity of application areas, such as
data mining and knowledge discovery, statistical
data analysis, data classification and compression,
medical image processing and bioinformatics (Hung
et al, 2005).
In this article, the authors illustrate a series of
analysis and correlations conducted through
clustering techniques on Weka workbench, graphical
and percentage representations, over significant data
collected from senior undergraduate students and
master degree students at the Faculty of Economics
and Business Administration Cluj-Napoca.
2 THE CLUSTERING
ALGORITHM
The clustering algorithms can be categorized along
different dimensions (Zhao and Karypis, 2005)
based either on the underlying methodology of the
algorithm; the structure of the final solution; the
characteristics of the space in which they operate; or
the type of clusters that they discover.
Clustering algorithms generally follow
hierarchical or partitional approaches. Several
algorithms have been proposed in the literature for
clustering among whom the K-means and its
variants, such as the fuzzy c-means algorithm, are
the most popular algorithms.
In our research we used the clustering method
called FarthestFirst which implements the
transversal algorithm of Hochbaum and Shmoys,
quoted by Sanjoy Dasgupta (Witten and Frank,
2005), a simple, fast, approximation method based
on K-means algorithm. The general algorithm was
407
Paul Bre¸sfelean V., Bre ¸sfelean M., Ghi ¸soiu N. and Comes C. (2007).
DATA MINING CLUSTERING TECHNIQUES IN ACADEMIA.
In Proceedings of the Ninth International Conference on Enterprise Information Systems - AIDSS, pages 407-410
DOI: 10.5220/0002370404070410
Copyright
c
SciTePress

introduced by Cox in 1957, and it was first named
K-means by Ball and Hall, and MacQueen in 1967,
and since then it has become widely popular and is
classified as a partitional or non-hierarchical
clustering method (San et al, 2004).
The K-means algorithm gives good results only
when the initial partitioning is close to the optimal
solution (Hourani et al, 2004).In the FarthestFirst in
order to find k cluster centers, must follow the steps:
1. randomly choose one point as the first center
2. for i = 2 up to k
next center = point with maximal min-
distance to current centers.
3 DATA CLUSTERING AND
ANALYSIS
3.1 The Undergraduate Senior
Students’ Questionnaire
In our studies we used data collected from senior
undergraduate ad master degree students at the
Faculty of Economics and Business Administration
in Cluj-Napoca, using on-line and written surveys in
a collaborative approach, in the attempt to appraise
the impulse in preferring a certain the specialization,
the contentment upon the educational process and
cognitive skills and to evaluate their motivation in
continuing their education with post university
studies (master degree, Ph.D. studies). The collected
data was drawn off in Excel worksheets, resulting
400 articles with 35 attributes (Breşfelean et al,
2006). Our study work is based on Weka, a
machine-learning library developed at the University
of Waikato, providing Java implementations of
several methods for machine learning, data
preprocessing, and evaluation, and using the
Attribute-Relation File Format (ARFF) for input of
training and testing data.
3.1.1 Clustering and Cluster Representation
Using the FarthestFirst clustering method based on
K-means algorithm, we initialized the k cluster
centers to k randomly chosen points from the data,
which was partitioned based on the minimum
squared distance criterion (Maulik and
Bandyopadhyay, 2002). In our experiment, the k
parameter is 3, corresponding to students’ 3 choices
in continuing their post university studies: disagree,
neutral, agree. The cluster centers were then updated
to the mean or the centroid of the points belonging
to them. This entire process was repeated until either
the cluster centers did not alter or there was no
major change in the J values of two successive
iterations. At this point, the clusters were stable and
the clustering process ended.
By using the clustering process we separated the
students in clusters with dissimilar behavior, the
students from the same cluster embrace the closest
behavior, and the ones from different clusters have
the most different one. This process will help the
higher education institution to elaborate the most
efficient strategies for individuals (Breşfelean,
2006), (UBB, 2003), without the need to deal with
each individual student.
The students were divided into 3 clusters
(Breşfelean et al, 2006) each presenting specific
centroids, with a optimistic result after Weka
validation (27.4151 % of the instances were
incorrectly clustered):
Cluster 0: Students agree to continue their post
university studies (master degree, Ph.D. studies);
Cluster 1: Students do not agree to continue their
post university studies;
Cluster 1: Students are neutral to continue their post
university studies.
The present paper is focused on the students
belonging to Cluster 1 (the most unenthusiastic in
continuing their education), characterized by the
following choices:
-belong to the Marketing department (Mk);
-they do not agree to continue their education;
-gender: female;
-graduated a agricultural specialization high school;
-do not agree their expectations regarding the
specialization are fulfilled;
-are not satisfied with the fundamental knowledge
they obtained;
-do not agree they were given sufficient books,
course materials, case studies of the highest quality;
-do not agree the curricula were relaxed and gave
time to individual studying;
-are neutral regarding the fact that the faculty has a
good quality endowment;
-do not agree they have made contact to
specialization’s real problems, in curricula’s
practical activities;
-did not take part to grants/research contracts;
-do not agree to recommend the specialization to
future students;
-have a bad opinion about courses teaching methods
in the years of study;
-have a part-time job;
-do not benefit at all of parents’ material support;
-believe to find a job in Romania in Mk;
ICEIS 2007 - International Conference on Enterprise Information Systems
408
-scholastic situation: 3-4 exams were not passed.
The needed information is extracted from the
clusters’ centroids. Following this, we determined
that there were no common values fields for the
three clusters, and as a result all the fields contain
relevant information for the segmentation process.
“Programa_relax” attribute (opinion on relaxed
curricula) plays a substantial part in differentiating
the clusters population: cluster 0 - agree; cluster 1 -
disagree; cluster 1 - neutral. The same situation is
observed in the case of the following attributes:
”Asteptari” (opinion on expectations’ fulfillment
regarding the specialization), ”Recomanda” (opinion
on recommending the specialization to future
students), and the opinion on the quality of courses
teaching methods in the first and the last years of
study (“Anul_1” and “Anul_4”).
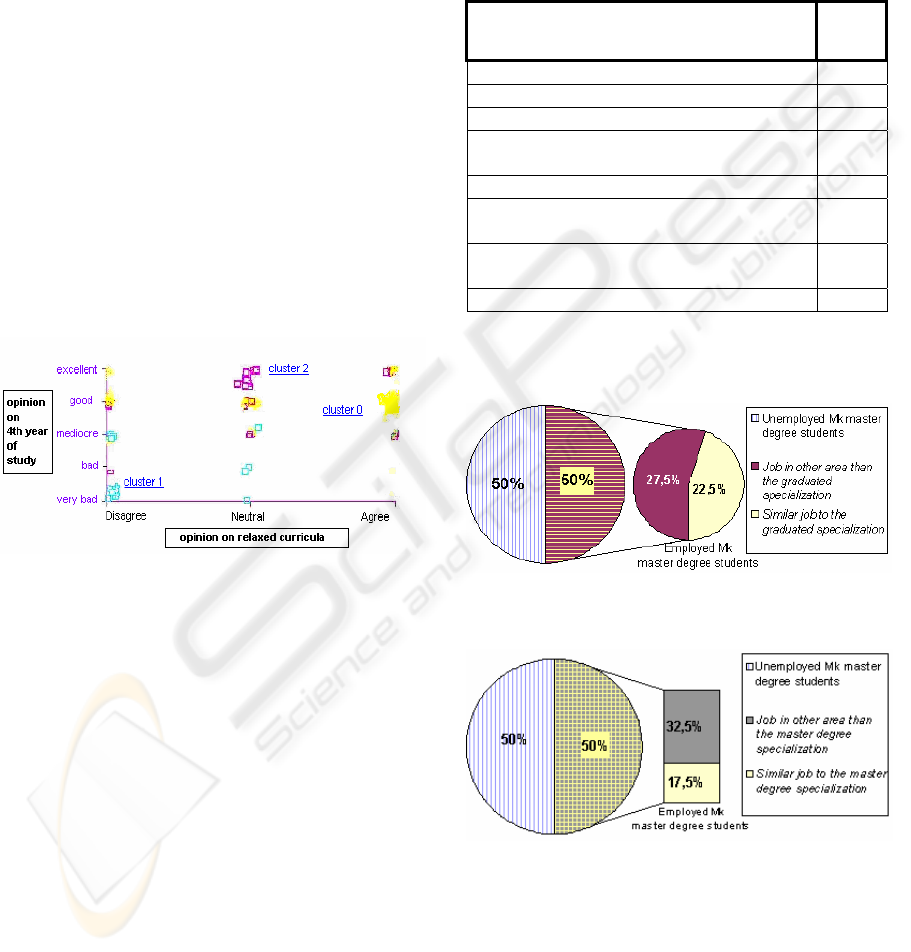
In order to obtain a graphical representation
(Figure 1) on the clusters (Breşfelean et al, 2006),
we chose 2 of the most significant attributes
(Programa_relax – opinion on relaxed curricula, and
Anul_4 – opinion on the 4th year of study).
Figure 1: Cluster graphical representation -dependent on
Programa_relax and Anul_4 attibutes.
3.2 Correlations with the Master
Degree Questionnaires
The understanding of students’ opinions,
satisfactions and discontentment regarding the each
component of the educational process, and the
option in continuing their education is a necessary
concern for every higher education institution
manager. It is important to associate the data
extracted from terminal year students’
questionnaires with graduate students’ data, at
present master degree students. Using the
information mined in the master degree
questionnaires, we prepared the next correlations
and analysis (Breşfelean et al, 2006): correlations
and percentage relations between the graduated
specialization and the master degree specialization,
between the current job and the graduated
specialization, between the current job and the
master degree specialization.
In the next table we present the data mined from
the master degree questionnaires, filtered to include
only the students from Mk master degree area.
Table 1: Mk master degree students on specific
cathegories.
Cathegories
No. of
studen
ts
Total Mk master degree students 40
Total Mk specialization graduates (40%) 16
Total other than Mk graduates (60%) 24
Job in other areas than the graduated
specialization
11
Similar job to the graduated specialization 9
Job in other areas than the master degree
specialization
13
Similar job to the master degree
specialization
7
Unemployed Mk master degree students 20
The following figures cover the correlations
linking diverse features of the research:
Figure 2: Correlation between the current job and the
graduated specialization.
Figure 3: Correlation between the current job and the
master degree specialization.
4 CONCLUSIONS
From the data clustering, analysis, correlation and
percentage relations presented in this study, we can
conclude that: - An important segment of the
DATA MINING CLUSTERING TECHNIQUES IN ACADEMIA
409

undergraduate senior Mk students are reluctant on
continuing their education;
- A small percent (22,5%) of the Mk master degree
students found a similar job to the graduated
specialization, and 17,5% of Mk master degree
students have an occupation similar to the master
specialization;
- Half of the Mk master degree students (50%) are
unemployed for different reasons, not mentioned in
the questionnaires;
- There is a tendency in the Mk master degree area
to attract a large number of graduate students from
other areas (60%) because of the financial support
obtained from different companies, banks etc.
Our research in the data mining area and
students’ behavior start with the clustering
techniques (Bresfelean et al, 2006) and continue
with decisional trees, various correlation with the
data extracted from the master degree students to
exemplify detailed behavioral models.
ACKNOWLEDGEMENTS
This paper was partially supported by the Faculty of
Economics and Business Administration, by the
CNCSIS Consortium Grant 8/2005, “Collaborative
Information Systems in the Global Economy” and
by the Babeş-Bolyai University Priority Themes
Grant 2/2005, “Collaborative Decision Support
Systems in Academic Environments”.
REFERENCES
Angelini, L., Nitti, L., Pellicoro, M., Stramaglia, S., 2001.
Cost functions for pairwise data clustering. Physics
Letters A 285, 279–285, 2001
Bação, F., Lobo, V., Painho, M., 2004. Clustering census
data: Comparing the performance of self-organising
maps and k-means algorithms. KDNet Symposium,
Knowledge-based Services for the Public Sector,
Bonn, Germany, June 2004
Breşfelean, V.P., 2006. Development Strategies for The
Universities’ Management Using Information And
Communication Technologies, InfoBUSINESS'2006
International Conference, "Alexandru Ioan Cuza"
University of Iaşi, Iaşi, Romania, 2006
Breşfelean, V.P., Breşfelean, M., Ghişoiu, N., Comes,
C.A., 2006. Continuing education in a future EU
member, analysis and correlations using clustering
techniques, Proceedings of EDU '06 International
Conference, Tenerife, Spain, December 2006, 195-200
Ghişoiu, N., Breşfelean, V.P., Faur,G., Vereş, O., 2006.
Collaborative Software Systems, The 3rd international
Workshop IE&SI, Timişoara, Editura Mirton, 2006
Grira, N., Crucianu, M., Boujemaa, N., 2005.
Unsupervised and Semi-supervised Clustering: a Brief
Survey. Review of Machine Learning Techniques for
Processing Multimedia Content, Report of the
MUSCLE European Network of Excellence (6th
Framework Programme). August 15, 2005
Hinneburg, A., Keim, D. A., 2000. Clustering Techniques
for Large Data Sets, From the Past to the Future.
University of Halle, PKDD 2000
Hung, M. C., Wu, J., Chang, J.H., Yang, D. L., 2005. An
Efficient K-Means Clustering Algorithm Using Simple
Partitioning. Journal of Information Science and
Engineering 21, 1157-1177, 2005
Jain, A.K., Murty, M.N., Flynn, P.J., 1999. Data
clustering: a review, ACM Computing Surveys 31,
1999
Jung, Y., Park, H., Du, D.Z., Drake, B., 2003. A Decision
Criterion for the Optimal Number of Clusters in
Hierarchical Clustering, Journal of Global
Optimization 25: 91–111, Kluwer Academic
Publishers 2003
Koren, Y., Harel, D., 2003. A Two-Way Visualization
Method for Clustered Data. KDD’03 Washington, DC,
USA, ACM 2003
Lee, C.-Y., Antonsson, E.K., 2000. Dynamic Partitional
Clustering Using Evolution Strategies, Proceedings of
the Third Asia Pacific Conference on Simulated
Evolution and Learning
, IEEE, New York, 2000
Lipai, A., 2003. Finding Costumer Profile using Data
Mining, The Sixth International Conference On
Economic Informatics, Academy of Economic Studies,
Bucharest, Romania, May 8-11, 2003
Maulik, U., Bandyopadhyay, S., 2002. Performance
Evaluation of Some Clustering Algorithms and
Validity Indices, IEEE Transactions on Pattern
Analysis and Machine Intelligence, Vol. 24, No. 12,
December 2002
MacQueen, J., 1967. Some methods for classification and
analysis of multivariate observation. 5th Berkeley
Symposium on Mathematical Statistics and
Probability. 1967: University of California Press.
San, O. M., Huynh, V. N., Nakamori, Y., 2004. An
Alternative Extension of The K-Means Algorithm for
Clustering Categorical Data. Int. J. Appl. Math.
Comput. Sci., Vol. 14, No. 2, 241–247, 2004
Universitatea Babeş-Bolyai Cluj-Napoca, România, UBB
2003. Plan Strategic de dezvoltare a Universităţii
Babeş-Bolyai 2004-2007, Cluj-Napoca 2003
Witten, I. H., Frank, E., 2005. Data mining : practical
machine learning tools and techniques, 2nd ed.,
Morgan Kaufmann series, Elsevier Inc., 2005
Zhao, Y., Karypis, G., 2005. Data Clustering in Life
Sciences. Molecular Biotechnology, Volume 31,
Humana Press Inc., 2005
ICEIS 2007 - International Conference on Enterprise Information Systems
410
