
BUSINESS PROCESS VALIDATION
Testing Before Designing
Cornelis G. F. [Kees] Ampt
Eindhoven University of Technology, Eindhoven, the Netherlands
Keywords: Testing, architecture, business, designing, requirements, models, analyzing, tools.
Abstract: Rather than testing at the end of software projects, with subsequent need to redesign major parts, the
Business Process Validation (BPV) method aims at systematic testing from the start of a project, already in
the requirements phase, up to final delivery. It embraces three phases: Transformation Model, Service
Object Model, & IT/AO Model. The core of the Service Object Mode are classification trees, based on
initial ideas as laid down in the Transformation Model. A prototype of a software tool to automate the
classification tree construction, has been developed as part of a Masters Thesis project. First tests resulted
for small projects in no significant time reduction. However, for larger ones a time reduction of over 50% is
achieved compared to development of the classification trees by hand, while for all projects several
automated consistency checks can be performed. Real life tests are underway for the coming months.
1 INTRODUCTION
Large IT-projects often are delayed because during
the final test phase (when all the software has been
delivered and is tested in an integration test
environment) errors are detected, caused by a design
fault, made in the very beginning of the project.
These kind of errors typically take a lot of time and
money to correct, because a substantial part of the
complete development project has to be re-executed.
The Business Process Validation method (Smit,
2005), primarily intended as a test method, embraces
– during the full program cycle of an IT project –
judgment of the following elements: (1) correctness
and completeness of the (revised) idea or
requirements for the business case as given by the
executive (who pays the project); (2) correctness and
completeness of both the process and chain design
(the workflow), and if these satisfy the (revised)
requirements; (3) do sub-projects, at delivery time,
deliver products supporting the business process?
1.1 Related Work
It appears if methods like the Unified Modeling
Language (UML) are sometimes seen as a tool to
resolve all problems, although others recognize
limitations (De Cesare et al, 2003; Willams, 2003).
How about Extreme Programming? That is also a
method advocating testing before developing. It has,
however, the tendency to prescribe developers
exactly how to proceed (Owen Rogers, 2004).
Michael Fagan developed the Fagan inspection
process. (Fagan, 1976; 1986) Rather than checking
afterwards, control points are built into the process
from the start on. Several organizations use such a
technique. However, the world is changing so
rapidly that many IT projects are started before
requirements are mature and fully crystallized.
Therefore, (constant) software revision – due to
changing circumstances – has become a fact of life.
Usually sub-projects take care of their own test
trajectory, applying methods as TMap (Koomen &
Baarda, 2004) or TestFrame (Buwalda et al, 2001),
which are, however, not suitable for large projects.
The remainder is organized as follows: Section 2
describes some characteristics of the BPV method;
section 3 the prototype tool designed to assist in an
efficient use of BPV; followed in 4 by conclusions.
2 BPV
Business Process Validation (BPV) is a test method
that should be applied during the entire project
cycle, shaping initial ideas up to final delivery. It is
mainly used for large, complex systems, consisting
of several sub-projects resulting in new or adapted
554
G. F. [Kees] Ampt C. (2007).
BUSINESS PROCESS VALIDATION - Testing Before Designing.
In Proceedings of the Ninth International Conference on Enterprise Information Systems - ISAS, pages 554-558
DOI: 10.5220/0002378905540558
Copyright
c
SciTePress

systems, supporting a business process, by which an
organization generates its profit or which is the
reason for its existence. BPV can be helpful for
design and development. The Transformation
Model – an overview of input, output and additional
objects in the (business) processes, based on initial
requirements – is starting point, focusing on what
should be achieved. The Service Object Model, a
detailed specification for each process, is splitting up
business (and quality) requirements into a
classification tree, showing which objects result in
different cases. The IT/AO Model – with the help of
sequence diagrams – provides logical test cases.
The BPV method supplies test cases based on
Idea, Business Process Design, and Chain Design.
These test cases are directly forwarded to both
designers and developers, who should carry out
initial tests and authorize these if in line with the
original requirements. Ideas of executives will
change and thus also the test cases.
2.1 Transformation Model
The Transformation Model translates a business
process – considered from the perspective of a
(perhaps internal) client – into an outline model,
making comparison easy between existing and
future situations, including alternatives. This model
is focusing on what should be implemented, rather
than how to implement, i.e. it is important to know
the initiating Input Object (a client’s idea or wish),
deliverables as Output Objects and other objects –
called Catalyst Objects – that may influence the
output. The values of the catalysts determine which
objects are generated or destroyed. The model has a
layered structure that helps identifying main and
supporting processes. A major activity is
establishing the meaning of objects and processes in
a standardized manner, with the accompanying
quality requirements, in practice often the basis for
acceptation criteria.
As example: consider a (simplified) Customer
Loyalty Program of a large nationwide company for
electricity, gas, radio/TV signals, Internet access,
and mobile telephone services. Addresses of many
customers are known. However, are all correct?
(Near) duplications are not unlikely as traditionally
each sector had its own address base. With prepaid
mobile phones no address may be known at all. The
company has two goals with the loyalty program: (1)
strengthening current customer loyalty; (2) better
knowing the customers in order to allow an accurate
and personalized approach for which correct up-to-
date addresses are needed.
Who is the customer? The executive has decided
to aim at households, defined as people living at one
address. The customer thus defined is not necessary
the same as the one who signed the contract nor who
pays the bill. There may be two addresses, e.g. also a
holiday home or while moving. The head of the
household may get bonuses in the Loyalty Program.
A Transformation Model is prepared while the
executive is still busy developing ideas. During this
phase these are likely vague/uncertain, although an
urge to start the project might be present as well.
After all, there are high expectations and the just
developed business case is considered to be very
positive. Freezing and testing the initial idea in order
to establish its sense of reality is dearly needed. The
BPV Transformation Model can help in judging
completeness and consistency of the initial idea,
asking the executive to decide on choices, although
not all consequences can be judged at that stage.
A first virtual test can now be executed, after
which the executive should be able to assess the
need for adaptation of the business case and whether
the project is still profitable.
Reconsider the Loyalty Program example: (1)
Figure 1: Transformation Grid. Processes are shown without mutual relations as in the full Transformation Model.
BUSINESS PROCESS VALIDATION - Testing Before Designing
555

determine heads of households and approach these
with a (personalized) mailing; (2) heads of house-
hold can register via Internet for a Loyalty Contract
and determine which services to embrace; (3) each
payment will result in Bonus Loyalty Points that can
be used for rebates, free magazines and other gifts.
The company wishes to mail the customer,
motivating him/her to join the Loyalty Program. The
ultimate goal is of course to trigger the customer to
extend the Loyalty Contract. Although others can be
present we restrict our attention to these three.
2.2 The Transformation Grid
In order to allow a quick overview, a simple list of
objects is made. This is the basis for the prototype
tool that should assist in converting the
Transformation Model, containing all relevant
objects, into the Service Object Model. The latter
shows the consequences of the Catalyst Objects for
the various Output Objects. The tool allows for three
major roles of objects, i.e. Catalyst {k}, Output {o},
or Destroyed Object {x}. As we are going to see
further, an object can play multiple roles. Input
Objects {i}, representing wishes have only one role.
See as example Figure 1.
For each row in the Grid a Service Object Model
is made. Several rules apply: (1) each process has
just one Input Object {i}. However, there may be
various, linked processes in the Transformation
Model; (2) a Catalyst {k} requires a classification.
This is tested in the tool; (3) a process should always
contain at least one Output Object {o} or a
Destroyed Object {x}. A customer that is not paying
could be removed from the customer list while could
be added to the dubious customers list. Thus a new
Output Object {o} is created while an existent
Catalyst Object {k} could be destroyed.; (4) The
Output Object {o} of one business process often acts
as the Catalyst Object {k} for a business process at a
higher level. Figure 2 shows that Potential Customer
can act as a {k} and {x} Object in the same process.
2.3 Service Object Model
For each business process identified in the Trans-
formation Model, a more detailed Service Object
Model will be prepared. This is a classification tree,
corresponding to a single business process of the
Transformation Model, such that: (1) the Input
Object {i} serves as the root node; (2) catalyst
Objects {k}are internal nodes with branching factor
of at least two; (3) Output {o} and Destroyed
Objects {x} are either leaves or are associated with
arcs connecting the nodes. The consequences that
Catalyst Objects have for the realization of Output
Objects will thus become clear.
For each Input Object (wish) a full classification
tree is drawn in which Catalysts and Output Objects
are shown in relevant branches. As all cases are
outlined, the Service Object Models can provide
good test cases for the process integration and chain
tests, in order to demonstrate that the business
process conforms to the wish of the executive.
During this phase an assessment should be made
to determine if quality requirements for the Output
Objects are realistic. Also better insight is obtained
in the applied objects with their qualities. A test
engineer can herewith verify if the required quality
of Output Objects is obtainable.
Altered choices by the executive will lead to
adapted Output Objects and thus an adjusted
Transformation Model. Any change in this model
will lead to an adaptation of one or more Service
Object Models and consequently also test cases.
However, amendments of the business process at a
later stage can profit from the knowledge laid down
in the models and the test cases.
Figure 2: Classification for the wish to become a participant in the Loyalty Programme. The root (Input Object) is always
top left.. Each Catalyst Object {k} should be followed by a classification that starts always one row below. Afte
r
completion of the classification with all branches, the information can be transfereed to another Excel sheet that is used as
input for the drawing program. Checks are performed before the transfer and, if resulting, an error list provided.
ICEIS 2007 - International Conference on Enterprise Information Systems
556

3 THE PROTOTYPE TOOL
The manual construction of the often quite extensive
classification trees of the Service Object Models can
be rather labor intensive and error prone. Therefore a
prototype tool has been developed assisting in the
development of the Service Object Models. Based
on the rules described above, the Transformation
Grid is taken as a starting point.
For each row in the Grid a new Service Object
Model (a separate Excel sheet) will be produced
containing all objects, listed from left to right
starting with a single Input Object, next the Catalyst
Objects, proceeding with Output Objects, finishing
with the Destroyed Objects. Since an object may
play different roles, it can appear more than once in
the Service Object Model. See Figure 2. To avoid
inconsistencies the Excel sheet is protected,
however, with provisions to: (1) add classification
branches, thereby copying all information already
available to the right of the current object. Each
branch will start below the row containing the
Catalyst Object that required the classification; (2)
swapping Objects in the same row; (3) deleting
Objects, if necessary with the complete branch to the
right of the current object; (4) inserting Objects if
the Object has not been used yet in the current
branch, looking from root to the leaves. After
classification value Known Participant the Object
{o}Welcome Mailing could have been added
(although here not appropriate), while after
{k}Participant the Objects {x}Potential Participant
or {o}Savings Account could not have been added as
they are already used in at least one branch; (5)
afterwards adding extra classification values,
thereby, if needed, shifting downwards already
available information. Perhaps sending of Welcome
Mailing is somewhat slow. (Maybe the result of
relaxed quality requirements?) Therefore possibly an
extra value between Known Participant and No
Participant yet should be added. It is, however, not
unlikely that additional Output Objects would be
required as well (that can be added to the existing
Transformation Grid); (6) amending classifications
values. In the example just above Known Participant
could for instance have to be changed into Known
Participant, Welcome Mailing sent.
3.1 Working with the Tool
The initial idea was that the test engineer would
prepare the classifications from left to right, i.e.
starting just after the {i} Object. The method is not
based on a graph but on a full tree. It is advan-
tageous to swap certain Objects that occur in many
branches with the same classification values more
towards the leaves of the tree. These classifications
can be copied automatically when adding
classifications near the root. This example does not
show that clearly. Drawing a full graph by hand with
many nearly identical branches can be labor-
intensive. First preparing with the tool the (nearly)
common parts up to the leaves and subsequently
copying these branches may be quick – often under
10 minutes work – leaving adding or deleting
objects in branches as a less labor intensive task.
The example (Figure 2) is rather simple. Note
the two {x} Objects, indicating that the Potential
Participant can be deleted, (now) being a
Participant. The executive wished to make it easy to
register as a Participant. Several tests such as: is the
Potential Participant perhaps a Defaulter (bad
payer), are performed when evaluating the wish to
extend the Loyalty Contract.
The layout of the classification tree in Figure 2
could contain human errors. Extensive checks can be
performed in order to determine: (1) are Objects
marked with o, k, and/or x in the Transformation
Grid at least once used in the tree? They could be
missing through deletion or by amending the Grid;
(2) are there any Objects in Service Object Model
not present in the Transformation Grid? This could
happen if one of the marks o, k, and/or x is deleted
in the Grid; (4) is there a classification with at least
two values and branches after each {k} Object; (5)
with at least one {o} or {x} Object after each
branching value in the classification?
The information is then converted into a table for
import into a drawing program. See Figure 3. Tests
with over 1000 leaves showed that checking the full
tree and converting it to the format required for the
drawing program took only a few minutes. For each
Input Object a sheet can be added. Quite often later
one wants to amend somewhat the wording of the
Objects specified in the Transformation Grid. The
tool allows this, checking the integrity over Service
Object Models on different Excel sheets.
It may happen that one has built a nice tree and
later wishes to add an extra {k} Object, or to swap a
{k} Object that already contains a classification with
another one, without branching, more to the root.
This swapping of {k} Objects is allowed and each
choice text will be preceded by ##!## as warning
that the texts may have to be amended.
As example, when drawing the tree for the input
object Wish to extend the Loyalty Contract of Figure
2 one has already added classification values to
{k}Defaulter and not yet to {k}Participant, with that
last Object still in the same row. Thus, these Objects
can be swapped, with warnings for the classification
texts, as they may require an amended value. Before
transferring the information it is also checked if all
these warnings have been removed.
BUSINESS PROCESS VALIDATION - Testing Before Designing
557
4 CONCLUSIONS
In the IT-world there are many factions, each
defending their own inventions, models and tools.
BPV appears to some just another branch of a huge
tree. There are, however, certain advantages:
performing tests before embarking on the
development, without insisting on special tools and
methods for the developers. This helps in identifying
the business case with constraints, while leaving
sufficient freedom for developers to apply best
practices.
Drawings, augmented with standardized tables
appear to be a good vehicle for communication with
executives. Use cases as in UML could have the
same advantage. BPV, starting with requirements,
without discussing details of an implementation,
helps to identify the real issues within a project. The
method has been applied successfully for large
projects.. The drawings are a good help for
corrective, adaptive and ameliorating maintenance.
A prototype tool has been made for BPV,
preparing the classification and drawings of the
Service Object Model for communication with
executive and developers. It is outside the scope of
this paper to provide detailed hard figures yet. The
prototype tool showed a speedup of at least 50% for
larger drawings, while greatly improving the
consistency and management for any project. As a
next step one might wish that changes made in the
drawings would immediately be ‘translated back’ to
the Transformation Grid and other underlying data.
Also an interactive tool in which the executive could
immediately see consequences of certain choices
would be desirable.
ACKNOWLEDGEMENTS
This work has been performed with valuable help
and advice of Marleen de Jonge, Ine Keijzer, Klaas
Smit, Miel Willems (Atos Origin) and Alexander
Serebrenik (Eindhoven University of Technology).
REFERENCES
Buwalda, Hans et al, 2002. Integrated test design and
automation: using the TestFrame method. Addison-
Wesley, Boston.
Cesare, Sergio de, 2003. Business Modelling with UML:
Distilling Directions for future Research. In:
Enterprise Information Systems IV, p. 153 – 162.
Kluwer Academic Publishers, Dordrecht, Boston,
London.
Fagan, M.E., 1976. Design and Code inspections to reduce
errors in program development, IBM Systems Journal,
Vol. 15, No 3, p. 258-287.
Fagan, M.E., 1986. Advances in Software Inspections,
IEEE Transactions on Software Engineering, Vol. SE-
12, No. 7, p. 744-751.
Koomen, Tim & Baarda, Rob (ed.), 2005. TMap Test
Topics. Tutein Nolthenius, ‘s-Hertogenbosch.
Owen Rogers, R., 2004. Acceptance Testing vs. Unit
Testing: A Developer’s Perspective. In: Extreme
Programming and Agile Methods - XP/Agile Universe
2004, p. 22 – 31. Springer, Berlin, Heidelberg
Smit, Klaas, 2005 Business Process Validation, Academic
Service. The Hague.
Williams, Ashley, 2003. Examining the Use Case as
Genre in Software Development and Documentation.
In: Proceedings of the 21st annual international
conference on Documentation, p.12 – 15. ACM Press.
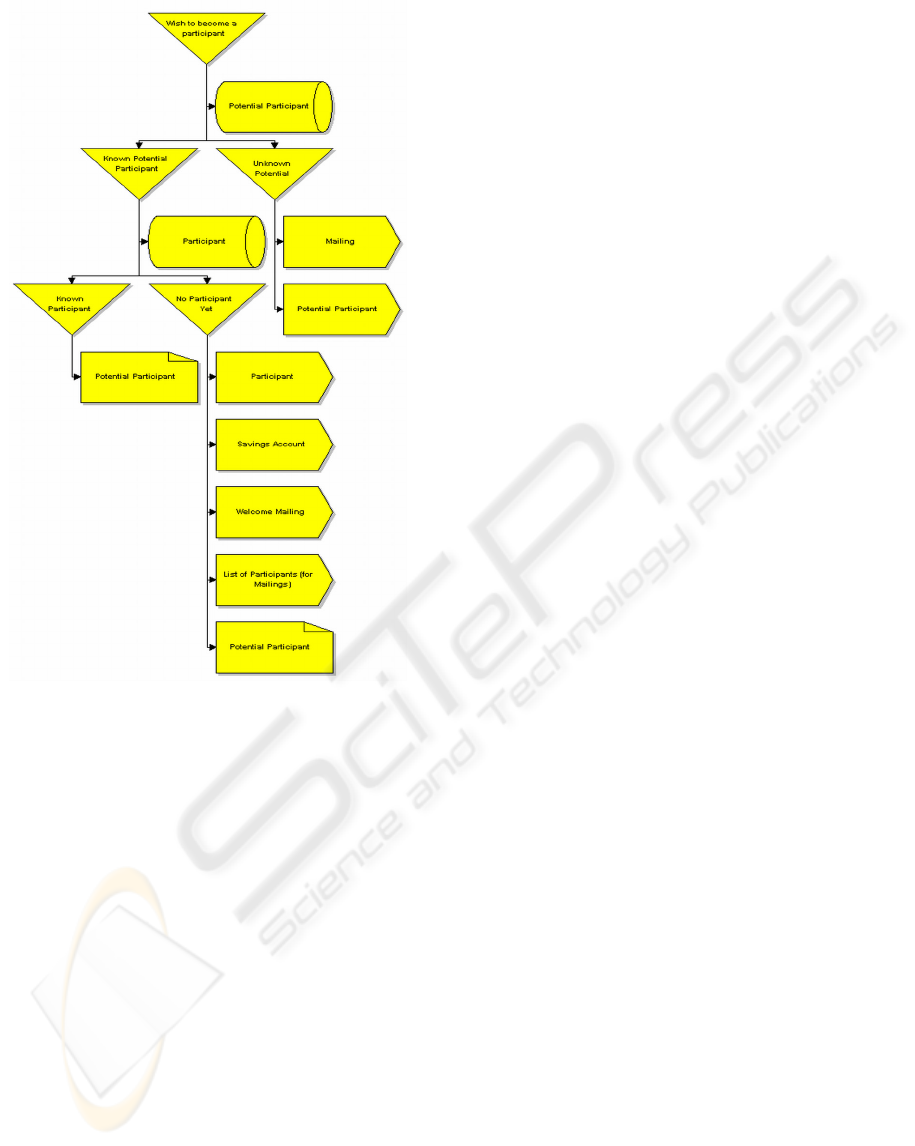
Figure 3: Service Object Model of Figure 2. The triangles
are the Input Object and values after a Catalyst Object in
the classification. Catalysts are drawn as cylinders.
Output Objects are given as arrowed boxes and Destroyed
Objects as boxes with a folded corner. These drawings
are normally discussed with the executive and hande
d
over to the development team with acompagnying tables.
ICEIS 2007 - International Conference on Enterprise Information Systems
558
