
TREND ANALYSIS BASED ON EXPLORATIVE
DATA AND TEXT MINING
A Decision Support System for the European Home Textile Industry
Andreas Becks and Jessica Huster
Fraunhofer-Institute for Applied Information Technology FIT, Schloss Birlinghoven, 53754 Sankt Augustin, Germany
Keywords: Text mining, data mining, association analysis, concept-drifts, ontology-based knowledge-flow system.
Abstract: Trend-related industries like the European home-textile industry have to quickly adapt to evolving product
trends and consumer behaviour in order to avoid economic risks generated by misproduction. Trend
indicators are manifold, reaching from changes in ordered products and consumer behaviour to ideas and
concepts published in magazines or presented at trade fairs. In this paper we report on the overall design of
the Trend Analyser, a decision support system that helps designers and product developers of textile
producers to perform market basket analyses as well as mining trend-relevant fashion magazines and other
publications by trend-setters. Our tool design brings together explorative text and data mining methods in an
ontology-based knowledge flow system, helping decision-makers to perform a better planning of their
production.
1 INTRODUCTION
Trend-related industries like the European home-
textile industry face a severe economic risk: While
preferences and consuming behaviour of consumers
do change very quickly, producers have to flexibly
adjust to these trends. If producers misinterpret or
even overlook trends, their production planning will
be faulty and as a consequence non-marketable
products will stick to the stocks while on the other
hand existing market potentials cannot be leveraged.
The situation is complicated by the fact that players
in this industry do only communicate with their
direct customers but do not have a common
knowledge base of product and ordering data, or
consumer preferences.
The European project AsIsKnown (Valtinat,
2006) creates such a knowledge base for the
European home textile industry and implements a
couple of services to support cross-sector knowledge
flow and trend detection. Industry partners,
expecting an added value for the whole sector, are
ready to exchange their product and ordering data
for additional services they get in return. From a
methodical perspective, AsIsKnown develops an
ontology-based decision support system with text
and data mining tools as core functionalities.
In this paper we report on the overall design of
AsIsKnown’s Trend Analyser. This expert module
analyses ordered products, consumer behaviour and
further trend indicators in the home textile industry,
helping the industry to detect current and future
trends by utilizing explorative text and data mining
methods.
The underlying research question is: How should
a decision support system that helps knowledge
workers in creative application domains to
effectively identify future trends be designed?
Therefore, we combine field-tested as well as novel
methods of interactive data analysis and adapt them
to the requirements of product designers and
marketing specialists. The tools designed in this
phase are then subject to an extensive field
evaluation.
Companies and especially market analysts have
to monitor particular fields for recent trends that
may impact the company. For them it is important to
detect emerging topics early and how they evolve
over time. Approaches reach from methods from
traditional information retrieval to classical machine
learning (Kontostathis, 2003, 2004). Designers in the
textile sector need not only to know about upcoming
main topics but about materials and colours and in
which contexts they are mentioned. Our proposed
system falls into the semi-automatic category of
253
Becks A. and Huster J. (2007).
TREND ANALYSIS BASED ON EXPLORATIVE DATA AND TEXT MINING - A Decision Support System for the European Home Textile Industry.
In Proceedings of the Ninth International Conference on Enterprise Information Systems - AIDSS, pages 253-258
DOI: 10.5220/0002379602530258
Copyright
c
SciTePress
systems for emerging trend detection. The designer
will be supported in using their experience and back
ground knowledge during trend detection.
In the next sections we describe each component
of our Trend Analyser in detail and how we are
going to realise them.
2 OVERALL SYSTEM DESIGN
Having access to various trend-relevant data sources
like digitalised fashion and trend magazines,
aggregated ordering data from all producers, and
click data from computer-based product catalogues
running at the points of sales, the Trend Analyser
addresses some major shortcomings of the current
way to assess trends, i.e. it enables (a) systematic
evaluation of colour families and material groups
which are mentioned in fashion and trend
magazines, and allows (b) market basket analyses on
sales and product data of the entire industry.
The required functionality of the Trend Analyser
thus falls into two categories:
(1) A colour and material filter that helps users
to analyse the frequencies of colours, colour
families, or material types from magazines and trend
books and assess the development of colour and
material statistics over time. Particularly important is
to look for concepts like colour, material, structure
or design of surface, recognise names of architects,
designers, etc. as they appear in the magazines,
recognise new terms describing colours or surface
structures, dominant colours in magazines or articles
and their development over time,
(2) Functionalities of association mining that
help to analyse frequent combinations of materials
and colours as well as product combinations that
consumers or designers like to try out. This
combination analysis of ordering data and consumer
behaviour stored in the AsIsKnown’s data
warehouse refers to different aspects of a market
basket analysis, addressing questions like ‘What
type of customer buys what?’
These two components for analysing trend-
relevant data are accessible via the Trend Analyser
portal. The portal will give role-based access to
several classes of users. In particular designers and
marketing staff will have functionality to perform
their individual analysis.
The following sections describe the solution
design of each component in more detail,
concentrating on the novel trend-analysis
functionality. Sections 2.1 and 2.2 depict the
functionality from the users point of view whereas
section 3 describes the methods used to realise the
presented functionality.
2.1 Detecting Terminological Drifts
Starting the colour and material filter, the first thing
to do for the expert user is to set up an analysis
matrix (cf. Figure 1). The analysis matrix defines the
groups of magazines or articles and the period and
aggregation level of time for which trend-relevant
concepts, represented in a domain ontology, in the
magazines shall be analysed. This is done in three
steps:
(1) Define groups of magazines to be analysed:
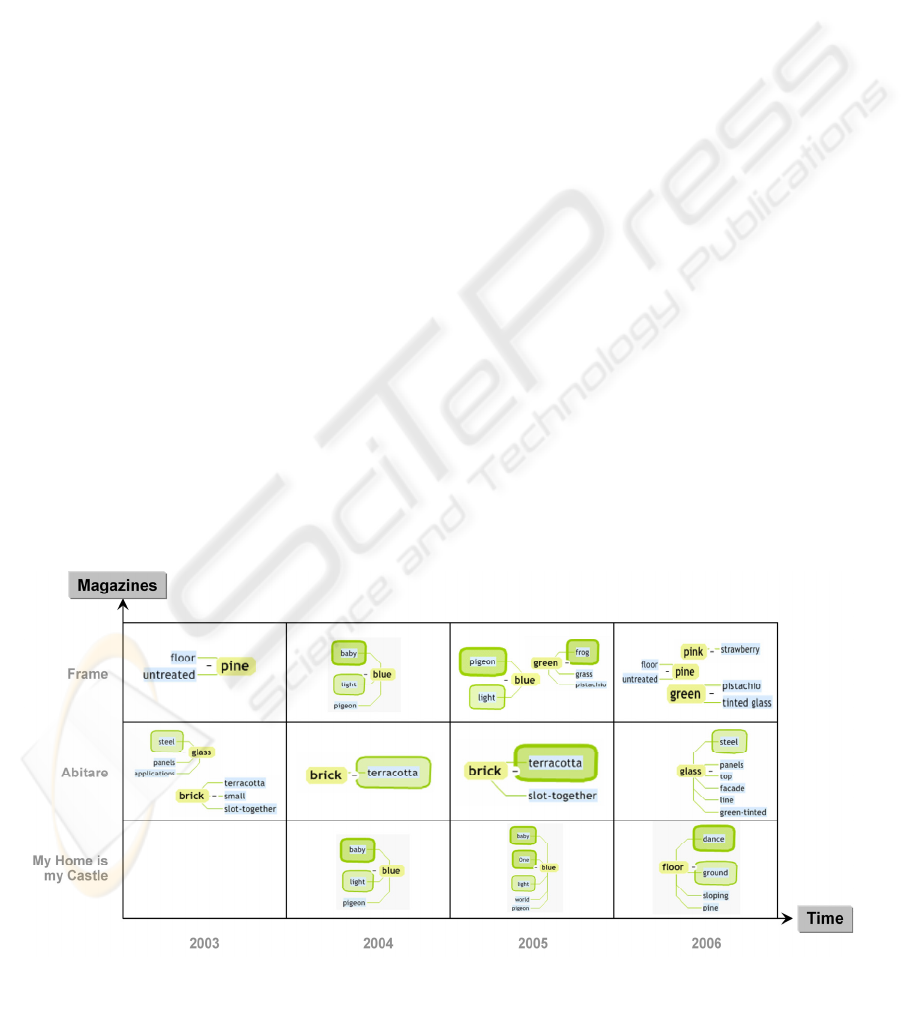
Figure 1: Analysis matrix with term context stars.
ICEIS 2007 - International Conference on Enterprise Information Systems
254
The expert user selects specific magazines or articles
to analyse. Each magazine group the user defines
will correspond to one row in the analysis matrix.
(2) Define period and aggregation level of time:
The expert user specifies the period of time to be
considered (start and end date) and the aggregation
level of the time axis of the analysis matrix (e.g.
monthly, quarterly, or yearly). The grouping of
analysis results in the columns of the matrix will be
done according to the aggregation level.
(3) Define contents of the matrix cells: Finally,
the expert user defines the concepts he wants to
analyse. That is, he asks for the colours, materials,
certain architects, etc. mentioned in the magazines.
Given a set of target concepts the expert user has
selected from the ontology, the Trend Analyser will
compute a set of term context stars, one for each
concept in each cell of the analysis matrix.
A term context star (cf. cell content of matrix in
Figure 1) is a graphical representation of a concept
and terms that appear in the context of this concept
in the considered magazines.
• The context is determined by grammatical rules
and refers to adjectives, nouns or other
components of phrases surrounding the concept.
Whereas the concepts are given, contextual
terms are automatically extracted from the
magazines’ articles by applying the grammatical
rules. In the following, these contextual terms
are called attributes of the concept.
• Term context stars are computed for each cell of
the analysis matrix, i.e. the considered magazine
articles are defined by a group of magazines and
a certain period of time.
• In the graphical representation the concept itself
appears in the centre of the term context star.
Attributes of the concept surround the concept
in form of bubbles. The relative size of each
attribute bubble corresponds to the number of
times that attribute appears with the considered
concept.
• The size of term context stars themselves is
relative to the number of articles in the
considered magazines (defined for the
corresponding cell in the analysis matrix) in
which the concept appears.
Looking at the term context stars presented in
Figure 1: Assume that in the considered magazines
the Trend Analyser has analysed the context of the
concepts “blue”, “pink”, “green” , “floor”, “brick”,
“glass”, and “pine” (as given by the user). In the
considered magazines, the concept “blue” frequently
appears in the contexts “pigeon blue”, a bit less
frequent as “baby blue” and “light blue” and still
some times as “Blue One” (a trade name) or “blue
world”. Looking at all concepts, “brick” did occur
most frequently, followed by “floor” and “blue”,
while there are still some occurrences of “pine”,
”green”, “floor “, “glass” and ”pink”.
Given a visualisation of term context stars in the
Trend Analyser, the expert user can click on
concepts or attributes to show all the articles in the
considered magazines that contain the respective
concept and attributes (highlighted in the articles).
The overall result of the analysis is shown in the
analysis matrix. Figure 1 gives an example of a
possible analysis result. It shows, for instance, that
“terracotta bricks” started up in 2003 in the
“Abitare” magazine (which in fact is a product
catalogue), became more and more popular until
2005 – and disappeared the year after.
2.2 Mining Association Rules
The second component, i.e. the association mining
tool of the Trend Analyser, presents the selected
attributes in form of a table similar to tables in
relational data bases. Attributes such as order
number, product category as well as further
properties of a product are presented in rows. The
values of each attribute are listed in the columns.
To derive a set of correlations that may give
answers to questions like: “Which type of customer
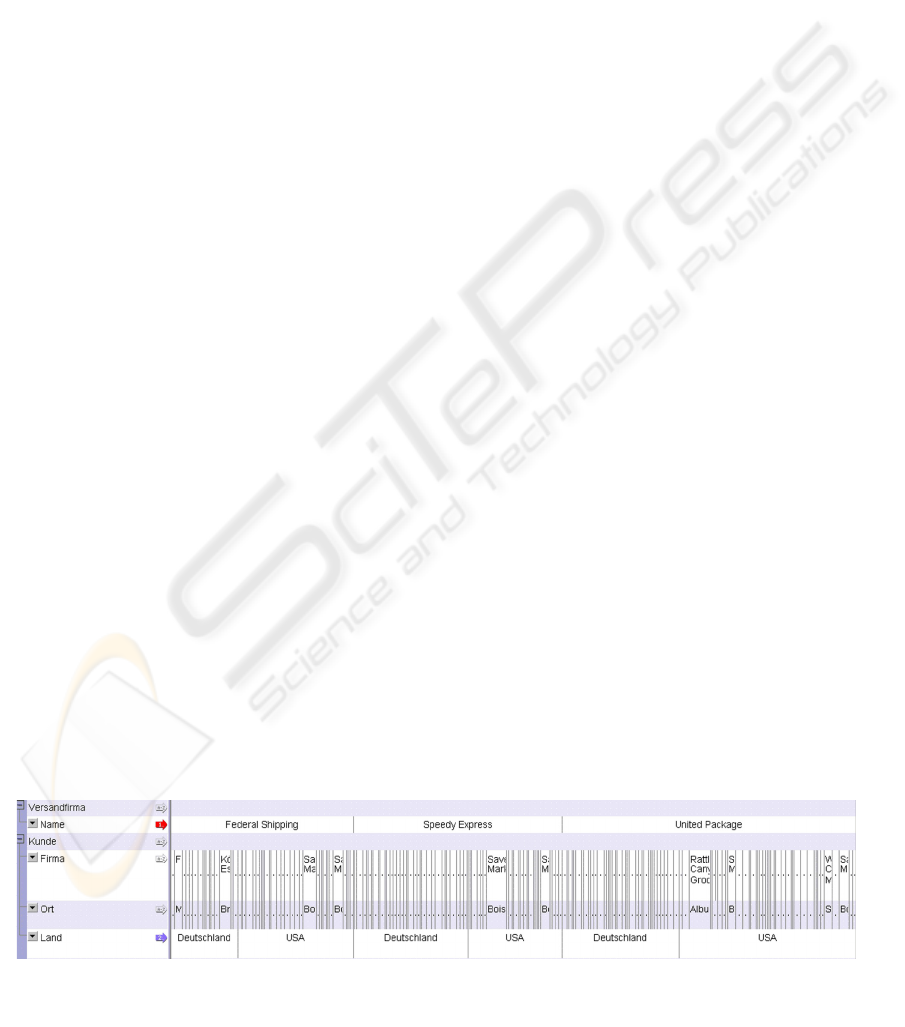
Figure 2: Compressed view on relevant attributes for analysis of sample retail sales ordering data.
TREND ANALYSIS BASED ON EXPLORATIVE DATA AND TEXT MINING - A Decision Support System for the
European Home Textile Industry
255
buys what?”, “What kind of products are bought
together” or “What are customers looking at before
they decide to buy a certain product?” the
association mining tool provides flexible interaction:
• Different visualised views on the data help to
gain an overview and detect dependencies on
the one hand or go into detail and focus on
certain attribute values on the other hand.
• Defining different functions over attributes.
The expert may for example compute the sum
or determine the average of all values of one
specific attribute.
The expert can gain an overview of the attributes
and their value distribution by using the so called
“compressed view” of the tool (cf. Figure 2). This
view causes that adjacent cells with the same value,
namely the attribute values presented in columns,
are combined. The width of each cell indicates the
number of objects with this specific value. Cells
with numeric values, too small to be labelled with
the related value, are represented through a
horizontal line. The level of that line reflects the
height of the value. At a glance one can see that
three shipping companies deliver the products (see
row “shipping company name”). The row “country”
shows that each of these companies deliver to
customers in Germany and USA. In that way the
expert may detect interesting attributes/correlations
which are worth looking at in detail.
In the following we give an example on how to
detect an association such as “Which two product
categories are combined most frequently in one
order?” by performing the two working steps of
defining additional functions and focusing on certain
attribute values.
In the first step the user defines a function to
determine the number of product categories in one
order. Since he is interested in the combination of
two product categories, he then focuses (namely
double clicks on the value) on orders where products
of two categories are combined. In that way all
orders are selected where products from two
different categories are combined. Visually the
selected part grows until this cell fits the width of
the screen. At the same time the value distributions
of the other attributes adapt visually to that selection.
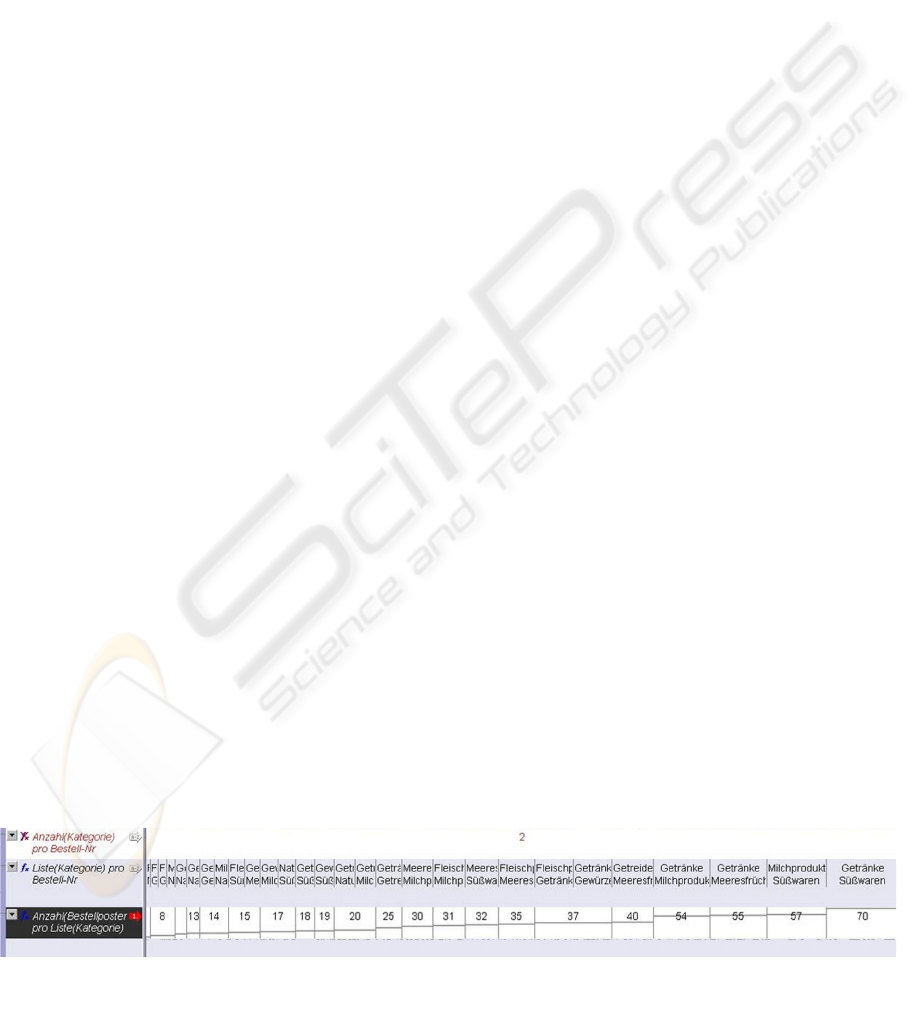
To experience which two product categories are
combined, the expert introduces a new function. The
result is presented, when he finally sorts the values
according to this new function (cf. Figure 3).
After detecting such an association the expert
will still have to verify that this association
represents a meaningful causal relationship, since
associations do not imply causation.
3 METHODS AND TOOLS
In this section we present methods and tools that are
suitable to realise the functionality of the Trend
Analyser as depicted in the solution design (section
2). In order to realise the text analysis features of
the Trend Analyser we have selected and developed
the following set of methods and tools (cf. 3.1).
Section 3.2 concentrates on the appropriate
information visualisation system we selected for
association mining functionality.
3.1 Visual Text Mining
The idea of term context stars (cf. Figure 1)
distinguishes between terms and concepts. Concepts
have a direct connection with AsIsKnown’s domain
ontology which constitutes relatively stable
knowledge of the domain. Terminology trends in
fast moving industries, in contrast, are rather
dynamic, a priori unknown, and evolving from the
active use of these terms, concept combinations and
expressions. From the viewpoint of knowledge
engineering, such concept drifts thus cannot be
modelled in advance. On contrary, it is rather
interesting to detect the terminological development
and to match it with known concept models. Thus,
we have decided to model just the relatively stable
“anchors”, i.e. concepts like basic colours, materials,
or structures. Dynamic, fluctuating terminology is
then rather detected by text mining technology.
To do that, we use methods of shallow natural
Figure 3: Dairy products and beverages are bought most frequently in one order.
ICEIS 2007 - International Conference on Enterprise Information Systems
256

language processing. Magazines are first
linguistically pre-processed: The tokenized texts are
automatically annotated with part-of-speech tags that
indicate the grammatical categories of each word.
Using dictionaries, for each known term a matching
concept from the ontology is attached (word sense
tagging). These linguistic services are realised with
the CLaRK system (Simov, 2004).
Given a list of concepts that shall be examined in
the magazines, target fragments of texts are first
identified with help of the word sense tags, e.g. all
sentences containing the concept “brick”. We then
use partial grammars that describe the possible
positions of interesting terms in the context of a
concept we are interested in, e.g. all adjectives that
are related to the concept. Terms that match these
grammar rules are extracted from the texts.
The final task is to visualise the extraction
results. Modelling and visualising term distributions
and term contexts has attracted interest in research
fields such as information retrieval (Becks, 2001),
linguistics, and web-based communities. Heringer
(1998) has introduced a technique where lexical
fields are automatically computed by a context
analysis of certain keywords. A degree of affinity is
determined by measuring the contextual ‘closeness’
of terms to the keyword. The resulting lexical fields
can be graphically presented as stars where the
context words are circularly arranged around the
concept. The distance of each satellite to the concept
reflects the degree of affinity.
While Heringer’s idea focuses on the notion of
term affinity, another recent approach tackles the
issue of term frequency: In the Web 2.0 community
the concept of tag clouds has become popular. Tag
clouds (also known as word clouds) visualise the
frequency of tags that appear on a website (Hassan-
Montero, 2006). More frequently used tags are
emphasised by larger fonts or other ways of
graphical highlighting.
The notion of term context stars is basically a
mixture of Heringer’s star visualisation idea for
lexical fields and the keyword-scaling of tag clouds.
Its visualisation metaphor helps users to recognise
dominant concepts as well as term attributes in a text
corpus. Moreover, different term context stars of the
same concept can easily be compared regarding
frequencies of concepts and drift of term attributes
(cf. Figure 1). The visualisation functionality can be
implemented using standard graphical programming
libraries. Complex layout algorithms (spring
embedding or other graph drawing techniques) are
not necessary.
3.2 Visual Association Mining
Association Mining is a method to discover which
items co-occur frequently within a data-set. A
typical example is the market basket analysis. In this
process customer buying habits are analysed by
finding associations between different items that
customers place in their “shopping baskets” (Han,
2001).
Association rules are implications of the form X ⇒
Y, i.e. A
1
∧…∧A
m
Æ B
1
∧…∧B
n
where A
i
( i ∈ {1,
…, m}) and B
j
(j ∈ {1, …, m}) are attribute-value
pairs. The rule is interpreted as “database tuples
which satisfy the condition X are also likely to
satisfy the condition Y”.
If a producer, for instance, would like to
determine which products are likely to be purchased
together, the appropriate rule would be like the
following: buys(customer, “sofa”) ⇒
buys(customer, “easy chair”).
Such associations, once found, can help the
producers understand their customers and as a result
help them to develop appropriate marketing
strategies and cross selling methods.
Many data mining tools support the task of
finding association rules within a given data set by
searching for correlations in the data automatically.
They test a lot more combinations of attributes than
the expert user can do manually. However it is
important to explore and understand the data being
analysed since this is the first step before one is able
to ask the right questions and any data mining
method can be applied in an appropriate way. In
particular, it is often necessary to define the right
derived attributes before the data mining method can
be applied in an appropriate way.
The information need from the producers in the
AsIsKnown context is driven by the wish to better
understand their consumer’s behaviour since they
have to be able to react to new trends and plan their
production according to these trends. They cannot
specify precisely where to find the information and
which attributes have to be analysed to lead a search.
Holten (1997), who addresses the question of
adequate system support for unstructured decisions,
states that these kinds of problems require rather
data-driven information analysis processes. Hence
he proposes exploration-oriented interaction
strategies. InfoZoom (Spenke, 2000), the tool we use
(cf. example in section 2.2), is a flexible visual data
mining tool, for individual and ad hoc analysis of
huge data amounts. It combines the required
functionality on the one hand with the flexibility
necessary for the domain experts on the other hand.
TREND ANALYSIS BASED ON EXPLORATIVE DATA AND TEXT MINING - A Decision Support System for the
European Home Textile Industry
257

InfoZoom provides the user with individual
views on the data values and different interaction
possibilities. Depending on the working context and
the arising questions the user can access the relevant
data and perform individual analysis. The user can
look at the whole data at a glance as well as
exploring a specific part of the data in detail.
In this way, the user gets a feeling for the data,
detects interesting knowledge, and gains a deep
understanding of the data set. The user can access
the data in that way and depth as it is necessary and
required for his working context. Animated zoom
into interesting areas of the data table as well as the
possibility to define functions support the user in her
task. For example the user can compute the sum, or
derive attributes such as the maximum or the
average. On that way the user derives new and
important information for further work.
Correlations can be detected by sorting according
to different attributes and by zooming into
interesting areas of the table.
4 CONCLUSION AND OUTLOOK
The development of the Trend Analyser is an
ongoing work in the AsIsKnown project. A mock-up
of the Trend Analyser has already been evaluated in
a concept review workshop with designers, product
managers and marketing staff of a carpeting
producer. We collected informal feedback on the
system design and received assessments on the
expected usefulness of the tool. It turned out that the
explorative approach with a high degree of user
interaction is expected to establish trust in the
mining results and help users to derive ideas of
potential trend lines, taking into account also their
high degree of experience and implicit background
knowledge. A purely automatic computing of
mining results, on the contrary, would not be
accepted by this particular user group which is used
to a rather creative and weakly structured way of
working.
Of course, a more formal evaluation is still
necessary. This will be done based on a first
prototype of the Trend Analyser which is planned to
be used in a field study with a textile producer. We
will use observational methods and structured
interviews to assess the functional design, usability
and impact of the Trend Analyser.
ACKNOWLEDGEMENTS
AslsKnown (http://www.asisknown.org) is funded
within the Information Society Technologies (IST)
Priority of the Sixth Framework Programme (FP6)
of the European Commission.
REFERENCES
Becks, Andreas (2001). Visual knowledge management
with adaptable document maps GMD research series,
no.15
Han, Jiwei. Micheline Kamber (2001). Data mining.
Concepts and techniques, Morgan Kaufmann
Publishers Inc.
Hassan-Montero, Yusef, Victor Herrero-Solana (2006).
Improving Tag-Clouds as Visual Information
Retrieval Interfaces. Int. Conf. on Multidisciplinary
Information Sciences and Technologies, InSciT2006,
Mérida, Spain
Heringer, Hans Jürgen (1998). Das Höchste der Gefühle –
Empirische Studien zur distributiven Semantik. Verlag
Stauffenburg, Tübingen
Holten, R. (1997) Die drei Dimensionen des
Inhaltsaspektes von Führungsinformations-systemen,
Arbeitsberichte d. Inst. für Wirtschaftsinformatik,
Universität Münster, April.
Kontostathis, April, Leon M. Galitsky, William M.
Pottenger, Soma Roy, Daniel J. Phelps (2003) A
survey of Emerging Trend Detection in Textual Data
Mining, Survey of Text Mining, pp.185-224
Kontostathis, April, Lars E. Holzman, William M.
Pottenger (2004) Use of Term Clusters for Emerging
Trend Detection, Preprint
Simov, Kiril, Alexander Simov, Hristo Ganev, Krasimira
Ivanova, Ilko Grigorov (2004). The CLaRK System:
XML-based Corpora Development System for Rapid
Prototyping. In: Proceedings of LREC, Lisbon,
Portugal, pp. 235-238
Spenke, Michael, Christian Beilken (2000). InfoZoom –
Analysing Formula One racing results with an
interactive data mining and visualisation tool. Second
International Conference on Data Mining, 5-7 July,
Cambridge University, United Kingdom
Valtinat, Tobias, Wolfgang Backhaus, Klaus Henning
(2006). Non Invasive, Cross-Sector Development and
Management of Trends. Leading the Web in
Concurrent Engineering, P. Ghodous et al. (Eds.), IOS
Press
ICEIS 2007 - International Conference on Enterprise Information Systems
258
