OOPUS-DESIGNER
User-friendly Master Data Maintenance through Intuitive and Interactive
Visualization
Wilhelm Dangelmaier, Benjamin Klöpper, Björn Kruse, Daniel Brüggemann and Tobias Rust
Heinz Nixdorf Institute, University of Paderborn, Fürstenallee 11 Paderborn, Germany
Keywords: ERP, PPC, visualization, human computer interaction, master data.
Abstract: Valid and consistent master data are pre-requisite for efficient working Enterprise Resource Planning (ERP)
and Production Planning and Control (PPC) systems. Unfortunately users are often confused by a large
number of forms or transactions in these systems. Confusing interfaces lead to faulty master data. In this
paper we introduce a tool that provides intuitive and interactive visualization for the master data
administration of a PPC system.
1 INTRODUCTION
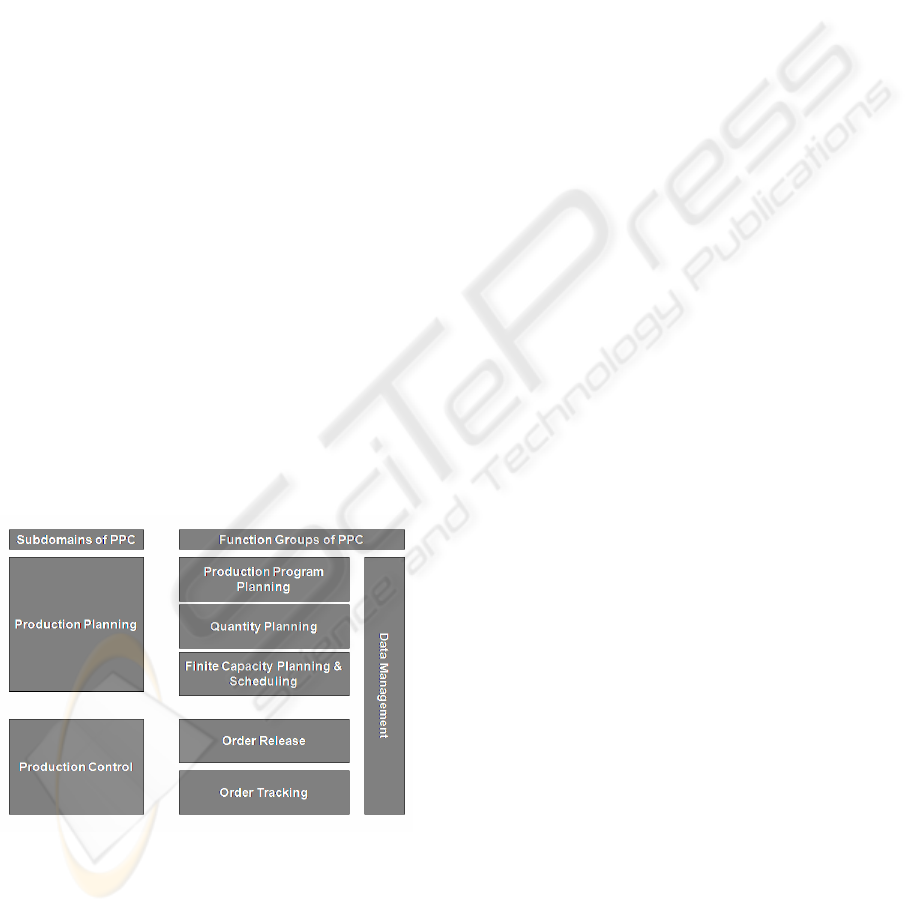
Production Planning and Control is a complex task
encompassing several function groups (Higgens et
al., 1996) as shown in Figure 1. Data Management is
a function group that is orthogonal to all other
function groups of PPC. Accuracy and efficiency of
the functions fulfillment depends directly on the
quality of data provided by the data management.
Figure 1: Production Planning and Control Tasks.
The problem of consistency management for mass
data is considered to be solved. Standard PPC and
ERP System (e.g. SAP ECC 5.0 and SAP APO
(Ball, 2006), SAGE (Wallace and Kremzar, 2001) or
Navision (Diffender and El-Assai, 2005)) solved this
problem and for individual implementations the
design techniques for databases offer precise
instructions for implementing redundancy free
databases (Connolly and Begg, 2001).
A problem that is rarely considered in the context of
PPC and ERP system is the question, how to support
the process of modelling a production system. In
(Dangelmaier et al., 2007) we introduced a
developed process for individualized PPC-Tools.
The development process is characterized by the
following steps:
1. Identify the dispatchers’ actual
requirements
2. Find the most suitable problem definitions
3. Define a flexible formal model
4. Transfer the model into a database scheme
5. Provide easy access to the database
We introduced a flexible formal model that
constitutes a connection between the requirements of
the dispatchers and formal problem definitions. The
model is called “Model for Serial Manufacturing”.
This paper introduces a tool that provides easy
access to the database of a PPC system called
OOPUS-WEB. The tool, named OOPUS-
DESIGNER adds contextual information through an
interactive visualization and is capable of modifying
the underlying data directly. OOPUS-DESIGNER
avoids the shortcomings of data administration in
form or transaction driven ERP or PPC systems.
Facing several forms or transactions, the user lacks
insight of the data he is currently entering.
294
Dangelmaier W., Klöpper B., Kruse B., Brüggemann D. and Rust T. (2007).
OOPUS-DESIGNER - User-friendly Master Data Maintenance through Intuitive and Interactive Visualization.
In Proceedings of the Ninth International Conference on Enterprise Information Systems - HCI, pages 294-297
DOI: 10.5220/0002380102940297
Copyright
c
SciTePress
2 THE OOPUS-WEB SYSTEM
OOPUS-WEB is built in pure Java to achieve a great
flexibility. The architecture of OOPUS-WEB is
illustrated in figure 2. The architecture is designed
to provide hosting services for small companies,
which cannot effort expensive IT-systems and
maintenance.
Browser
Java Application Server
Server Client
Applets
Tapestry
database
Gantt
Hibernate
Servlet
Designer
database
ext. Server
ext. Server
database
Figure 2: Architecture of the OOPUS-WEB system.
Hibernate is an object/relational mapping tool for
Java environments. Object/relational mapping refers
to the automated persistence management of objects
in interaction with a relational database. Meta data,
describing a mapping between objects and database
tables, is used for the persistence management
(Bauer and King, 2005). Hibernate provides a great
flexibility to OOPUS-WEB. Due to the mapping
data, the same object oriented representation can be
used in combination with different database
definitions. Thus it becomes possible to integrate the
databases of companies – where available – easily
into OOPUS-WEB. For small companies with no
information systems at all, the standard
configuration provides a database on the web server.
OOPUS-DESIGNER is dedicated to this
configuration.
Tapestry was used to implement the user
interface. Tapestry is a component oriented
framework for creating dynamic, robust, highly
scalable web applications in Java. It is an extension
to servlet containers (such as Tomcat) or application
servers (like JBoss, WebSphere, or WebLogic)
(Ship, 2004). Tapestry provides a well structured
implementation of the established Model-View-
Controller (MVC) (Krasner and Pope, 1988)
paradigm for user interface, which makes the user
interface of OOPUS-WEB flexible and configurable.
There are additional software components, which
enhance the websites interactivity. For example a
Gantt chart component is used to visualize and
maintain the current planning status.
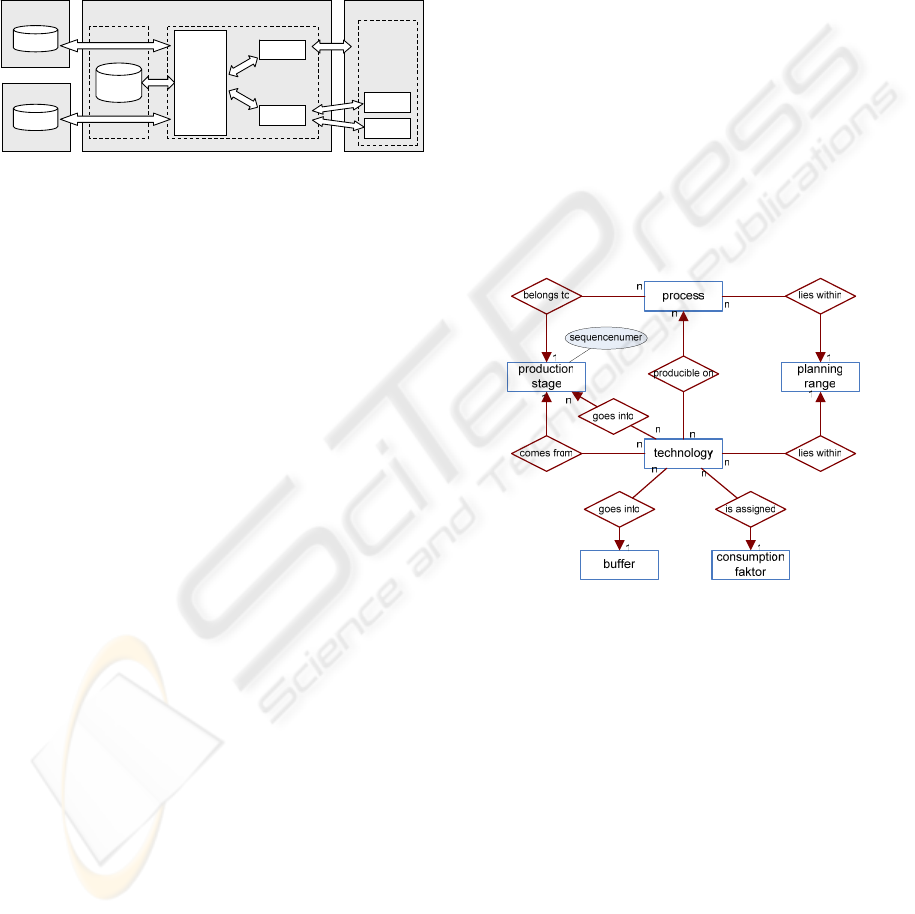
Figure 3 gives a snapshot of the entity
relationship diagram of the OOPUS-WEB data
model. Entities are shown as rectangles and
relationships between them as rhombi. The model
contains the following entities:
Production stages (PS) divide the real production
into separate steps. They have an attribute called
sequence number, which ensures the order of the
production stage
Processes (P) are the equivalent of real production
lines. A production stage must contain at least one
process
Planning ranges (PR) represent the grouping of
multiple processes, arranging them into logical
segments. Every process has to be assigned to
exactly one planning range
Consumption factors (CF) represent products and
intermediate products
Buffers (B) are representations of any object that
has buffering capabilities. They can temporarily
hold any consumption factor between two
production stages
Technologies (T) model the flow of material in
the production system
Figure 3: ERM showing the master data of OOPUS-WEB.
The central entity of this example is the technology
(T). Although the diagram shows technology as an
entity, technologies are no physical objects – they
are abstract representations of the materials’ (the
consumption factors) flow through the system.
Considering one technology t, there is exactly one
consumption factor cf assigned to it, as well as
exactly one buffer b, one planning range pr, one
production stage ps and at least one process p. Each
process p must be assigned to planning range pr and
production stage ps. Production stage ps is the
producing production stage of technology t (more
correct, producing consumption factor cf, since
technology is no physical entity). Finally, there is
any number of consuming production stages
OOPUS-DESIGNER - User-friendly Master Data Maintenance through Intuitive and Interactive Visualization
295
assigned to technology t. As the name suggest, they
consume the consumption factor.
3 PROBLEM STATEMENT
Data administration in OOPUS-WEB encompasses
two main tasks:
1. Modelling the structure of production systems
2. Enter and update material and material work
plans (represented by technologies)
The first task is performed infrequently. After the
initial modelling of the production system, there
may be changes in the production system (e.g. new
machines), which cause changes in the model of the
production system. There are a large number of
constraints, which have to be considered to create a
sound model of the production system. All
functionalities of OOPUS-WEB depend on a sound
model of the system, thus a flawless modelling is
important and should be supported by the system. To
provide up-to-date information to the planning
modules, the second task is performed frequently.
Both tasks – modelling the structure of production
systems and work plans as well as the flow of
material through a production system – have an
intuitive graphical representation. Graphical editors
are already successfully applied to the modelling of
workflows in ERP systems (Ryckayzen et al., 2002).
Nevertheless, most ERP and PPC systems do not
offer a proper interface for an intuitive fulfilment of
the tasks stressed in this section.
Every ERP/PPC system hast to meet a challenge:
clearly present vast data and maintain the data
consistency. Often it is not possible to present all
required information at once. This issue is usually
solved by splitting the interface over several forms
or transactions.
In general, users working with a system for a
long time know the meaning of each input field and
the restrictions for the input values. They use the
data intuitively and efficiently. But it took them a
specific time to get to this point – through learning
and gaining experience. New users do not have this
experience and need time and training to be able to
work with the system. They need even more time
and experience to use the system efficiently.
The context of entered data is easily lost, when
the inexperienced users have to switch frequently
between different forms or transactions. The missing
context leads to faulty entries and thus to an
inaccurate modelling of the production systems. This
problem becomes even more severe when large
amount of new data has to be entered.
4 THE VISUAL APPLICATION
This chapter describes OOPUS-DESIGNER. It
provides an intuitive representation for production
systems and material flows. The workflow of
modelling is no longer artificially split into parts.
Prefuse (Heer, 2004), a Java-based toolkit for
building interactive information visualization
applications, was used to implement the OOPUS-
DESIGNER. It is based on the information
visualization reference model, which has given proof
of its abilities in other graphical frameworks (Card
et al, 1999). Furthermore, prefuse support the
development of Java applets that can easily be
transferred and run on client computer browsers
(Heer et al, 2005).
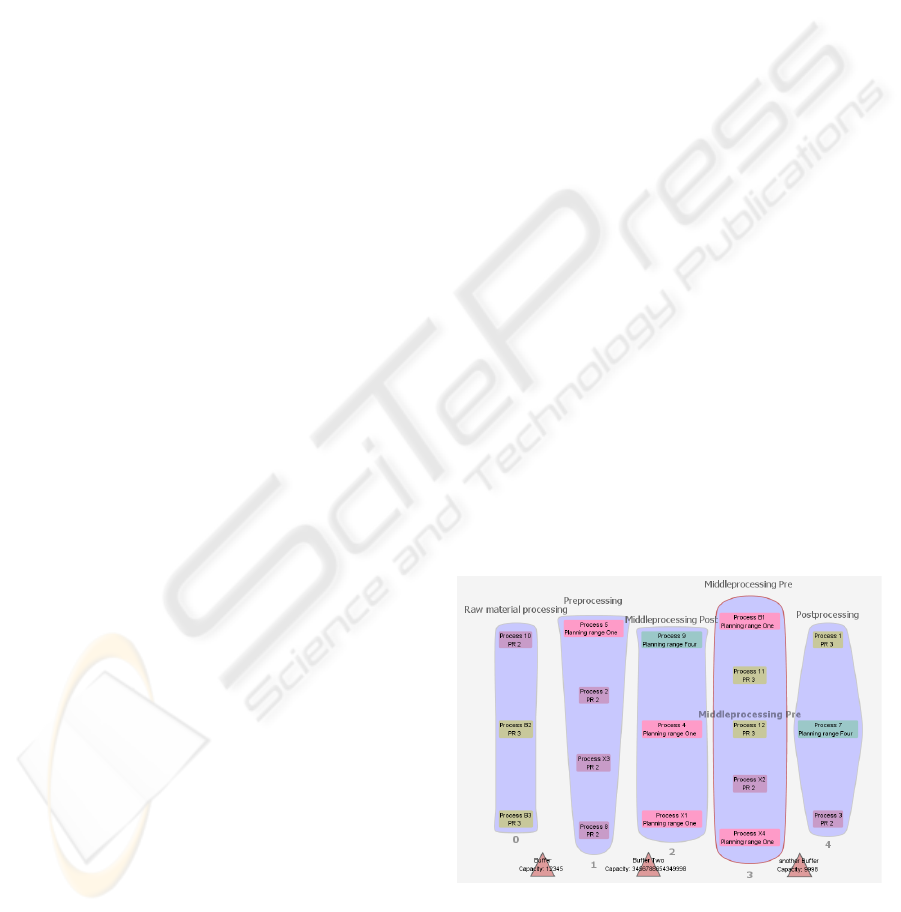
The visual elements are arranged as follows:
production stages are arranged horizontally,
according to their sequence number value. The
processes are aligned vertically within each
production stage and are shown as small rounded
rectangles. To visualize the planning ranges, each
process is coloured. Each colour represents a
planning range. The buffers are represented through
triangles. Figure 4 shows a screenshot.
The user can easily depict to which production
stage a process belongs and which processes belong
to the same planning range. The production stage
with sequence number 3 is currently under the
mouse pointer and thus highlighted. The displays is
freely zoomable and panable and the items provide
different kinds of interactivity, such as context
menus, mouse over effects or high-lighting
depending on the current state or selection.
Figure 4: Visualization of a production system by
OOPUS-DESIGNER.
The usability of OOPUS-DESIGNER is
demonstrated on the example of entering a
ICEIS 2007 - International Conference on Enterprise Information Systems
296
technology: The process of creating a technology is
tedious, because the user has to enter vast data
considering dependency to existing data. In form or
transaction driven systems, the user picks an entity
from large data sets with hundreds of entries. The
user is responsible to define reasonable filter criteria
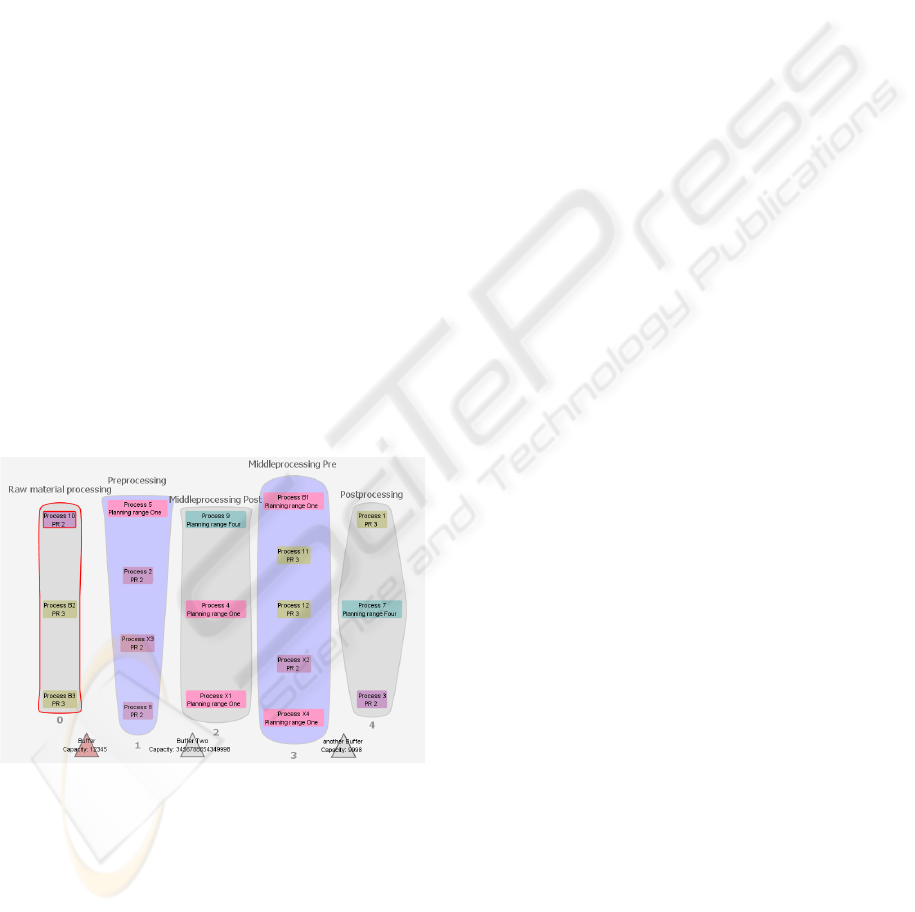
for the data sets. In OOPUS-DESIGNER, the user
can simply click on the desired objects to create the
relationship. Figure 5 shows the display while a user
is assigning objects to a technology. The non-
applicable objects are greyed out, as this is a
common way to show that they’re currently not
interactive or selectable. The objects surrounded by
a red line have already been selected.
Attributes of relationships or corresponding
objects can be entered in a properties panel which is
placed besides the display. Furthermore, the
interface supports use of a text editor to facilitate
direct editing of text. Hence the user is able to
modify any item attributes directly, without the need
to move his attention away from the object. In the
OOPUS-DESIGNER this feature is used to edit the
most common attributes for an item. This approach
ensures that the context is preserved, regardless of
the actual working progress of the user. In fact,
additional information or tasks can be arranged
around the main display. Thus, the user can
individually arrange the interface in such a way, that
all required information are avaible at one glance.
Figure 5: OOPUS-DESIGNER greys out non-applicable
items.
5 CONCLUSION
In this paper OOPUS-DESIGNER was introduced.
This application introduces a new user friendly
method of master data management to ERP and
PPC-Systems. Since the functionality of these
systems relies on valid master data, the avoidance of
faulty entries is an important task. OOPUS-
DESIGNER answers these challenges with an
intuitive representation of the master data and
relations between data sets. Since the process of
modelling and data input is not split into parts, an
extensive data validation becomes possible.
Therefore the concept behind OOPUS-DESIGNER
can help improve the utility of ERP and PPC
systems and shorten periods of vocational
adjustment for new users.
REFERENCES
Higgins, P., Le Roy, P., TIerney, L; 1996; Manufacturing
Planning and Control: Beyond MRP II. Springer
Verlag, Berlin, Heidelberg, New York
Balla, J.;2006; Production Planning with SAP APO-
PP/DS, SAP PRESS
Wallace, T.F., Kremzar, M.H.;2001; ERP:Making It
Happen: The Implementers’ Guide to to Success with
Enterprise Resource Planning, Wiley & Son,
Chichester
Diffenderfer, P.M., El-Assai, S.; 2005; Microsoft Navision
4.0: Jump Start to Optimisation, GWV-Vieweg,
Wiesbaden
Connolly, T.M. C. Begg, C.; 2001; Database Systems: A
Practical Approach to Design, Implementation, and
Management, Addison-Wesley, Boston
Dangelmaier, W., Klöpper, B., Timm, T. Brüggemann, D.;
A Modelling Approach for Dynamic and Complex
Capacities in Production Control Systems, BIS 2007,
Lecture Notes of Computer Science 4439, pp. 626-
637, Springer Verlag, Berlin, Heidelberg
Bauer, Christian; King, Gavin; 2005; Hibernate in Action
– A guide to concepts and practice of object/relational
mapping; Manning; Greenwich
Ship, Howard M. Lewis; 2004; Tapestry in Action – The
definitive guide to web application development with
Tapestry; Manning; Greenwich
Krasner, Glenn E.; Pope, Stephen T.; 1988; A cookbook
for using the model-vew controller interface paradigm
in Smalltalk-80; In: Journal of Object-Oriented
Programming, Volume 1 (3)
Heer, Jeffrey; 2004; prefuse: a software framework for
interactive information visualization; University of
California, Berkeley; 2004
Rickayzen, Allen; Dart; Jocelyn, Brennecke, Carsten;
Schneider, Markus ; 2002; Practical Workflow for
SAP - Effective Business Processes using SAP's
WebFlow Engine; Galileo Press; Bonn
Card, Stuart K.; Mackinlay, Jock D.; Shneiderman, Ben;
1999; Readings in Information Visualization: Using
Vision to Think; Morgan Kaufmann ; San Francisco
Heer, Jeffrey; Card, Stuart K.; Landay, James A.; 2005;
prefuse: toolkit for interactive information
visualization; CHI 2005
OOPUS-DESIGNER - User-friendly Master Data Maintenance through Intuitive and Interactive Visualization
297
