
OOPUS
A Production Planning Information System to Assure High Delivery Reliability
Under Short-term Demand Changes and Production Disturbances
Wilhelm Dangelmaier, Tobias Rust, Thomas Hermanowski
Heinz Nixdorf Institut, Universität Paderborn, 33102 Fürstenallee 11, Paderborn, Germany
Daniel Brüggemann, Daniel Kaschula, Andre Döring, Thorsten Timm
Fraunhofer-ALB, Fürstenallee 11, 33102 Paderborn, Germany
Keywords: Production planning, production control, ERP, GUI, MLCLSP, Gantt chart, cumulative quantity table,
usability.
Abstract: Batch-sizing and scheduling is the central decision problem in the area of production planning. A special
challenge in this context is to handle the big amount of data in an adequate time interval. To aggregate and
to illustrate this data clearly, appropriate techniques are required. This paper presents a new approach to
integrate a Production Planning Table visualized by a Gantt chart and a cumulative quantity table for
maximum information transparency in production planning. The discussed solution is realized in OOPUS,
an object-oriented tool for planning and control, which became the leading production planning system in
two motor assembly plants of an international automobile manufacturer.
1 INTRODUCTION
The last years in the automotive industry were
affected by a strong trend towards decreasing life
cycles of products and at the same time increasing
time of innovation ongoing with a continuous
diversification of the product range. Furthermore the
pressure of competition increased dramatically due
to weakened purchasing power of customers, a
decreasing customer-specific brand affinity and
permanent changes of the market and customer
requirements (Harjes et al., 2004). In order to stay
competitive, automobile manufacturers have to
produce their products in high quality and at low
costs in even shorter time. A crucial meaning to
withstand these challenges belongs to ERP systems,
which control, standardize and optimize the business
processes along the whole value chain (Holland and
Light, 1999). An essential factor to achieve this goal
is the batch-sizing and scheduling. To satisfy the
changing demands the existing schedule has to be
adapted regularly. Under the objective of
minimizing the production costs and stocks, batch-
sizing and scheduling is a complex problem.
Depending on the type of production there are
many factors to be considered. These could be time-
dependent demands, capacities of production lines,
stocks, buffers, qualifications of workers, set-up-
and lead-times, stockouts, backlocks, alternative or
parallel identical machines, batch size and transport
restrictions as well as different shift calendars
(Tempelmeier, 2006; Stammen-Hegener, 2002).
Based on the resulting production plan, demands of
secondary and tertiary parts can be derived and the
capacity utilization analysed. If necessary, it should
be possible to adjust capacities within a short time.
In order to cope with this challenge, data from
several sources has to be related to each other and to
be presented to the user of an ERP system.
In the following a holistic solution for this
problem, called OOPUS (germ. Objektorientierte
Planung und Steuerung - object-oriented planning
and control), will be described in detail. This
information system was developed to meet the
specific requirements of an international automobile
manufacturer. Nowadays OOPUS is the leading
production system within two plants.
423
Dangelmaier W., Rust T., Hermanowski T., Brüggemann D., Kaschula D., Döring A. and Timm T. (2007).
OOPUS - A Production Planning Information System to Assure High Delivery Reliability Under Short-term Demand Changes and Production
Disturbances.
In Proceedings of the Ninth International Conference on Enterprise Information Systems - DISI, pages 423-430
DOI: 10.5220/0002384504230430
Copyright
c
SciTePress
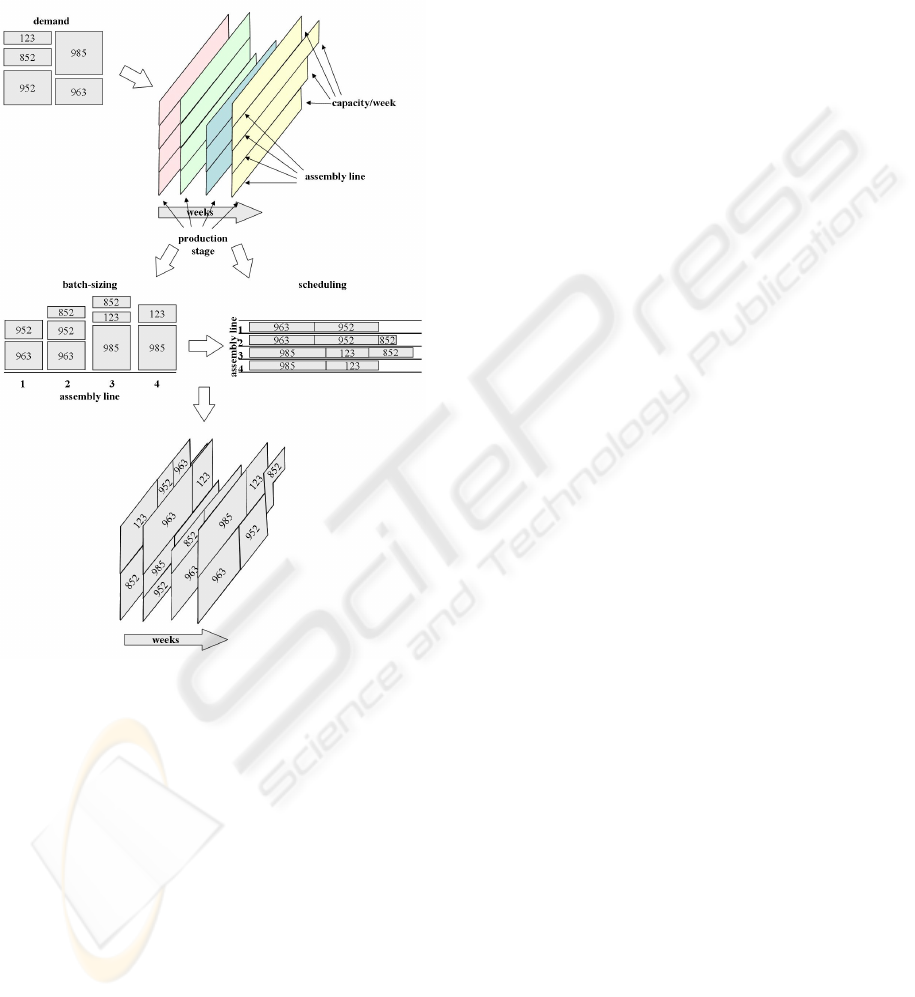
2 PROBLEM DEFINITION
Production planning is a two-step process (see
Figure 1). First, suitable batch-sizes have to be
determined based on time-dependent demands. Then
an optimal schedule has to be generated.
To determine appropriate batch-sizes in OOPUS,
the Multi-Level-Capacitated Lot-Sizing Problem
(MLCLSP) (Katok et al., 1998; Tempelmeier, 2003)
has to be modified. On the basis of a standard-
MLCLSP, extensions like parallel identical
machines and the initial and final inventory are
required.
The MLCLSP is an np-complete problem and
can therefore not be solved with an optimizer in
appropriate time (Maes et al., 1991). Hence, a
suitable heuristic has to be designed.
Due to the changing capacities of machines
scheduling is also a very complex problem. Each
shift of a batch requires a recalculation of the batch
length and the completion date. Under the
requirement of optimal scheduling subject to set-up
times and stocks, this problem can not be solved
with an optimizing algorithm. For this reason, an
appropriate heuristic (like a priority rule procedure)
is required.
Due to these heuristics and the multiplicity of
not forecasted influences (e.g. urgent orders or
changes of demand quantities) this information has
to be represented transparently. This enables the
responsible planner to reconstruct and manually
reschedule the production plan in an adequate way.
Production planning systems are characterized
by an enormous complexity of information which is
often distributed in different isolated software
solutions. But this complexity not only arises
because of the quantity of all relevant elements, but
in particular also from their mutual cross-linking.
Without an adequate information system, this
complexity implicates high requirements of the users
ability to collect and integrate information and to
evaluate and plan actions. Hence it is decisive for an
easy handling of this complex data that it is
presented in an aggregated and clearly arranged (i.e.
user-friendly) form. Beside the aggregation and
visualization of this data, the timeliness of the data is
also critical. For this reason the data have to be
synchronized in real time with the different sources.
This ensures a reliable planning and an adequate
change management.
3 STATE OF THE ART
3.1 Getting an adequate ERP System
The market consists of a multiplicity of standardized
ERP systems, which offer solutions for a large part
of production planning and control tasks, such as
requirement planning, batch-sizing and scheduling
and stock-keeping. However, analyses of these ERP
systems in detail shows some disadvantages. The
standardization of the planning procedures of a
production system often does not correspond exactly
with the functionality required by the customer.
Adjustments of these procedures are often not
possible or very expensive and time-consuming.
Apart from costs based on consulting and
implementation activities, further costs of worker
qualifying measures evolves. Additionally, the
standardization of software often implicates a bad
usability concerning special requirements, which can
affect the acceptance of the system and increases the
qualification time, especially of inexperienced users.
Another problem is the integration of a
standardized system into an existing IT-landscape.
Especially in big enterprises the IT-landscape often
Figure 1: Process of
b
atch-sizing and scheduling.
ICEIS 2007 - International Conference on Enterprise Information Systems
424
consists of a large number of different isolated
software solutions, which mostly cannot be changed
completely due to the current economic situation.
3.2 Representation of Planning Data
There exist different concepts for appropriate
representation of planning data in ERP systems.
Most providers of ERP systems use Gantt charts
for displaying a schedule graphically (Wilson,
2003). A Gantt chart consists of a horizontal bar
chart with time intervals and either resources,
operations or orders as the vertical axis. Individual
operations (e.g. batches) are displayed as horizontal
bars in the chart, indicating the time at which the
operation begins and ends. The disadvantage of a
Gantt chart is that at a large number of batches the
representation is not clear and it is very difficult to
get information about the entire processing status.
The cumulative quantity concept (Schönsleben,
2004) is a representation used in serial production to
show changes of dates and quantities clearly. The
concept is based on cumulated parts, related to a
certain time (e.g. an inventory deadline). By these
cumulative quantities, planned and actually realized
quantities of parts can be compared. The difference
of the target cumulative quantity (TCQ) and the
actual cumulative quantity (ACQ) points a
quantitative advance (TCQ < ACQ) or a quantitative
deficit (TCQ > ACQ) in relation to the given
demands. Particularly in the case of planning and
controlling large quantities of parts, the use of
cumulative quantities is a suitable concept (Kurbel,
2005).
4 OOPUS
Based on the requirements defined in chapter 2 the
software OOPUS has been developed. Thereby
experiences from an earlier project called OOPUS-
DPS (Dangelmaier et al., 1997/99), which operates
successfully at a big automotive supplier since a few
years, were used. A detailed description of the
underlying model that fits all specific requirements
would exceed the scope of this paper, but can be
found in (Dangelmaier et al, 2007). As a main focus,
a user friendly graphical user interface consisting of
a planning table and a cumulative quantity table was
designed to support the planer in all areas of his
work.
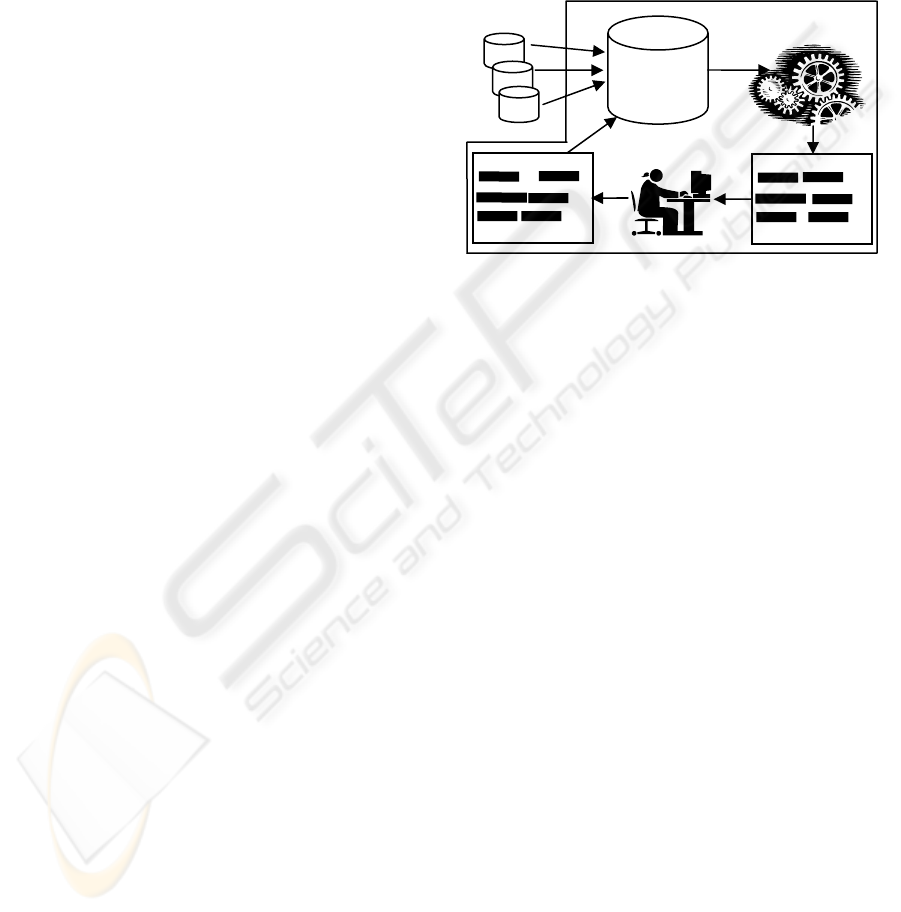
OOPUS is realised as a holistic concept. First,
data (e.g. customer orders, capacities of machines,
etc.) from different systems have to be imported. On
basis of these data the automatic production
mechanism generates a valid and loading optimal
production plan, which regards every organisational
frame condition like different planning areas or
linked assembly lines (AL). In order to consider
short term changes or special experiences of the
planner, the responsible planner can adapt the
automatically generated plan. This holistic concept
is illustrated in Figure 2.
Figure 2: Holistic concept of OOPUS.
5 GUARANTY OPTIMAL
INFORMATION
TRANSPARANCY
One main issue of the software OOPUS was to
present the large number of relevant data in a highly
ergonomic way. The main approach to realize this
was the idea of two functional split but data coupled
graphical user interfaces.
The planning table displays the batches on their
assembly lines over time in form of a Gantt chart in
a concise way. The planner can directly change the
plan by different batch actions like moving or
changing the batch size.
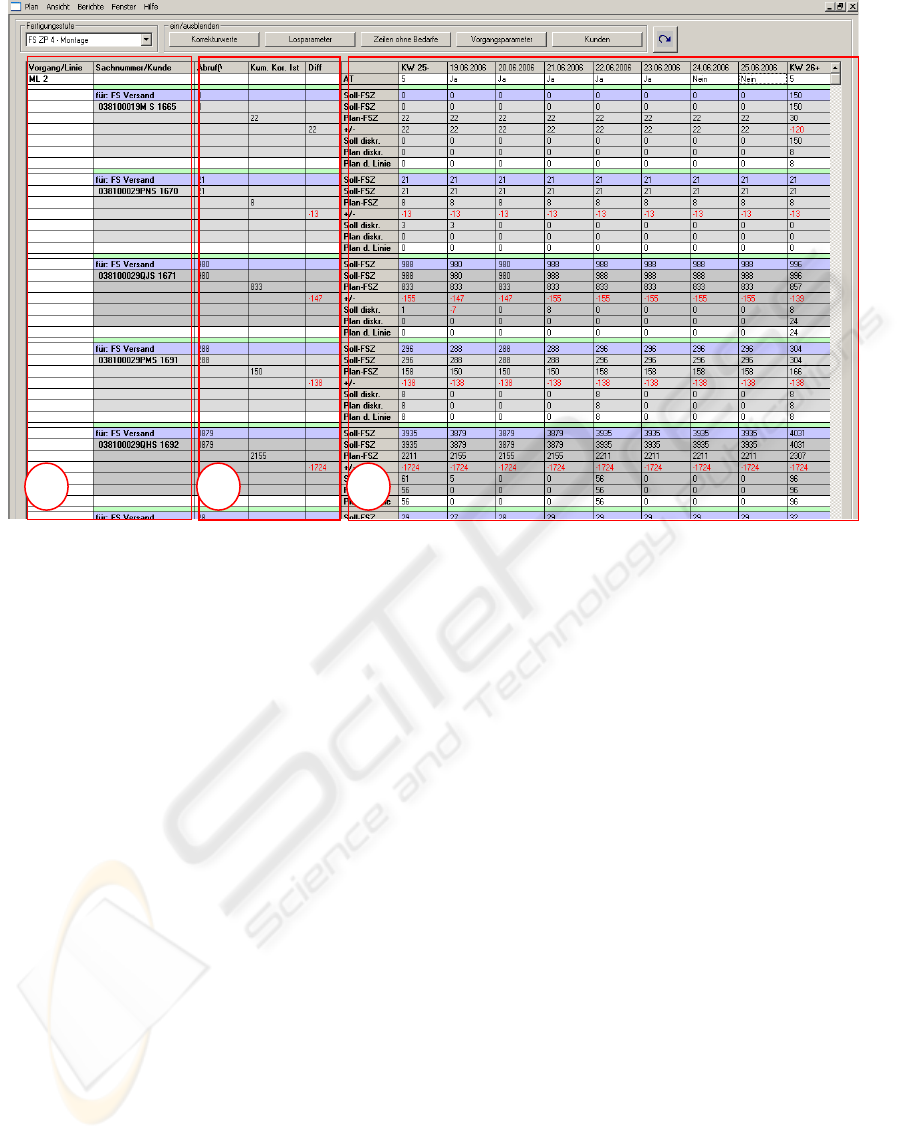
The plan visualized in the planning table is
shown in the cumulative quantity table (Figure 3) by
its forecasted cumulative quantities where it can be
compared with the demands.
5.1 Cumulative Quantity Table
The cumulative quantity table (CQT) gives an
overview of the manufacturing program which has
to be realized and of the manufacturing program
which would be realized by exact adherence of the
actual viewed plan. Thereby the planner is able to
detect mismatches of planned and required product
quantities easily. Exactly these mismatches have to
OOPUS
Plannin
g
OOPUS
ERP-Systems
OOPUS - A Production Planning Information System to Assure High Delivery Reliability under Short-term Demand
Changes and Production Disturbances
425
be avoided, because they can lead to high costs. In
addition to this information, several other parameters
like free capacities of assembly lines or batch
parameters are shown to support the planner in
creating a plan which can hold the fixed dates for all
orders.
Two different cumulative quantities are shown
for each part number the planner is responsible for.
On the one hand the target cumulative quantities and
on the other hand the actual cumulative quantities
(see Section 3).
The CQT is logically divided into three parts
from left to right:
1) The left part structures the CQT line-by-
line in assembly lines and part numbers
2) The middle part contains general and up to
date information of the part numbers
3) The right part shows the development of
the cumulative ACQ’s and TCQ’s weekly
and (additionally) daily
To create a high ease of use that supports the
planner in a maximum way, the following functions
were implemented:
o Coloured visualisation to highlight
significant data :
- Negative differences are red numbers to
signal demand deficit
- Editable fields are blue in the background
o Hiding of rows and blocks which are not
necessary for the planning task
o Weekly and daily quantities available
5.2 Planning Table
After a description of the planning table user
interface the process of plan adaptation will be
presented in detail.
5.2.1 Plan Visualization
The planning table visualizes the batches of the
users associated assembly lines (AL) in form of a
Gantt chart. Batches can be manipulated by different
actions to adapt the plan.
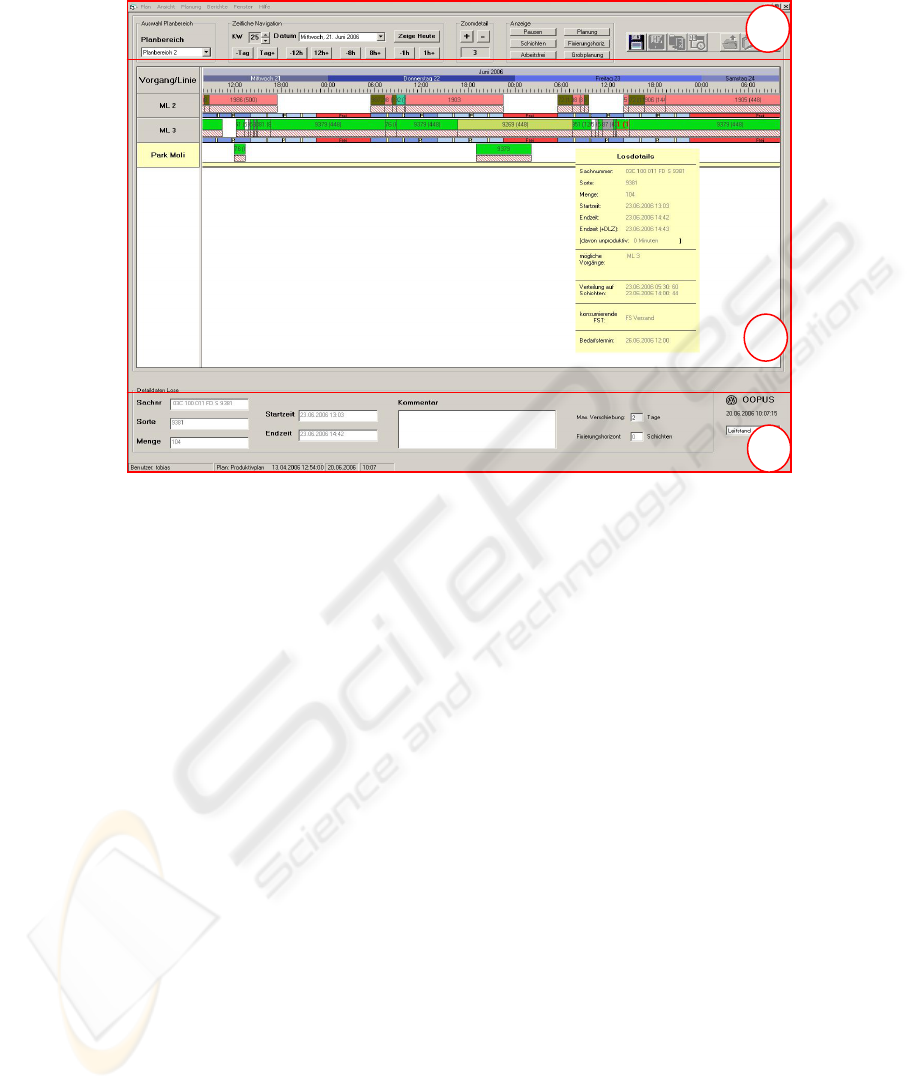
Figure 4 shows the planning table. The graphical
user interface can be divided into three parts top
down.
1) Navigation and action area
1 2 3
Figure 3: The cumulative quantity table.
ICEIS 2007 - International Conference on Enterprise Information Systems
426
Below the menu bar at the very top is the action and
navigation area where the user can navigate in time,
change the appearance of the planning table and
execute fundamental planning actions.
There are several possibilities to navigate in time
and to view the plan in different zoom levels, so the
user can adapt the view to his needs. The level of
detail can be changed in 10 different levels, from a
period of 20 minutes up to a period of 20 days. This
gives the user the possibility to look at the plan very
closely as well as to get a good overview of the
capacity utilization in a bigger time period. To
navigate in time the user can scroll the time line in
the Gantt chart by drag & drop or by pushing
buttons in the navigation and action area. It can
directly be moved to a week and a day in this week
and at the present point in time. To correspond to the
different zoom levels there are different steps to
move forwards or backwards in time.
On the right side of this area is a toolbar that
includes fundamental planning functions like
starting the planning algorithm or saving the current
plan.
2) Gantt chart
This is the main area of the planning table where all
batches are visualised on the assembly lines and
where the plan can directly be changed by different
actions on the batches.
Below each assembly line (e.g. ML 2) there are
different visualization elements that provide the
planner with information about the shifts that are
planned at each time. Blue bars represent productive
time intervals, yellow bars break times and red bars
signalize that the shift is not productive. Grey bars
indicate areas that can not be manipulated by the
user (e.g. past the production horizon).
The big bars over the shifts represent batches
that are planned to be produced at this time on this
assembly line. The batches are divided into two
parts. The upper part visualizes the batch itself; the
lower part gives information about the batch status
and the production progress of this batch. The
numbers on the batches indicate their part number
and their planned quantities. The colour of the status
bar signalizes the status of the batch according to the
availability of needed materials. Like a traffic light
the colours change from red to yellow and then to
green the closer the batch gets to its production start.
If the first part of the batch is produced, the status
bar gets green and its length decreases to show its
progress.
Tooltips are accessible for every visualization
element (
Figure 4 shows a tooltip for a batch).
1
2
3
Figure 4: The planning table.
OOPUS - A Production Planning Information System to Assure High Delivery Reliability under Short-term Demand
Changes and Production Disturbances
427
3) Information area
At the bottom of the planning table is the
information area, where details of the selected batch
and the current plan are shown.
In this area important information (e.g. plan has
been saved) are shown and feedback to actions (e.g.
batch could not be moved to this assembly line) is
given.
5.2.2 Plan adaptation
The user can manipulate the plan in three different
ways:
1) automatic planning
2) semi-automatic planning
3) manual planning
1) Automatic planning
To create a completely new plan, based on the
customer requests and the planned capacities, the
user can start the automatic planning algorithm. The
result of the algorithm replaces the current
productive plan for the current planning area.
2) Semi-automatic planning
OOPUS offers semi-automatic functions to change
the current plan. Some of these are:
o Fix the batches that should persist and plan
the rest automatically
o Create a batch based on an open demand
o Move a batch to an open demand
o Change the batch size based on an open
demand
3) Manual planning
OOPUS offers a very easy and intuitive moving of
batches via drag & drop. After a move the batch size
is recalculated dynamically by taking both capacities
of shifts and included breaks into account. This may
lead to a resizing of the batch after a moving action.
OOPUS ensures that batches can only be moved to
assembly lines where they are allowed to produce
and that they do not start or end in areas which are
not productive like breaks or weekends.
OOPUS guarantees that there is no overlaying of
two batches. If a user moves a batch over an existing
batch the two batches are planned in a row without a
gap between them. Depending on where the batch
was released the batch is planned before or after the
one it was released over.
If conflicts occur, for example because the gap is
too small or the capacity of the new shift is lower
then the one the batch was planned before, gaps with
sufficient capacities are automatically searched and
a dialog appears which offers the user to move the
batch to the next adequate gap.
The different actions the user can perform to
change the plan are:
o Move a batch manually
o Create a new batch
- based on a chosen start time
- based on a chosen end time
o Delete one ore more batches
o Fix one or more batches
o Move a batch based on open demands
o Change batch size
o Set one or more batches to the status “free
for production”
o Set one or more batches to the status
“produced”
Because not all of the possible actions can be
explained in this text, the planning of a new batch
should exemplify the work with OOPUS.
To create a new batch the user has to know the
time and the AL where he wants to generate the new
batch. After right-clicking at the background at the
intended time and AL an menu appears where the
user can decide whether he wants to create the new
batch with the chosen time as start or as end date.
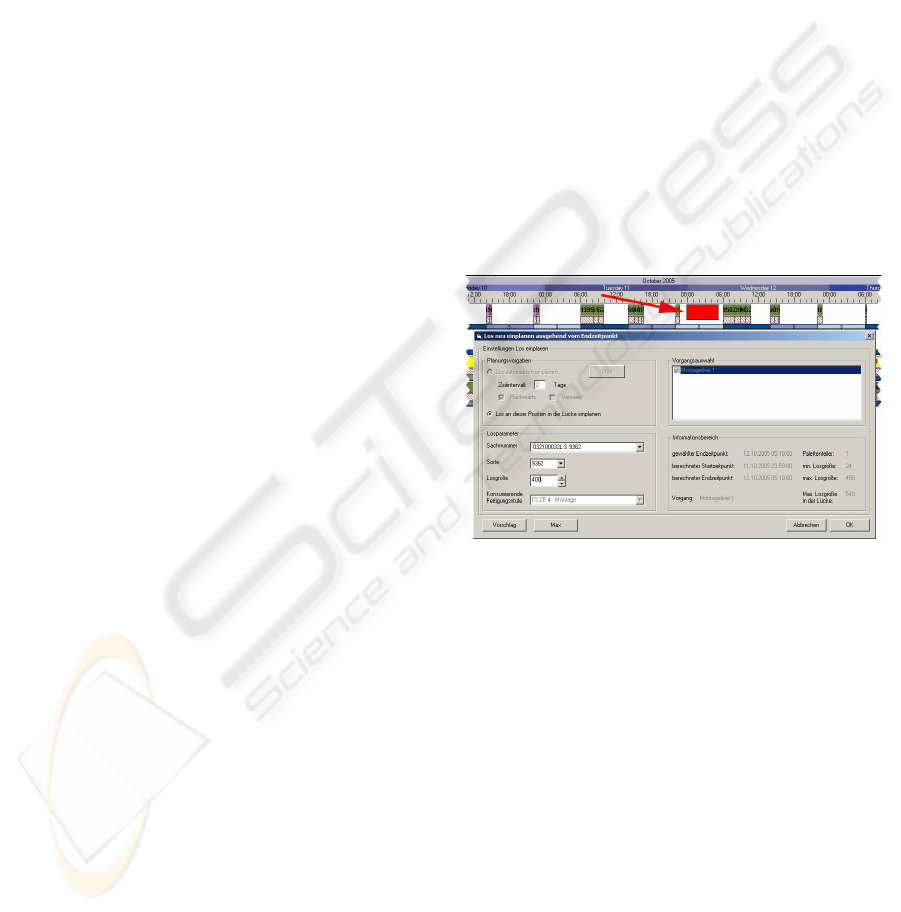
The combo boxes for the possible parts and sorts
are filled dynamically at the start of the dialogue
(Figure 5) and contain only the parts which can be
produced on the chosen AL. After choosing the part
number, information for this part, like the calculated
maximum quantity in this gap, are shown on the
right side of the dialogue.
If a batch size is entered the beginning and end
time of the batch is calculated and a virtual batch is
displayed in the Gantt chart.
If the desired batch size is bigger than the capacity
of the chosen gap, the user has the possibility to start
Figure 5: Dialogue to create new batches.
ICEIS 2007 - International Conference on Enterprise Information Systems
428
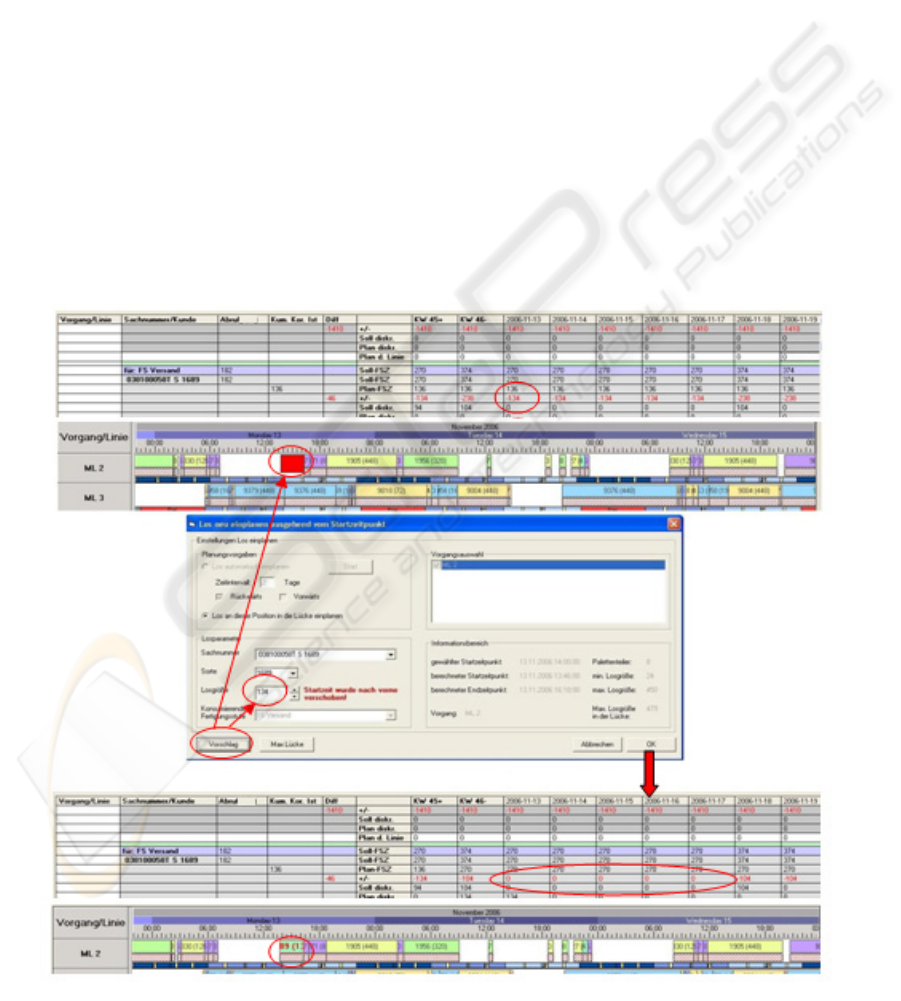
Figure 6: Example of creating a batch semi-automatically.
an automatic search via the dialogue. For that he can
specify in the upper left area of the dialogue if the
search for a gap should be done forward or
backward or in both directions around a number of
days. There is also a decision at which AL’s the
algorithm should search if there is more than one AL
that can produce that part. By pushing the Start-
Button the algorithm searches for a gap and
proposes one if possible.
The virtual batch will be redrawn whenever the
batch parameters changes and becomes the new
batch if the user confirms the dialogue.
As shown above the user has many possibilities
to adapt the plan according to his preferences. Each
action regards the restrictions for the part number as
well as the capacities and inactive times to ensure
that a current plan is always valid according to the
master data.
Additionally the planning table gives the user an
overview of the actual production progress by
showing batch progresses in real time. Thereby the
user can always compare the planned with the actual
progress and adapt the plan if necessary.
5.3 Interaction of both interfaces
Using both modules at once offers maximum
information transparency to the user. He sees both
the calculated cumulative quantities and the batches
which these quantities are calculated of. Whenever a
change is done in the planning table the CQT is
updated, thus the user can see the impacts of his
actions immediately. To see both modules at once a
dual monitor mode is recommended.
In Figure 6 a semi-automatic function is presented
as an example to show the interaction of both
modules. Down left in the new batch dialogue (see
Figure 5) is a button which offers a proposal based
on open demands for the part number in the selected
gap. The CQT in Figure 6 shows a deficit of 134 on
2006-11-13.
After pushing the proposal button, OOPUS checks
if there is a deficit at the chosen gap and in the case
of a deficit checks whether the whole deficit can be
planned in the gap or not. If the deficit can be
eliminated, a batch with the size of the deficit will be
proposed; otherwise the whole gap will be filled to
reduce the deficit to a minimum. In this example
OOPUS - A Production Planning Information System to Assure High Delivery Reliability under Short-term Demand
Changes and Production Disturbances
429

OOPUS generates a proposal of 134 to eliminate the
deficit.
Down in Figure 6 is the result after confirming the
proposal. By creating the new batch there are no
more deficits for the part number in the time from
2006-11-13 till 2006-11-17.
6 CONCLUSION
The software OOPUS, presented in this paper,
is used by an international automobile manufacturer
to plan and control his engine production in two
manufacturing plants. Thereby OOPUS replaced
different isolated applications to unite all aspects
needed for the production planning and control in
one application. Additionally OOPUS automated
many processes which where handled manually and
without IT support before.
OOPUS guarantees a higher planning reliability
by taking every required data into account to create a
production plan that is valid and efficient.
By using two integrated interfaces, the CQT and
the planning table, OOPUS guarantees maximum
information transparency. The user gets a
compressed, but complete overview of all the
relevant data he needs to plan and manipulate the
production plan. The CQT gives an overview of the
situation for the complete planning horizon by
comparing cumulative quantities based on customer
requests with cumulative quantities based on the
already produced parts and the planned parts of the
current plan. The planning table shows this plan and
offers many actions to change it manually, semi-
automatically or automatically. Every change of the
plan leads to a recalculation of the CQT, to ensure
that both interfaces always show the same updated
information.
This maximum information transparency leads to
a big saving of time for the production planner who
no longer needs to change between different
applications to create and control the production
plan.
OOPUS was developed based on the specific
requirements of an automobile manufacturer, so it is
integrated into the system architecture of this
customer. This leads to the idea of developing a
system called OOPUS-WEB which is a platform
independent web application and inherits the main
ideas of OOPUS. Therefore OOPUS-WEB can be
used by smaller companies as well as being
integrated into complex information system
infrastructures at large companies.
REFERENCES
Harjes, I.-M.; Bade, B.; Harzer, F., 2004.
Anlaufmanagement – Das Spannungsfeld im
Produktentstehungsprozess. In: Industrie
Management.
Holland, C., Light, B, 1999. A critical success factors
model for ERP implementation. In: IEEE Software,
vol. 16, no. 3.
Tempelmeier, H., 2006. Inventory Management in Supply
Networks. Problems, Models, Solutions. Books on
Demand GmbH, Norderstedt.
Stammen-Hegener, C., 2002. Simultane Losgrößen- und
Reihenfolgeplanung bei ein- und mehrstufiger
Fertigung. Dt. Univ.-Verl., Wiesbaden.
Katok, E.; Lewis, H. S.; Harrison, T. P., 1998. Lot sizing
in general assembly systems with setup costs, setup
times, and multiple constrained resources.
Management Science, no. 44.
Tempelmeier, H., 2003. Material-Logistik. Springer,
Berlin, 5
th
edition.
Maes, J., McClain, O.J., Van Wassenhove, L.N., 1991.
Multilevel capacitated lotsizing complexity and LP-
based heuristics. European Journal of Operational
Research, no. 53.
Wilson, James M., 2003. Gantt Charts: A Centenary
Appreciation. European Journal of Operational
Research 149, no. 2.
Schönsleben, P., 2004. Integrales Logistikmanagement -
Planung und Steuerung der umfassenden Supply
Chain. Springer, Berlin, 4
th
edition.
Kurbel, K., 2005. Produktionsplanung und -steuerung im
Enterprise Resource Planning und Supply Chain
Management. Oldenbourg Wissenschaftsverlag,
München.
Dangelmaier, W.; Henkel, S.; Holtkamp, R., 1997.
OOPUS - eine objektorientierte PPS-Plattform. In: wt
- Produktion und Management.
Dangelmaier, W.; Brockmann, K.; Hamady, M.;
Holtkamp, R.; Langemann, T., 1999. OOPUS-PSCM -
Ein Werkzeug zum Produktions- und Supply-Chain-
Management. In: Logistik Management: Intelligente I
+ K Technologien. Springer, Berlin.
Dangelmaier, W.; Holtkamp, R.; Hamady, M.;
Langemann, T.; Krebs, W., 1999. Produktions- und
Supply-Chain-Management bei größeren Stückzahlen.
In: PPS-Management.
Dangelmaier, W., Klöpper, B., Timm, T. Brüggemann, D.;
A Modelling Approach for Dynamic and Complex
Capacities in Production Control Systems, BIS 2007,
Lecture Notes of Computer Science 4439, pp. 626-
637, Springer Verlag, Berlin Heidelberg
ICEIS 2007 - International Conference on Enterprise Information Systems
430
