
DATA QUALITY FOR EFFECTIVE E-COMMERCE CUSTOMER
RELATIONSHIP MANAGEMENT
Tanko Ishaya
The University of Hull, Scarborough Campus, Filey Road, Scarborough, YO11 3AZ, United Kingdom
Julian Rigneau
112, Rue des Pyrenees, 75020 Pais, France
Keywords: Customer Relationship Management, Data quality, Data metrics, Data mining and e-Commerce.
Abstract: The quality of web data has become a critical concern for organisations and it has been an active area of
Internet Computing research. Despite its importance and many years of active research and practice, the
field still require ways for its assessment and improvement. This paper presents a framework for assessing
the quality of customer web data and a well defined set of metrics for quantifying its quality. A prototype
has been designed and implemented to demonstrate the usefulness of the data lifecycle and metrics for
assessing the quality of customer data.
1 INTRODUCTION
The Internet has been the most influential
technology in the transformation of modern
commerce and society. The emergence of electronic
business has defined a competitive environment that
is transforming business-to-customer relationships.
Companies have recognised that having a lot of
versatile low-margin customers is less profitable
than a few loyal high-margin customers: the
purchase decile analysis (a refinement of the
monetary decile analysis), applied to customer
segmentation, shows that less than 1% of the
customers make 10% of a company’s total profit
(Newell 2000). Companies that can deliver
convenience and a positive purchasing experience to
their customers seem to be the winners in this
competitive environment (Jukic et al, 2002).
Therefore, companies that were formerly product-
centric have become customer-centric, focusing on
one-to-one customer marketing. Good management
of the relationship between the customers and the
company is now a priority for profitability.
Customer Relationship Management (CRM) is a
multi-channel strategy to provide both a
technological and functional means of
understanding, attracting, and keeping customers
Greenberg (2001). Furthermore, the ultimate
objective of CRM is to provide an efficient means of
making the right offer to the right person at the right
time through the right channel (Berson et al. 2000;
Rogers 1999). While there are a variety of CRM
systems, studies have shown that 60% of these
systems are inadequate (Jukic et al, 2002). Many
issues may account for these failures, including
inadequate attention devoted to providing quality
customer data.
Since CRM is a process based essentially on data
analysis, the quality of data is therefore fundamental.
Without accuracy and reliability, data is useless and
the entire CRM system could almost be ineffective.
Therefore, consistency and integrity in databases is a
fundamental problem because without accurate and
consistent data, the entire CRM system is almost
useless and can have a negative Return On
Investment (ROI). Further studies have shown that
low data quality is probably the main reason for
failure of 50 to 75 per cent of all CRM projects and
of inefficiency for 92 per cent of data warehouses
(McKeon 2001).
The main purpose of this paper is to describe an
ongoing research investigation with the aim of
presenting a multidimensional strategy based on a
proposed data lifecycle and well defined metrics for
quantifying the quality of customer data for effective
92
Ishaya T. and Rigneau J. (2007).
DATA QUALITY FOR EFFECTIVE E-COMMERCE CUSTOMER RELATIONSHIP MANAGEMENT.
In Proceedings of the Ninth International Conference on Enterprise Information Systems - SAIC, pages 92-100
DOI: 10.5220/0002387100920100
Copyright
c
SciTePress

CRM systems. In the next section, we provide a
brief overview of data quality. In section 3, we
describe a proposed framework for ensuring the
quality of data through a proposed data lifecycle.
Section 4, defines metrics for quantifying the quality
of customer data, based on the defined data
lifecycle. Section 5 presents a prototype being
designed and implemented to demonstrate the
usefulness of the data lifecycle and metrics for
assessing the quality of customer data for effective
CRM systems with a discussion of initial results.
Section 6 concludes the paper with further research
questions.
2 THE CONCEPT OF DATA
QUALITY
Defining data quality is very difficult; every
company has its own expectations for the data and
its own risk assessment of data quality (Hufford
1996). Because of the diversity in this view of data
quality it has been defined in many different ways.
For instance, the International Organisation for
Standardisation (ISO) defines data quality as ‘the
totality of characteristics of an entity that bear on its
ability to satisfy stated and implied needs’ (Abate et
al. 1998). Therefore, data is of the required quality if
it conforms to a particular specification and if this
specification was designed for the intended use. So
the notion of data quality is relative to the actual use
of data (Wang 1996).
In this research, the data being considered is only
relevant to CRM systems. It is mainly the accuracy
of customer data, which is personal information:
names, address, phone number and email address.
Customers’ personal information is used is one of
the most important steps of the CRM process:
contacting the customer. Indeed, to organise good
(e-)mailing or phoning campaigns and to keep in
touch with their customers, companies need accurate
personal information. Since mailing campaigns are
very expensive, companies do not want to lose
money by sending mail to wrong addresses, or even
to non-existent customers. In this context, data
quality means data accuracy.
Hoxmeier (1997) suggests that the overall
quality of CRM systems is based on database
structural quality and on data quality. In other-
words, the quality depends on the design of the
information system and on the production processes
(e.g. capture, entry, maintenance, and delivery)
involved in generating the data (Wang 1996). While
we agree that the design and the implementation of
the CRM database is important, database system
failures are traceable to poor database design (Rob
and Coronel 1997). This research is not aimed at
addressing database structural problems, but focuses
on how errors that lead to inaccurate data could be
corrected. This is done by first identifying and
classifying the possible data errors. This is presented
in the next section.
2.1 Classification of Data Errors
Before trying to find solutions for data quality
issues, the different types of errors that often occur
should be enumerated and classified. Some data
errors and database issues are listed in the table 1.
This is not an exhaustive list; it highlights the most
common errors.
Table 1: Different types of data error.
Type Error
Data related
problems
• Data veracity.
• Data entry accidents (data in the wrong
field) (McKeon 2001)
• Data hiding in data (special character
that automatically invoke actions)
(McKeon 2001)
• Incomplete records (McKeon 2001;
Moss 1998)
• Data Duplicate records (McKeon 2001)
• Contradicting data between databases
(Moss 1998)
• Old data (Time is the worst enemy of
data)
Differences
between
databases or
applications
• Different phrases for the same action
(ASAP, Doing business as, c/o)
(McKeon 2001)
• Name and Address convention (Robert
Smith, R Smith) or date convention
(US model and European model)
(McKeon 2001)
• Spelling variations (UK and US)
(McKeon 2001)
• Different Languages (e.g. French and
English)
• Localisation difference (use of different
localisation indicators by different
department/countries, e.g. date and
time) (McKeon 2001)
• Metadata different during
synchronisation between databases.
Data
definition
problems
• Irrelevant data (McKeon 2001)
• Dummy values (values with a special
meaning) (Moss 1998)
• Multipurpose fields (Moss 1998)
DATA QUALITY FOR EFFECTIVE E-COMMERCE CUSTOMER RELATIONSHIP MANAGEMENT
93
This table defines three main types of error which
implies that at least three different solutions are
needed. However, the simplicity of this
classification makes it difficult to analyse the issues.
The causes of the errors are not clearly stated in the
table. Hence, a set of dimensions to assess the data
should be defined.
2.2 Dimensions and Classification
A general criteria for assessing data quality was
proposed by Martin (1976). Some studies were led
to enhance this criterion and finally Wang et al.
(1994 quoted in Abate et al. 1998) identified fifteen
different dimensions to classify the data quality
problems. These dimensions are very comprehensive
but difficult to use because some of them are
subjective. Moreover because this research only
focuses on data quality issues, dimensions like
access security, accessibility or relevancy are not
considered because they are not data-related but
database-related. Therefore, only five of Wang’s
dimensions are used to classify the previously
defined errors as shown in table 2.
Table 2: Classification using the Wang's dimensions.
Dimension Errors
Relevancy Irrelevant data
Accuracy Data veracity; Duplicate record;
Contradicting data.
Acquisition reliability: Data entry
accident; Incomplete record; Data
hiding in data
Representational
consistency
Non Standard representation
Differences between databases:
Name convention; Spelling
variations; Different phrases for
the same action; Different
Languages; Metadata different;
Localisation difference.
Timeliness Data Decay
Interpretability Dummy values; Multipurpose
fields
This classification by dimension is interesting,
because it is far easier to study precisely defined
dimensions. However, it does not consider all the
processes implied in the creation and manipulation
of data. A more general measure of classification is
needed, i.e. a framework. A potentially suitable
framework is presented in the following section.
3 A FRAMEWORK FOR
ASSESSING DATA QUALITY
Data is not static and may even be considered as a
living entity. In fact, data is highly dynamic. Data is
considered as dynamic when it is manipulated by
almost all the business processes during its life.
Studies in the US Department of Defence show that
most data errors occur because of process problems
(Dvir and Evans 1996). Therefore, examining the
existing processes involved in the data life cycle is
very important because “understanding the data life
cycle is important to understand the nature of data”
(Mathieu and Khalil 1998). The data life cycle in
fact provides a means to classify the different errors
by data processes and therefore to find when and
where the problems should be solved.
Although Redman (1996) defined a data life
cycle, its framework is based on two distinct cycles -
data acquisition and data usage and eight processes -
four in each cycle. Because of this division, the
processes are not directly linked and it may be
difficult to use these cycles for sorting the different
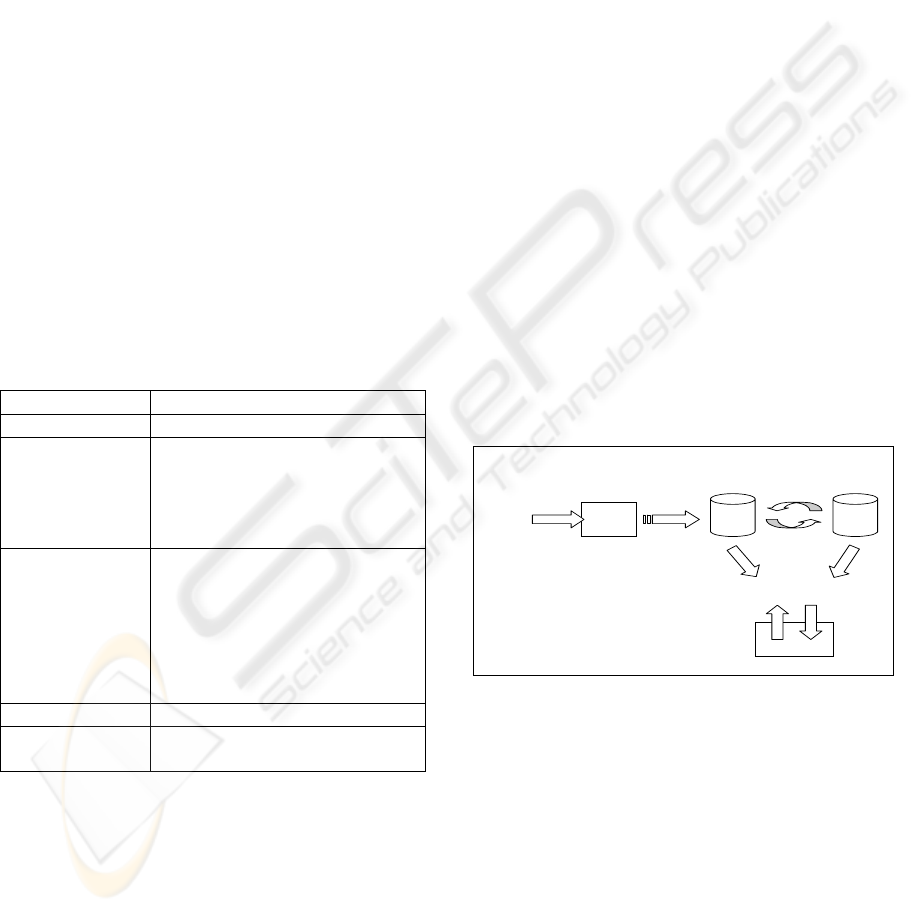
data errors. Therefore we define a unique cycle with
only four main processes: Acquisition, Writing, and
Synchronisation -between databases and
Manipulation. The following figure gives the
different links between the processes (see figure 1).
Writing
Manipulation
A c q u isitio n
Synchronization
Figure 1: The data lifecycle.
The first process is the acquisition of the data e.g. a
customer fills in a form on the Internet. This process
is very important because it is the first step in the
data life cycle. If the data is not accurate at the
beginning, the entire cycle is in jeopardy. The
acquisition may be form-based like on the Internet
and the data may be entered by the customer. This is
often the case in CRM systems.
Writing the data in the database is not an easy
task. Indeed, the data must always be transformed to
fit the field in the database, because the data are
“raw” facts that have little significance unless they
ICEIS 2007 - International Conference on Enterprise Information Systems
94
have been arranged in some logical manner. But
there is a real danger of deforming the data, and so
losing the true meaning.
The synchronisation between databases is an
important process, because there are often at least
two databases used by a company (e.g. the Call
Centre database and the Sales database) or a data
warehouse. Thus data is frequently transferred from
one database to another. The first issue is the
structural differences between databases, which can
lead to errors because for instance the object types
are different. For instance, a 32-bit integer and a
binary coded decimal are not the same type but can
represent the same object. The second problem,
perhaps the most significant one, is redundancy, i.e.
the same data can occur twice (or more) in the
database with a slight difference between each
occurrence. For instance Mr Smith living at 4 St
Martins Square and Mr Snith living 4 St Martins
Square: the problem is to decide if Snith is an
occurrence of Smith or a different person. This
difficulty can occur during the synchronisation
phase (e.g. two databases with a slight data error in
one of them) or during the writing -format problem
or consequence of a bad acquisition.
The manipulation of the data by the customer or
the knowledge worker is in fact a visualisation
problem. The user should see only relevant data, to
be able to use it correctly and efficiently, therefore
the design of the queries is important. Moreover, the
data user should be able to know if they can trust
their data. This data life cycle can be used as shown
in the following section
3.1 A New Error Classification Scheme
Using this data life cycle, the previously defined
errors in table 2 are classified by process in the table
3.
Table 3: Error classification using the data life cycle.
Data
Acquisition
Writing
Data
Synchronisa
tion
Manipulation
Data
veracity
Duplicate
data
Non
standard
representa
tion
Duplicate
data
Databases
differences
Irrelevant
data
Data decay
Some problems can be solved before the beginning
of the data life cycle as shown. However, some of
the errors are more difficult to correct. Thus the
remaining problems are as follows, by order of
importance:
1. Data veracity: this issue is very important
because it is one of the first steps of the cycle. If
the data are incorrect at the very beginning, it is
difficult to detect and correct.
2. Data decay: Time is the worst enemy of data,
because out-of-date information is useless and
inaccurate. Therefore, all the data should be
dated to facilitate their quality estimation.
3. Duplicate data (or redundancy): This issue
occurs in the same database or between several
databases and it is difficult to find and correct
the problems. Redundancy is not studied in this
research because some expensive commercial
tools detect this type of error and because it is a
complex problem.
Using this classification it is easier to design
algorithms to correct the errors. Nevertheless, to
achieve perfect data quality is impossible because,
for instance, some errors cannot be corrected after
being entered in the system. Software metrics are
needed to measure the data quality. The next section
presents an overview of software metrics and how
they can be applied to data quality.
4 MEASURING DATA QUALITY
In this section, the concept of metrics is briefly
discussed. Then the main characteristics of the
metrics used in this research are exposed and
explained.
4.1 Metrics for Data Quality
Metrics are defined rules and methods to measure
and quantify the qualities of an object. A metric here
is not considered in the sense of a metric space.
Measurement is defined as “the process by which
numbers or symbols are assigned to attributes of
entities in the real world in such a way as to describe
them according to clearly defined rules.” (Fenton
and Pfleeger 1997)
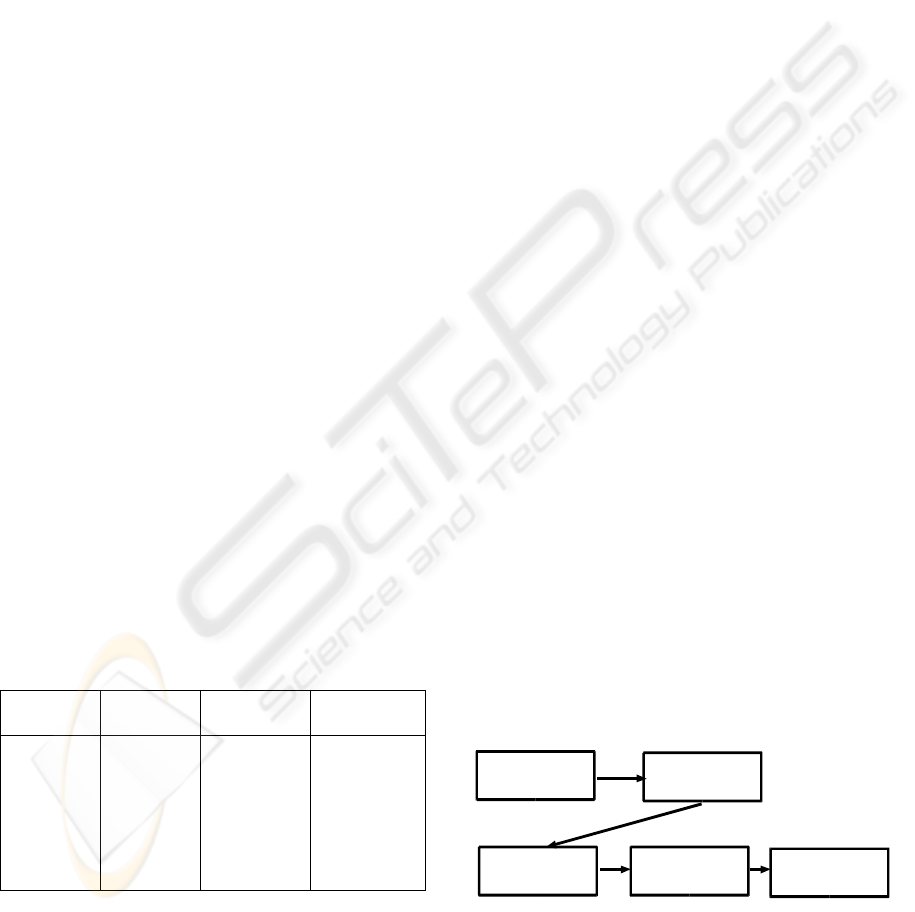
Identify attributes for some real
world entities
Identify empirical relations
for attributes
Identify numerical relations
corresponding to each empirical
relation
Define mapping from real world
entities to numbers
HOMOMORPHISM
Check the numerical relations
preserve and are preserved by
empirical relations
Figure 2: Metrics Methodology (source Fenton and
Pfleeger 1997).
An entity is an object or an event and an attribute
is a feature of property. It is important to understand
DATA QUALITY FOR EFFECTIVE E-COMMERCE CUSTOMER RELATIONSHIP MANAGEMENT
95

that only the attributes of entities are measured:
because entities can not be directly measured. A
methodology for formal measurement is given by
the figure 2.
Therefore, the main issue is first to find the objects
(or entities) which can be measured and then to
precisely define their attributes and finally to assess
them. This method is in fact a continuous cycle of
analysis, implementation and testing to find the best
metrics. This is well suited for defining data quality
for Customer Relationship Management
4.2 Entity
As shown in the previous section, before defining
the metrics for data quality, the entities and their
attributes should be clearly stated. This section
shows that the entities in this case are the fields of
databases. The fields in a database are the smallest
elements and correspond to the proprieties of an
entity. An entity is simply a person, place or event.
In this part the entity is the customer, and the fields
are the personal information (First name, Last Name,
etc…).Each inaccurate (or missing) field decreases
one customer is global quality (tuple in the
database): it is easy to understand that one
customer’s personal information without the address
(or with an inaccurate one) is not as useful as one
with a complete and accurate address. It can be
considered that the first one has a bad quality tuple
in the database because at least one field is
inaccurate (here the address). Therefore, the data
quality of one particular customer depends on the
quality of each field (Names, address…). Using a
more formal notation, we show that:
[Customer data quality]
i
= g([field quality]
1,i
,
[field quality]
2,i
, …, [field quality]
n,i
)
where:
g is a function,
n the number of fields for the customer i
In the same way, the more customers with
inaccurate information, the less the total data quality
of the Information System (the CRM system) is
good. Indeed, if there are too many bad quality
tuples, the entire database cannot be trusted.
Therefore, the data quality of the Information
System depends on the quality of each customer and
it can be written:
(Information System data quality) = h([customer
data quality]
1
,…, [customer data quality]
m
)
where:
h is a function
m the number of customers
Using these two formulas, a global definition can
be found:
(IS quality) = h(g([field quality]
1,1
,…, [field
quality]
n,1
),…, g([field quality]
1,m
,…, [field
quality]
n,m
))
Based on this formal definition it can be deduced
that the CRM system data quality depends on the
quality of customer fields quality and so to find data
quality, the research is be focused on the customer
data fields. To find the associated metrics, the
attributes of the field should be defined.
4.3 Attributes
Three different attributes are defined for each field
in order to describe the field quality. The quality
important to understand that the quality of one field
depends on these three attributes, i.e.
([field quality]
i
=f
i
(Age,Accuracy,Meaning)
where:
f
i
is a function for the field i
Age, Accuracy and Meaning the attributes of the
field I
The function f depends on the type of the field
and it is not the same for a name field or a phone
field for instance.
Age
Age is an important attribute because for
instance six-month-old information may not be as
trusted as one month old information. The simplest
way of measuring the age of data is to define a scale
to group the dates by categories (e.g. one month old,
three months old, six months old, more than one
year old).
Accuracy
The accuracy is the internal or intrinsic quality
of a value. For instance, a first name with digits or a
phone number with letters is impossible. So the
accuracy is based on precise rules, and has only two
values: true (possible) or false (impossible).
Meaning
The meaning attribute is the most complex one
because it defines the meaning of a value. For
instance, according to the accuracy attribute,
“Wilson” and “jfdlsfjlsd” are possible, but obviously
only “Wilson” can be a real last name.
5 IMPLEMENTING THE
METRICS
This section explains the different algorithms
designed to calculate the metrics and the results
found. As a case study, only address systems in the
United Kingdom and France are studied, and
therefore some algorithms may be not suitable for
ICEIS 2007 - International Conference on Enterprise Information Systems
96

others countries. Moreover, we consider the case of
customers filling web forms and therefore their
behaviours may be different than in other cases (e.g.
hand-written forms).
5.1 Different Fields
This part studies the fields that may be used in CRM
databases. Names (first name and last name)
Names (first name and last name)
Firstly, it is important to notice that a name is
composed of letters. In other words a digit found in a
name means that the name cannot be a real name
and therefore the quality of this field is then bad or
even null. Likewise, some special characters like “-“
are allowed and others like “%” are forbidden. These
types of quality issues are intrinsic and therefore
correspond to the Accuracy attribute. This attribute
is calculated with the rules algorithm proposed in
section 5.2. The problem of Meaning for a first or
last name is complex because it is difficult to assess.
A list of common first names can be used to validate
a first name. Nevertheless, a first name not on the
list is not necessary impossible, perhaps it is only
rare. Furthermore this method can not be applied on
a last name. Therefore, other algorithms are needed
as shown in section 5.2.
Address
An address is composed of a street, a postcode, a
city and a country. It is important to know that a lot
of commercial applications already exist to check
addresses, using postal databases, but they are
usually expensive.
Street
The main problem in the street field is that almost all
the characters and digits are allowed. Therefore, the
accuracy attribute is not measured as the names.
Hence, assessing the meaning attribute is a priority
for this field. Some interesting algorithms may be
designed from the intrinsic structure of the street
field. For instance specific keywords usually appear
in addresses (e.g. “Street”,”Avenue”,”Place”).
Therefore an address with a recognised keyword has
a higher probability to be accurate.
City
The city field has the same limited number of
allowed characters as the name fields so the
accuracy attribute is effective. While, there are a set
of city names in each country, its meaning is as
difficult to assess as for names, and the same
algorithms will be used to check its accuracy. There
is an interesting point to notice: in an address, the
city and the postcode are linked. Therefore, it is
possible to check the city and the postcode fields
with this method.
Postcode
The postcode follows a precise standard. The size is
precisely defined, for instance always five digits in a
French postcode, and even the type of the characters
is clearly specified, for example the first character in
an English postcode is always a letter. Therefore the
postcode uses the rules algorithm.
Country
Country is an important field because almost all the
algorithms are country-dependent. To avoid this
issue, the formats of the postcode and phone number
(country-dependent) may be tested from the country
field value. If the results are not satisfying the
country may be found from the postcode and the
phone number. A drop-down list could also be used
for countries and their cities.
Contacts
Phone number
The phone number has the same property as the
postcode and depends on a defined format.
Therefore, the rules algorithm is used.
Email
An email has a very precise format, and therefore
the accuracy attribute may be easily estimated.
To assess the meaning attribute, an email may be
sent to the given address. If there is a server error
reply, the address may be considered as wrong.
5.2 Algorithms
The algorithms are designed to assess the three
attributes defined in section 4.
Age algorithm
A simple algorithm is needed to measure the age
attribute. The difference between the actual date and
the field creation date (or last update date) is
calculated. The result is then classified using the
following scale (see table 4):
Table 4: Scale for the age attribute.
Age Quality
less than three months New
less than six months Recent
less than one year Normal
less than two years Old
more than two years Ancient
Rules algorithm (for the Meaning attribute)
As shown previously, the accuracy attributes are
essentially based on rules. A rule describes how a
DATA QUALITY FOR EFFECTIVE E-COMMERCE CUSTOMER RELATIONSHIP MANAGEMENT
97

value must be constructed to be acceptable. For
instance, an English phone number has eleven digits,
the first one is usually a zero and the second one
should be one, two, or seven. This is a precise rule,
based on a defined pattern. But some rules can be
more general: a first name is composed of letters and
may have some special characters (e.g. “-”).
Obviously, the number of characters in a name is not
fixed as in a phone number. It is important to notice
that the rules are country based. For example the
number of digits in phone numbers is different in
France (10) and in Britain (11). Therefore, the
different rules should be sorted by country. The
general algorithm is based on the characters’
analysis. Each character is assessed with the
different rules. Because of slight differences, there
are two possible algorithms:
Defined pattern
A defined pattern has a precise size and the exact
location of all the characters is known. A rule is for
instance:
The French postcode has five and only five
digits (numbers from 0 to 9)
Therefore, the corresponding pattern is:
NNNNN (with N a digit from 0 to 9)
And the algorithm compares the postcode to the
pattern, character by character. If an error occurs
then the postcode is not valid. In some cases there
are more than one pattern. For instance
The British customer phone number has eleven
digits, the first one is zero and the second one can be
one, two or seven
The corresponding patterns are then:
01NNNNNNNNN
02NNNNNNNNN
07NNNNNNNNN
And the algorithm compares the phone number
to the first pattern. If this pattern does not match, the
algorithm uses the second pattern and then the third
one. If none of them match then the phone number is
not valid.
General pattern
A general pattern has no particular size, and only the
type of the allowed characters is known. A rule is for
instance:
A last name has only letters and the special
characters “-“ and “.”
The corresponding general pattern is:
Letters – .
The algorithm checks each character of the last
name to find if it is a letter, “.” or “-“. If one
character does not match then the last name is not
valid.
5.3 Implementation of the Defined
Rules
To measure the usefulness of the defined metrics, a
Java application was design and implemented. All
the rules are stored in XML files as patterns and
sorted by country. To check a field, the algorithm
retrieves the rule corresponding to the country in the
XML file, using the SAX (Simple API for XML)
parser. The field value is then compared to the
pattern (or patterns), i.e. each character is checked
with the rule. If there is an error (i.e. the field breaks
the rule), the algorithm returns false else true. The
Accuracy attribute directly depends on this result,
and is equal to 0 if the algorithm returns false, else it
is equal to 1.
5.3.1 Meaning Algorithms
The main concern regarding the meaning attribute is
to assess the value of a field to decide if this value
has a meaning. Therefore, a lot of different strategies
are needed for different fields. For instance, a
strategy for checking the meaning of a phone
number may be different from a strategy of
assessing the meaning of a first name. They can be
considered as indicators that indirectly assess the
meaning attribute, therefore the interpretation of the
results is very important. The criteria used to check
names (first names, last names and cities) are
explained in the following sections. The main idea is
that the normal names (first names, last names and
cities for instance) have particular values.
Vowel ratio
This algorithm compares the number of vowels to
the total number of letters. The result is the number
of vowels divided by the number of letters,
displayed as a percentage (e.g. 50% means that half
the letters are vowels). A high value means that the
name (or word) has more vowels than consonants.
Pattern redundancy
The pattern frequency algorithm will calculate the
frequency of groups of letters, which occur more
than once. These groups are called pattern and can
have any size. The algorithm returns the size of the
most frequent patterns multiplied by its frequency
divided by the number of letters in the name. This
number may be considered as the “surface” of the
pattern. A high value means that there is a recurrent
pattern, which is unusual in a real world name.
Keyboard algorithm
The keyboard algorithm is based on the location of
the keys on a keyboard. In fact few real world names
depend only on the second line of the keyboard
(a,s,d,f…), but fake names (e.g. “dklsajl”) are very
ICEIS 2007 - International Conference on Enterprise Information Systems
98
often formed mainly of letters from the second
keyboard line. Therefore, this algorithm gives the
percentage of letters from the second line used in a
name. A high value means that the name may be
fake.
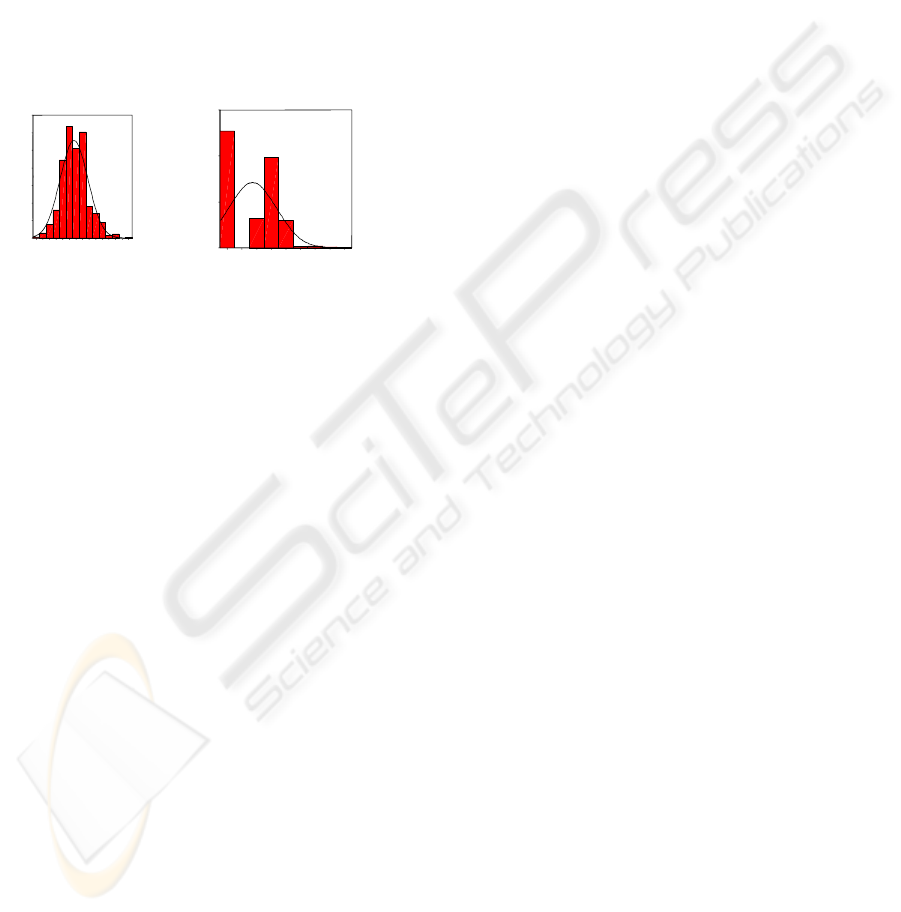
5.3.2 Evaluation
The evaluation was carried out to test the algorithms
on real names to assess their effectiveness. It is also
the basis to evaluate how the results should be used.
The meaning algorithms used with a panel of French
students names produced the following results (see
figure 3).
It is interesting to see that out of 585 names, none
has a vowel ratio less than 15% or greater than 85%,
and a pattern redundancy greater than 80%.
Therefore, thresholds are set up and used to quantify
the results of the algorithms. From the previous
results, a rule for data quality can be stated as: “A
name with a good meaning attribute has a vowel
ratio between 15% and 85%”. Therefore the
simplest way to quantify this rule could be a binary
function (i.e. 0 when the results are out of range, else
1).
The main difficulty is the interpretation of the
limits. In fact if a binary function is used to
transform the results to a meaning attribute, a
number slightly out of range will mean bad quality,
which is not acceptable (e.g. a vowel ratio of 14%
can occur even for a real name). The best solution is
to have an exponential decreasing function for the
limits (e.g. before 15% or after 85% for the vowel
ratio). So the value given by the algorithm is in the
threshold, the name passes the test and the returned
value is maximum, else the exponential function is
used.
6 CONCLUSIONS AND
FURTHER WORK
Data quality is a very important issue for CRM
based on information systems with huge databases.
This paper demonstrates a framework based on the
data life cycle to classify the different error types.
Using this classification, algorithms have been
designed to correct and prevent possible errors of the
first two processes of the proposed framework.
Since all the errors cannot be prevented nor
corrected, we have designed, implemented and
tested a set of metrics to quantify the quality of
customer data. The metrics measure the quality of
each field of the database, using three attributes Age,
Accuracy and Meaning to quantify data quality.
Although the results seems limited to a very specific
application domain, the idea can be extended to
other types of data –such patient data in the medical
domain.
Further work will focus on the different
functions (i.e. f, g, h) needed to calculate data
quality metrics and on how to visualise this quality.
The main problem is to define global data quality of
a CRM database, and how the metrics explained in
this paper may be used to measure this global
quality.
REFERENCES
Abate, M.L., Diegert, K.V., Allen, H.W. (1998). ‘A
Hierarchical Approach to Improving Data Quality’,
Data Quality Journal, 23(1):
Berson, A., Smith, S., Thearling, K. (2000). Building data
mining application for CRM, McGraw-Hill, New
York.
Conway, C. 2001 In Greenberg, P. (2001). CRM at the
speed of light, Osborne/McGraw-Hill, Berkeley.
Dvir, R., Evans, S. (1996). A TQM Approach to the
Improvement of Information Quality_, Proceedings of
the 1996 Conference on Information Quality,
Cambridge, MA, pp 207-220.
Fenton, N.E., Pfleeger, S.L. (1997). Software metrics: a
rigorous and practical approach, PWS Publishing
Company, Boston.
Greenberg, P. (2001). CRM at the speed of light,
Osborne/McGraw-Hill, Berkeley.
Hoxmeier, J.A. (1997). A framework for assessing
database quality, ER’97 Workshop, November 1997,
http://osm7.cs.byu.edu/ER97/workshop4/jh.html
(accessed 1/02).
Hufford, D. (1996). ‘Data Warehouse Quality’, Portal
Feature, January 1996.
Vowel
Rti FR
85.0
80.0
75.0
70.0
65.0
60.0
55.0
50.0
45.0
40.0
35.0
30.0
25.0
20.0
15.0
Vowel
F
re
q
u
e
140
120
100
80
60
40
20
0
Std. Dev =
10 50
Mean =
43 5
N =
585 00
Pattern Redundancy
FR
80.070.060.0 50.0 40.0 30.0 20.0 10.0 0.0
Pattern Redundancy
FR
Fr
eq
ue
nc
y
300
200
100
0
Std. Dev = 16.40
Mean = 17.2
N = 585.00
Figure 3: Results.
DATA QUALITY FOR EFFECTIVE E-COMMERCE CUSTOMER RELATIONSHIP MANAGEMENT
99

Jukic, N., Jukic, B., Meamber, L. and Nezlek, G. (2002).
Improving E-Business Customer Relationship
Management Systems with Multilevel Secure Data
Models, Proceedings of the Thirty-five Hawaii
International Conference on Information Systems
(2002)
Martin, J. (1976). ‘Principles of Database Management’,
Prentice-Hall, Englewood Cliffs, New Jersey.
Mathieu, R G., Khalil, O. (1998). Data quality in the
database Systems Course, Data Quality Journal, 4 (1).
McKeon, R. (2001). ‘Addressing e-government data
problems in the 21
st
Century’, GEOEurope, August
2001, pp. 42-43.
Moss, L. (1998). ‘Data Cleansing: A Dichotomy of Data
Warehousing?’, DM Review, February 2001.
Newell, F. (2000). Loyalty.com: Customer Relationship
Management in the New Era of Internet Marketing,
McGraw-Hill, New York.
Rob, P., Coronel, C. (1997). Database Systems: Design,
Implementation, and Management, third edition,
Course Technology, Cambridge.
Rogers, M. 1999 In Newell, F. (2000). Loyalty.com:
Customer Relationship Management in the New Era of
Internet Marketing, McGraw-Hill, New York.
Wang, R.Y., Strong, D., Guarascio, L. (1994). An
empirical investigation of data quality dimensions: A
data consumer’s perspective, Working paper TDQM-
94-01, MIT TDQM Research Program, E53-320, 50
Memorial Drive, Cambridge, Ma, 02139.
Wand, Y. and Wang, R.Y. (1996). Anchoring data quality
dimensions in ontological foundations,
Communications of the ACM, November 1996, 39
(11): 86-95.
ICEIS 2007 - International Conference on Enterprise Information Systems
100
