
TOWARDS COOPERATION AMONG COMPETITIVE TRADER
AGENTS
Paulo André Lima de Castro
1,2
and Jaime Simão Sichman
2
1
Technological Institute of Aeronautics, São José dos Campos, São Paulo, Brazil
2
Intelligent Techniques Laboratory, University of São Paulo, São Paulo, Brazil
Keywords:
Multiagent systems, automated trading, multiagent architecture.
Abstract:
In order to manage their portfolios in stock markets, i.e., to determine buy and sell signals, human traders use a
set of algorithms created by economists, which are based on stock prices series. These algorithms are usually
referred as technical analysis. However, traders prefer to use a combination of several algorithms as indica-
tors, rather than choosing a single one. The several signals provided are used to determine the trader order to
buy or sell some stocks, or even to decide to not submit any order. In the last years, some researchers have
tried to create new algorithms with learning skills in order to produce autonomous automatic traders, some of
them using AI techniques. Inspired by the human traders´ decision processes, our architectural approach com-
poses heterogeneous autonomous trader agents in a competitive multiagent system. This architecture allows
the use of several algorithms, based on different technical analysis indexes to manage portfolios. We have
implemented this architecture and we have performed a set of simulation experiments using real-data from
NASDAQ stock market. The experimental results were compared to the performance of single agents playing
alone, and a better global performance was observed when traders compete with each other for resources.
These preliminary results indicate that competition among agents, as proposed here, may reach very good
results, even among agents created to act alone in this kind of market.
1 INTRODUCTION
In this paper, we propose an architecture based on
autonomous agents to model the behavior of au-
tonomous stock trading. The architecture uses sev-
eral trader agents, each one with its own indepen-
dent strategy. These agents are permanently assessed
and resources may be transferred to agents with better
performance. This approach allows adaptation in the
agent society behavior, because agents with more al-
located resources have a greater influence on the over-
all system performance.
2 RELATED WORK
Stock prices prediction or autonomous stock trading
management is a common problem and there is a lot
of work in the literature about it. This work may be
basically divided in two big groups: using a single
autonomous agent, which may be based on many ap-
proaches like neural networks, reinforcement learn-
ing, fuzzy sets, bayes networks, etc or using a mul-
tiagent system, where specialized agents perform the
multiple tasks that compose the decision process in
stock trading.
In the first group, agents usually trade with a spe-
cific stock and use a simple decision process (Sher-
stov and Stone, 2004) (Kearns and Ortiz, 2003).
Agents strategies are based on well known tech-
niques from the financial market, like MACD (Ap-
pel, 2005) or use some AI techniques, as reinforce-
ment learning (Sherstov and Stone, 2004; Yu and
Stone, 2000). Some interesting work of this class are
performed within PLAT (Penn-Lehman Automated
Trading) project(Kearns and Ortiz, 2003) (Subrama-
nian et al., 2006), which consists of an investigation
of algorithms and strategies for automated trading in
financial markets. This project uses an exchange sys-
tem simulator called PXS that delivers real data from
Nasdaq exchange at real time to trader agents.
138
André Lima de Castro P. and Simão Sichman J. (2007).
TOWARDS COOPERATION AMONG COMPETITIVE TRADER AGENTS.
In Proceedings of the Ninth International Conference on Enterprise Information Systems - SAIC, pages 138-143
DOI: 10.5220/0002388101380143
Copyright
c
SciTePress

It is important to note that managing many stocks
with one agent for each stock, without either infor-
mation exchange among agents or a global vision is
not considered as a good idea: domain experts point
out that using the natural complementarity among
stocks is a good way to reduce risks and achieve more
predictable results. In other words, the cooperation
among (specific) traders is really important and com-
mon for humans traders. In the second group (mul-
tiagent systems), most of the work (that we know)
in multiagent systems for automated trading (Decker
et al., 1997) (Yuan Luo and Davis, 2002) use prede-
termined roles for each agent in the system. These
roles are based on specialized tasks, such as techni-
cal analysis, decision making, fundamental analysis,
communication, etc. In this approach, the adaptation
in buying/selling strategy becomes harder and possi-
bly slow down the decision making process, because
all (or almost) agents are involved in each decision.
Our approach differs from the first group because
it is based on multiagent systems and differs from the
second group, because it uses a set of trader agents
that (in contrast to the first group) are able to redis-
tribute money and stocks among themselves in order
to achieve better global performance. This approach
is built over a flexible architecture that can use inde-
pendent work based on autonomous agents and incor-
porate them in a competitive multiagent society, with-
out serious changes in the deliberation mechanism of
such agents.
The rest of the paper is organized as follows. In
section 3, we briefly describe important indexes used
in stock market. We present our architecture in sec-
tion 4. We show some simulation results in section 5.
Finally in section 6, we present our conclusions and
suggestions for future work.
3 STOCK MARKET ANALYSIS
TECHNIQUES
In this section, we present some different technical
analysis techniques that are used by human operators
when deciding about actions in stock markets. These
techniques, briefly outlined here, will be used by the
agents of our architecture, described in section 4.
• Relative Strength Index (RSI): it was created in
1978 by J. Welles Wilder and became the most
known and popular oscillator used by stock mar-
ket. The RSI is calculated using the positive and
negative variations of price.
• Stochastic Index: It is based on the hypothesis
that one stock is in high trend, when its biggest
prices are observed in the end of an observation
period. Similarly, the stock is in down trend, when
its smallest prices happen in the end of the period.
• Moving Average (MA): It tries to identify trends
in stock prices. The average is defined by an ob-
servation period, usually defined between 14 and
60 days, and a calculation method that can be
simple average (sum of all prices and divide it
by the number of values) or exponential average
to give more relevance to newer quotation rather
than older quotations. The moving average is in-
terpreted using graphics with lines of moving av-
erage and prices. The moving average line is a
resistance for high trends and down trends. When
prices are in high trend (or down trend) and quo-
tations line crosses the moving average line, it
means a warning to trend reversal.
• Moving Average Convergence/Divergence
(MACD): It is a trend following momentum
indicator that shows the relationship between
two moving averages of prices. The MACD is
calculated by the difference between a 26-day
and 12-day exponential moving average. A 9-day
exponential moving average of the MACD, called
the "signal" line is plotted on top of the MACD to
show buy/sell signals (Appel, 2005).
• Price Oscillator: It is similar to the MACD, but
the Price Oscillator can use any two user-specified
moving averages. (The MACD always uses 12
and 26-day moving averages, and always ex-
presses the difference in points). It is calculated
by the difference between the moving averages
divided by the shorter-term moving average and
present usually as a percentage. There is a buy
signal when the Price Oscillator rose above zero
and sell signal when the indicator fell below zero.
4 ARCHITECTURE PROPOSAL
In the following subsections, we will briefly describe
the general architectural guidelines, and the three
kinds of agents that compose the proposed architec-
ture: trader, coach and conflict solver agents. Fi-
nally, A short explanation about two assistance ser-
vices used by agent society are presented.
4.1 General Guidelines
The main guidelines observed in the proposed archi-
tecture are the following: (i) adaptability: the archi-
tecture must allow high adaptability, (ii) simple trader
agents: the traders must be as simple as possible to
TOWARDS COOPERATION AMONG COMPETITIVE TRADER AGENTS
139
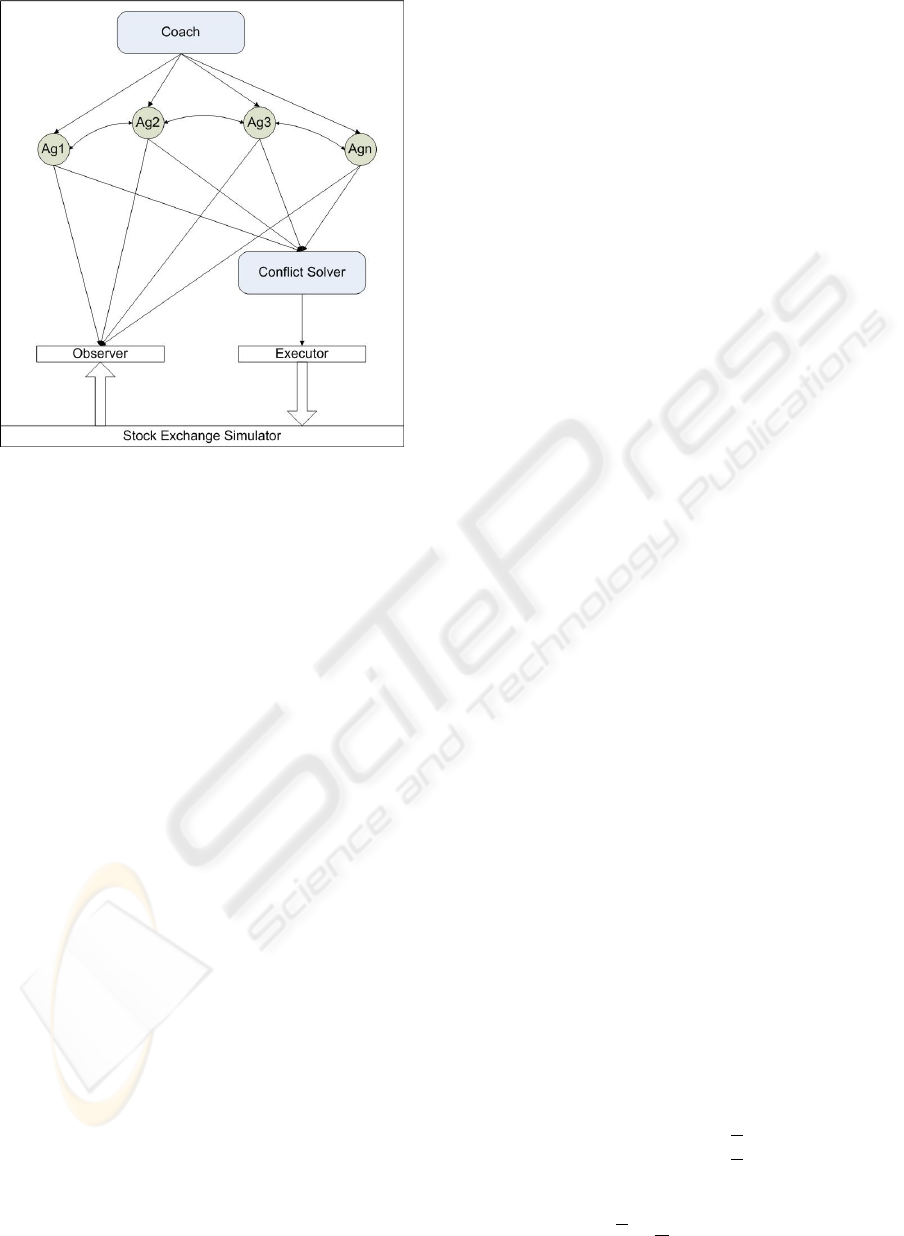
Figure 1: Architecture for Multiagent Stock Trading. Cir-
cles represent trader agents. The coach and conflict solver
agents are represented by gray rectangles and white rectan-
gles represent the assistance services.
facilitate their replacement and the incorporation of
third part agents, (iii)autonomy: system must be able
to trade without human intervention and (iv)dynamic
society: at any moment it is possible to reallocate re-
sources among agents in order to adapt society).
4.2 Kinds of Agents
The architecture is composed by a society of three
kinds of agents: coach, trader and conflict solver
agents, as shown in figure 1. The agents use two assis-
tance services: one to transfer order to the exchange
system, called executor and another, called observer,
to monitor market quotations. We opted to implement
these features as independent services to facilitate the
migration to others systems, for example, others ex-
change systems simulators or even a real exchange
system. We describe these three kinds of agents next.
4.3 Trader Agent
Trader agents are able to define buy and/or sell orders
for an specific stock. Their goals are to obtain the best
possible return and lower risks. Their decisions will
be evaluated by the coach, who compares the return of
each trader through its average revenue and its risks
through standard deviation of trader portfolio value.
Each trader agent works with some shares of one spe-
cific stock and some amount of money which are de-
fined in beginning of operation. These amounts are
changed by buy/sell operation and by reallocation per-
formed by coach agent. Moreover, each trader agents
adopts a particular strategy to decide when to buy or
sell their stocks, as described in section 3.
In this architecture, the society is composed by
an arbitrary number of trader agents and this number
may be changed along the operation. For instance,
new trader agents may be included in society at any
time and the coach may transfer all the resources from
one trader to the others, what would be equivalent to
exclude the former from society. Despite each trader
is able to deal with just one stock, the system is able
to deal with several stocks and to explore comple-
mentarity among stocks, due to the work of several
trader agents and coach reallocations. The portfolio
managed by the system is equivalent to the union of
all stocks and money managed by each trader agent.
The system result is a function of all traders results
weighted by its resource allocation, therefore the re-
allocations performed by coach agent may change the
system result.
4.4 Coach Agent
The goal of coach agent is to evaluate each trader
agent and to allocate more resources to the best
traders in order to improve system performance.
These two processes are described next.
4.4.1 Evaluation
Evaluation of a stock trader performance is a common
problem in financial analysis, which is naturally dealt
with by evaluating the performance of human traders.
Hence, there is no reason to create new ways of evalu-
ation for software agents that trade stocks. Therefore,
we decided to use well known methods of evaluation
from financial analysis. Among several ways found
in the field, one of the most used is the Sharpe in-
dex (Sharpe, 1994). Such indicator is a measure of
performance adjusted to the risk and takes in account
the average return and volatility associated to portfo-
lio. The Sharpe index uses as reference the return of
an asset free of risk. For simplicity, we will consider
that this return is zero. For each trader A
i
there is a R
i
,
that represents its return in a defined period. There-
fore, we may calculate Sharpe index for an period of
time from 1 to N as presented in equation 1:
SharpeIndex =
R
σ
(1)
where:
R =
1
N
∗
N
∑
i=1
R
i
(2)
ICEIS 2007 - International Conference on Enterprise Information Systems
140

σ =
s
1
N − 1
∗
N
∑
i=1
(R
i
− R)
2
(3)
The performance of one trader agent (A
i
) is based
on its Sharpe index and defined as P(A
i
), as shown in
equation 4:
P(A
i
) =
Sharpe(A
i
) − Min_Sharpe(A)
Max_Shar pe(A) − Min_Shar pe(A)
(4)
This evaluation is a real number in the interval
[0,1]. The expression Min_Sharpe(A) means the low-
est Sharpe index among all trader agents (this number
may be negative) and Max_Sharpe(A) is the biggest
Sharpe index among all traders. Sharpe(A
i
) means
the Sharpe index of the target trader agent A
i
for an
given evaluation period. This period is less or equal
to a quarantine period, described in section 4.4.2, to
avoid distortion in evaluation by reallocations.
4.4.2 Reallocation
The reallocation is based on the evaluation of traders
performance and its objective is to transfer resources
from trader agents with poor evaluations to trader
agents with better performance. One of the main is-
sues in reallocation is that the process should be fast
enough to adapt the systems to changes in stock mar-
ket. On the other hand, when reallocation happens too
often, the system may present oscillations or an incon-
sistent behavior. Another issue is to avoid that the re-
allocation interferes with the evaluation process. This
may happen because coach evaluation is impacted by
variation on assets, therefore a reallocation could in-
terfere in evaluation. We avoid such problems by
creating a quarantine period. After reallocation, the
agents involved are put in a quarantine period. Dur-
ing such period, agent performance is evaluated but it
does not participate of reallocation neither as source
or destiny. Therefore, the quarantine period is defined
as bigger or equal to evaluation period and it avoids
interference in evaluation.
At each cycle, after agents evaluation, coach trans-
fers resources from worst performance agent (A) to
the best performance agent(B), except by those that
are in quarantine. The money and share amount (re-
sources) are proportional to difference between per-
formance according to equation 5:
Reallocated_Res = Res(A) ∗ λ ∗
P(B) − P(A)
P(A)
(5)
When agents A and B trade with same stock, the
coach reallocates not only money, but also an amount
of shares defined by an equation similar to equation
5. The symbol λ is a calibration constant used to
make the system faster or slower. The function P is
the agent performance measured by the coach agent
at the current moment, shown in equation 4.
4.5 Conflict Solver Agent
The conflict solver agent analyzes and eliminates in-
consistent orders from trader agents. For instance,
consider the case where trader agent A gives an or-
der to sell 1000 shares of stock X, meanwhile trader
agent B gives an order to buy 1000 shares of the same
stock X. This may happen when agent A believes that
price of stock X is going down, while B believes the
opposite. The problem is that if both orders are sent
to exchange, both agents would have to pay fees to
exchange and brokers. These fees are eliminated by
the conflict solver agent. This agent transfers 1000
shares of stock X from agent A to agent B and the
amount of money equals to 1000*(Price of stock X in
the market) from agent B to agent A and eliminates
the sell order from A and the buy order from B. This
allow both agents to follow their strategies and avoid
unnecessary costs to the system.
5 SIMULATION EXPERIMENTS
AND RESULTS
We have tested the proposed architecture by using a
simulator. The main characteristics of this procedure,
as well as the obtained results, are described next.
5.1 Simulation Characteristics
We have adopted a discrete time approach to simulate
our architecture, using real data from NASDAQ ex-
change market. Each trader agent gives an order at
every simulation cycle. In this work, one simulation
cycle is equivalent to one day
1
. The trader agent order
specifies the target stock, the operation type (buy or
sell) and the amount of shares to transact. Orders with
zero shares are acceptable and would be equivalent
to an agent decision to not operate at the current cy-
cle. Trader orders are executed at market price. Each
trader agent may access quotation from all previous
cycles, but never the current quotation. The simula-
tion allocates for each trader agent an initial capital
(usually 1 million dollars), that agents can use to buy
shares. One trader agent is limited to its capital. It can
not buy shares that worth more than his capital and it
can not sell shares that it does not hold in the current
1
If necessary, it would be easy to change the simulation
cycle duration.
TOWARDS COOPERATION AMONG COMPETITIVE TRADER AGENTS
141
cycle. For simplicity, we decide to not compute ex-
change or broker fees in agents transactions.
The sequence of action of agents and assistance
services is cyclic and determined by simulation mech-
anism according to the following sequence: observer,
coach, trader agents, conflict solver and executor.
5.2 Simulation Results
We have executed several simulations with real data
from Nasdaq market exchange. We used the Nas-
daq 100 Index (Exchange, 2007), which lists the top
100 stocks in Nasdaq, in order to select the papers.
The data refers to history prices in the period from
September 1986 to September 2006 obtained from
Yahoo Finance (Yahoo, 2007). However, many com-
panies listed on Nasdaq 100 Index are new compa-
nies and therefore don not have price information for
the whole period. We arranged the companies listed
in Nasdaq 100 index in four groups: 20 years (10
stocks), 15 years(40 stocks), 10 years (70 stocks) and
5 years (90 stocks), according with the price history
available. The number of agents in society is defined
by the product of the number of techniques by the
number of stocks plus two, these latter corresponding
to the coach and conflict solver agents.
We used trader agents that implemented the five
technical analysis techniques described in section
3: Relative Strength Index (RSI), Stochastic Index,
Moving Average (MA), Moving Average Conver-
gence Divergence, (MACD, we used 10 and 30-day
moving averages.) and Price Oscillator. In order to
achieve complete flexibility, the MAS will have for
each stock, five agents, one per each technique avail-
able. Additionally, each society has one Coach agent
and one Conflict Solver.
We have performed some experiments using only
three technical agents to analyze the impact of fewer
agents in system performance 2. It is possible to real-
ize that system performance improves when the num-
ber of stocks increases, since the best performance is
obtained by 5 years groups, which deals the great-
est number of stocks. In the experiment with five
technical agents, the system performance was im-
proved 3.These results show better MAS performance
than when it was used only three techniques. This sit-
uation confirms our expectation about the use of more
techniques. The society seems to present better per-
formance when it has more options to do reallocation,
or in another words, when it has more trader agents.
In all experiments, we have adopted the values for the
observation period and the calibration constant of re-
sources λ respectively as 40% of total estimated time
and 0.999.
Figure 2: Sharpe Index obtained for agents groups of three
specific techniques and a Multiagent System (MAS) built
within the architecture proposed in this paper. Each column
indicates the stock group managed by each group of agents.
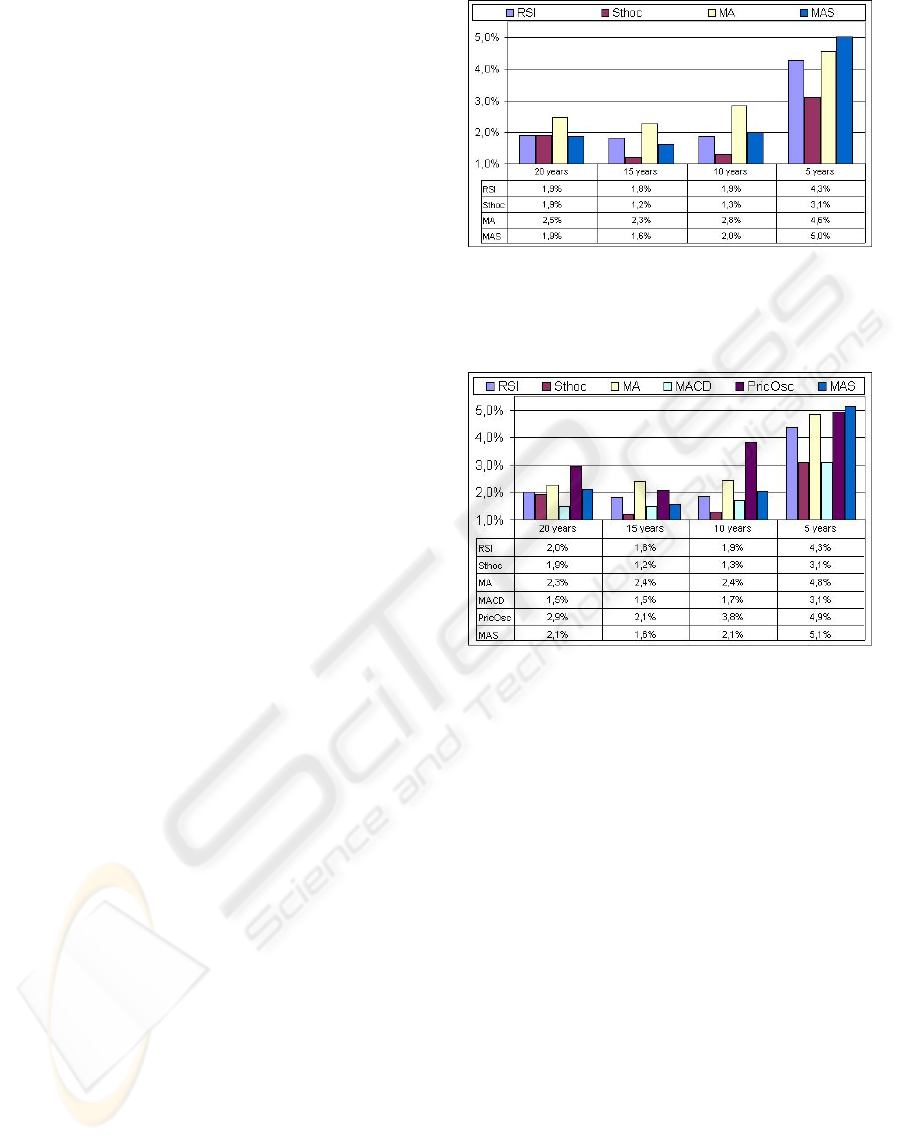
Figure 3: Sharpe Index obtained for agents groups of five
specific techniques and a Multiagent System (MAS) built
within the architecture proposed in this paper. Each column
indicates the stock group managed by each group of agents.
5.3 Result Analysis
The obtained results show that a multiagent system
built with the architecture proposed here achieved su-
perior result according to Sharpe Index compared to
all individual trader agents in the group of 90 stocks (5
years). In groups with fewer stocks, the results were
in the average. This happens because with more op-
tions to choose, the coordination mechanism has more
power to redistribute the resources among stocks. We
realized that the better average return from RSI is ob-
tained at cost of higher volatility (50% at RSI, and
34% at MAS).
By the graphs in figure 3, it is possible to realize
that RSI and Price Oscillator (PricOsc) have very con-
sistent Sharpe index compared to other agents. This
situation leaves very low space for improvement to
MAS, because there are few moments where these
agents are outperformed by others. The MAS ex-
plores this moments to achieve better results than in-
ICEIS 2007 - International Conference on Enterprise Information Systems
142

dividual agents, but the difference obtained is not very
significant. This limitation may be overcome with the
introduction of new trader agents. As pointed in sec-
tion 5.2, we achieved better results with higher num-
ber of techniques and higher number of stocks in sim-
ulation. Therefore, we believe that the design and im-
plementation of new trader agents may improve the
overall system performance when analyzed by Sharpe
index.
Our architecture reduces the effort to design and
implement such new trader agents. Even the imple-
mentation of techniques created by economists to be
used by human analysts (like the five examples pre-
sented in the section 3) can be done quickly, because
the designer does not need to care about communi-
cation with the exchange system or to achieve good
performance in all market situation. These problems
are treated by the assistance services and by the agents
society.
The growth of the number of traders types causes a
fast growth of the number of agents in the society, be-
cause each type is multiplied by the number of stocks.
However despite the big number of agents (452) in
the group of 90 stocks, the system was able to fulfill
a complete cycle in less than 25 ms. This good per-
formance and the discrete time approach allows the
use of such systems in intra-day operations. Where,
the interval between orders would not be one day, but
some fraction of a second.
6 CONCLUSIONS AND FUTURE
WORK
We presented here an architecture based on au-
tonomous trader agents, each one with its own inde-
pendent strategy. The trader agents are permanently
assessed and resources may be transferred to agents
with better performance. This approach allows adap-
tation in the agent society behavior, because agents
with more allocated resources have greater influence
on the overall system performance.
The proposed architecture may reach very good
results, as shown by the simulation results presented
in section 5.2. The improvement introduced is more
relevant when there are more stock managed and
more trader agents in the system. This is consistent
with the common notion in financial market, that port-
folio diversification is usually a good strategy. Fur-
thermore, the architecture reduces the effort to design
and implement new trader agents, even when their
strategies were developed to be used by human be-
ings. We intend to perform in the future some simula-
tions with a larger number of techniques and stocks,
to achieve better performance. The competitive ap-
proach may be also used in another problems with
similar characteristics: strategic games (the state is
determined by action of all players and one agent does
not know other agents strategies) and multiagent (sev-
eral agents act at the same environment). We intend
to study new applications for this approach in new do-
mains with these properties.
ACKNOWLEDGEMENTS
Jaime Sichman is partially supported by CNPq/Brazil
grants 304605/2004-2, 482019/2004-2 and
506881/2004-1.
REFERENCES
Appel, G. (2005). Technical Analysis: Power Tools for Ac-
tive Investors. Financial Times Prentice Hall, New
York.
Decker, K., Pannu, A., Sycara, K., and Williamson, M.
(1997). Designing behaviors for information agents.
In Johnson, W. L. and Hayes-Roth, B., editors, Pro-
ceedings of the First International Conference on Au-
tonomous Agents (Agents’97), pages 404–412, New
York. ACM Press.
Exchange, N. (2007). Nasdaq website.
http://www.nasdaq.com.
Kearns, M. and Ortiz, L. (2003). The penn-lehman au-
tomated trading project. IEEE Intelligent System,
18(6):22–31.
Sharpe, W. F. (1994). The sharpe ratio. Journal of Portfolio
Management, 13(3):227–286.
Sherstov, A. and Stone, P. (2004). Three automated stock-
trading agents: A comparative study. In Proceedings
of the Agent Mediated Electronic Commerce (AMEC)
Workshop - AAMAS 2004, New York.
Subramanian, H., Ramamoorthy, S., Stone, P., and Kuipers,
B. J. (2006). Designing safe, profitable automated
stock trading agents using evolutionary algorithms. In
GECCO ’06: Proceedings of the 8th annual confer-
ence on Genetic and evolutionary computation, pages
1777–1784, New York, NY, USA. ACM Press.
Yahoo (2007). Yahoo finance website.
http://finance.yahoo.com.
Yu, R. and Stone, P. (2000). Performance analysis of
a counter-intuititive automated stock-trading agent.
In Proceedings of the 16th Conference on Intelli-
gent Information Processing - 16th World Computer
Congress, Beijing, China.
Yuan Luo, K. L. and Davis, D. N. (2002). A multi-agent
decision support system for stock trading. IEEE Net-
work, 16(1):20–27.
TOWARDS COOPERATION AMONG COMPETITIVE TRADER AGENTS
143
